Artificially Augmented Training for Anomaly-based Network Intrusion Detection Systems

Author: Chockalingam Karuppanchetty, William Edmonds, Sun-il Kim, Nnamdi Nwanze
Journal: International Journal of Computer Network and Information Security(IJCNIS) @ijcnis
Article in issue: 10 vol.7, 2015.
Free access
Attacks on web servers are becoming increasingly prevalent; the resulting social and economic impact of successful attacks is also exacerbated by our dependency on web-based applications. There are many existing attack detection and prevention schemes, which must be carefully configured to ensure their efficacy. In this paper, we present a study challenges that arise in training network payload anomaly detection schemes that utilize collected network traffic for tuning and configuration. The advantage of anomaly-based intrusion detection is in its potential for detecting zero day attacks. These types of schemes, however, require extensive training to properly model the normal characteristics of the system being protected. Usually, training is done through the use of real data collected by monitoring the activity of the system. In practice, network operators or administrators may run into cases where they have limited availability of such data. This issue can arise due to the system being newly deployed (or heavily modified) or due to the content or behavior that leads to normal characterization having been changed. We show that artificially generated packet payloads can be used to effectively augment the training and tuning. We evaluate the method using real network traffic collected at a server site; We illustrate the problem at first (use of highly variable and unsuitable training data resulting in high false positives of 3.6∼10%), then show improvements using the augmented training method (false positives as low as 0.2%). We also measure the impact on network performance, and present a lookup based optimization that can be used to improve latency and throughput.
Network security, Anomaly detection, Intrusion detection, Web server security, Trainin
Short address: https://sciup.org/15011460
IDR: 15011460
Text of the scientific article Artificially Augmented Training for Anomaly-based Network Intrusion Detection Systems
Published Online September 2015 in MECS DOI: 10.5815/ijcnis.2015.10.01
-
I. Introduction
Cybersecurity is an increasing concern for both individuals and large organizations alike. The frequency and impact of cyberattacks are also growing. This trend is especially disconcerting given that most of what we do today rely on networked applications. The scale and importance of the problem can be seen in the world wide spending for information security solutions, which was $71.1 billion (US dollars) in 2014 [1]. There are many different types of security solutions in existence in both research and commercial domains today, aimed at protecting different parts of the networked applications.
However, to guarantee the level of security desired for future applications, improvements must be made in all facets of these security approaches.
The modern Internet is formed around the use of web sites, powered by web servers that host the various content. These servers are often targeted by cyberattacks for obvious reasons. A number of solutions are typically utilized ranging from firewalls to intrusion detection systems (IDS). In order to provide the most secure environment possible, these solutions need to be implemented at various entry points into the network as well as at individual servers. The continuous increase in the complexity and sophistication of the attacks make it difficult for any single security technology to meet the comprehensive security demands. Hence, various solutions must be utilized together (not necessarily in a cooperative manner, however, but more so as orthogonal, compounded layers). Further discussion of different technologies are presented in the next section with a focus on network-oriented, anomaly based intrusion detection, which has the potential to detect zero-day attacks (new, never-before-seen attacks).
These systems quantitatively model normal network activity, and flag anomalies that deviate from the model. Compared to signature-based detection, there are two disadvantages that are often cited including higher false positives and difficulty in training the system. One interesting issue that is often left out of discussion is the insight needed for training such systems for actual deployment. In this paper, we present a study of training IDSs for web server traffic considering the situations where the operating entity lacks historical data to form the basis for modeling normal activity. The approach also applies to the challenges that arise when changes are introduced to the website over time or via updates which inherently leads to changes in what is considered normal for the site(s) in question (concept-drift). These situations can lead to ineffective tuning of IDSs, resulting in high false positive rates or low detection rates, or both.
We first walk through the implementation steps starting with testing of the data collected for IDS training purposes. We experiment with the same data set by using it for both training and simulated detection. One should expect this self-test to pass with flying colors, but we show that IDSs can perform poorly due to variability and skewed nature of the collected data. Intuitively, the cookie field in the Hypertext Transfer Protocol (HTTP) inherently adds to the variability in the shape of the payloads. As such, ignoring this field for IDS processing yields better results. However, we also show that this change alone does not mitigate the problem. To augment this problem, we generate artificial payloads based on HTTP templates derived using some digital forensics information from web use factors. We call this the platform fingerprint, which includes the different fields inserted by popular operating systems and browsers, and how such information is embedded in HTTP requests sent to web servers.
We begin our experiment by capturing network packets that arrive at a web server. This traffic data is used to both train and test intrusion detection after a sanitization process, where precursory inspection is performed for known anomalies. Initial tests show that the variability in the training data (which was collected over a month) was not suitable for efficient training of the IDSs (high false positive rates ranging from 8∼10%). Artificial payloads are then used to retrain the IDS while cookies were both used and ignored. The results show that artificial payloads can be used to augment training with results showing high per-packet detection rates (>99%) and low false positive rates (<0.2%) for the tested system. Hence, this approach to using artificial traffic can help with the training stage both when an extensive volume of real traffic collected from a live site is not available (that is representative of the normal activity), and when the content hosted on the web server changes (thus leading to the same scenario of lacking pre-collected data). Finally, ignoring cookies (for the purpose of IDS) requires extra processing overhead. It should be noted that the cookies are not actually stripped and discarded. We measure the latency and throughput of the IDSs evaluated with and without cookie processing. We also present a lookup based optimization for the IDSs to allow faster computation of anomaly scores of incoming packets. We believe the insight gained from this study will be helpful in both IDS deployment for practitioners as well as in reasoning about potential modifications and changes to IDS configuration and continuous retraining algorithms.
The rest of this paper is divided into following sections. Section II covers some background information on IDS, as well as a brief discussion of related works and a high-level description of two payload-based anomaly detection methods used to evaluate the problem in question. We then illustrate the training problem in Section III, followed by discussions of our approach in Section IV. A summary of results are presented in Section V. Performance measurement and optimization are then discussed in Section VI. Finally, we conclude the paper with a summary and future works discussion in Section VII.
-
II. Background
In this section we present a brief overview of IDSs, discuss some related works, and provide a high level description of the particular flavor of payload anomaly detection from the research literature that was utilized in this paper.
-
A. Intrusion Detection Systems
IDSs are classified into signature and anomaly-based.
-
1) Signature based Intrusion:
Signature-based IDSs utilize a database of attack signatures to identify any incoming attacks, much like anti-virus software. Implementation/setup is easier than anomaly-based counterparts and yields low false positive rates. If the signature of the attack is not yet in the database, attacks remain undetected. These undetected cases may be in the form of obfuscated, previously detected attacks, novel attacks, or zero-day attacks. Upon every encounter of novel or new form of previous attacks, signatures are created for future use. Signature databases may also be kept up-to-date by syncing with trusted sources.
-
2) Anomaly based Intrusion:
Anomalies are detected by monitoring system activity and classifying the activity as either normal or anomalies. This approach requires a training phase to allow the IDS to learn what normal activity is. Determining the size of the training data set and its content is a research topic in and of itself, but reducing training time may be achieved by utilizing GPU processing [2]. Upon learning what normal traffic is, the detection phase flags activity that lies beyond the acceptable threshold of normal activity for further investigation. If the anomalous activity is benign, this turns out to be a false positive, which is the most prominent limitation for anomaly-based detection. False positives occur due to various reasons, such as a change in design of the monitored system (i.e. new web server features are added) or limitations of the feature extraction in the detection algorithm. Another design concern for anomalous-based IDS is the possibility of compromised training data.
-
3) Placement of IDS:
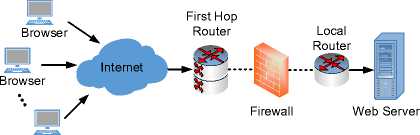
Depending on the level and scope of the data being inspected for attacks, the IDS can be placed in a number of different places along the path of information flow. Fig. 1 shows a high-level overview of the path through which a network packet, generated by an end-user’s web browser, traverses through the Internet to get to the webserver. The type of detection that we are concerned with can occur by the first hop router (the web-server’s gateway to the Internet, typically conjoined with their Internet Service Provider) or at the local router or the host server system itself.
Browser
Fig. 1. Overview of network packet traversal from the browser to the web server.
-
B. Related Works
The trade-off between accuracy, complexity, and detection delay between header-based and payload-based anomaly detectors is discussed in a comparative study in [3]. Header-based inspection may be found in [4], [5]. Hidden Markov Models, artificial neural networks, Bayesian networks, fuzzy sets, and genetic algorithms are also being used to identify anomalies in [6], [7], [8].
Service-specific IDSs have been proposed where the anomaly score of a request is calculated using three properties: type of the request, length of the request and payload distribution [9]. Also, many apparoaches regarding web logging and parameter inspection can be found in the literature [10], [11], [12], [13]. Investigation of anomalous activity in HTTP GET requests and the parameters used to pass values to server-side programs were performed in [14]. The GET requests are recorded in the web server’s access logs and were used to extract features such as the presence or absence of attributes (parameters), length of attributes, character distribution in the attributes, the order of attributes, access frequency, inter-request time delay, and a few others.
Variables that may affect the performance of anomalybased system include content changing on the server, such as web pages, and possibly the use of data sets that are not pertinent to traffic in the wild. This concept drift can also occur when web pages are frequently modified according to the needs of the user (e.g. links, icons, etc.), which can influence the traffic patterns [15]. An evaluation of the anomaly-based IDS using public data sets was conducted reviewing their accuracy and ability to reflect real life conditions [16].
-
C. Training and Detection Based on Payload Anomaly
Research on network packet-based intrusion detection can be found in the literature, which can be categorized as header-based, payload-based, or a mix of the two paradigms. Further classification and their components can be found in [17]. Headers provide information such as source, destination, protocol, size, etc., while the payload contains the actual data. Intrusion detection schemes can further be divided based on the analysis approach taken in the algorithm, which include statistical, occurrence, semantic, or a hybrid analysis. Stat-based analysis uses statistical methods to determine the norm of the traffic, while occurrence-based analysis flags features of the traffic that has not been seen before. Semanticbased analysis looks at what the packets do and determines their validity with respect to how the packets will actually be utilized by the system, and a hybridbased approach may take any combination of the aforementioned paradigms to take advantage of the different features each paradigm brings to the table. In this paper, statistical analysis was performed on the packet payloads via byte-value frequency distributions. We utilize the schemes described in [18], [19], to take advantage of their efficacy with low latency, and the potential robustness against having contaminated training data (for [19]). We provide a brief overview, and further details can be found in the referenced works.
For both of the above mentioned schemes, the same basic frequency based measurements are conducted at first using the training data set. Training data should be a good representation of the monitored system’s normal traffic, thus real traffic packets destined for the system is normally utilized. The local traffic selected for training may be sanitized by removing known attacks or misuse packets via signature-based tools to reduce and help prevent false negatives. Depending on the network, traffic volume and content may vary due to various factors, and updating the training data and retraining the system allows the IDS to remain current with the patterns of normal traffic in the system. As previously mentioned, choosing the size and content of the training data is a research topic in and of itself, and requires careful consideration. Given the mean and the standard deviations for each byte value, the two methods differ as follows. Once the training data set is formed, byte frequency (bin) norms are calculated by determining the mean and variance/standard deviations for each byte value appearing inside each payload. Note that the max possible frequency of any single bin value is 1460, limited to the payload size in a TCP/IP packet over Ether Frame.
-
1) PAYL [18]:
The degree to which each packet payload deviates from the norm (anomaly score) is found by computing Xi-Xi /(σi + α) for all byte values and adding them together for i = 0 to 255. Xi is the mean for byte value i, and σi is the standard deviation for the byte value as obtained from the training data set. A threshold is set that provides an acceptable range of detection and false positive rates based on the training data set (both for normal traffic and some attack data set).
-
2) PBD [19]:
Given Xi and σi for each bin i, the normal range of each bin is determined by using a tuning parameter α such that the range is within Xi ± ασi . The anomaly score is computed by determining whether each of the 256 bins are normal or not. Each bin receives a score of 0 (normal) or 1 (otherwise), and the scores are summed across all bins. Therefore, the overall anomaly score for a packet can range from 0 to 256. Similar to PAYL, a threshold score is utilized, subject to tuning by the network or systems administrator(s).
-
3) Size normalization:
For both algorithms, we also test size-normalization method. For each value used in computing the mean and variance of each bin in the training set, normalization is done with respect to the size of the packet. Therefore, the values that are used for computing the anomaly score are fractional figures that represent what percentage of the payload is made up of each bin. Our results are consistent with what is found in the literature, where the results are improved in general when normalization is used, especially for PAYL.
-
III. Variability In Training Data Set
In this section, we discuss one of the most important steps in deploying an anomaly-based IDS, and some of the challenges that one may run into. Training (and tuning) of the IDS is critical for optimal efficacy, and the overall results depend on two parts working in concert. First, the IDS scheme must provide an effective training and tuning strategy. Second, in order to characterize the normal traffic or activity, there must be an adequate training data for the specific system being protected. This second part can be a challenge and requires careful selection by the system administrator(s). When put to practice, one common problem that many run into is the variability in the collected traffic that is used for training. For example, if the same exact set of traffic data is used for both training, and then later to test detection capability, it should ideally result in a high detection, low false positive setup. However, it may not perform as expected due to some variability in traffic (due to either fluctuation that may be normal for the site or concept drift caused by some form of content changes). We next discuss performing some initial tests to check the suitability of the training traffic, which help in revealing these potential problems. We also show that cookies in HTTP traffic add to the variability.
-
A. Kolmogorov-Smirnov Test
The two-sample Kolmogorov-Smirnov (KS) test is widely used to compare two samples and report the variations in between the two samples. The KS test is a general nonparametric test for comparing two samples. The KS statistic calculates distance between the empirical distributions of the two samples under consideration. The KS statistic can be calculated using the supremum function computing Ds , s l = sup x |F 1, s (x) - F 2, s l (x)|, where F 1,s (x) represents the empirical function of 1st sample and F2,s l (x) represents the empirical function of 2nd sample.
Because the KS test reveals some aspect of the statistical relationship between the two samples, we applied the technique for the network traffic collected at one of the university web servers. The test requires two samples as input. The training data is split into a different number of sets for comparison. One of our collected traffic sets (discussed later), which consists of 25222 packets, was split into sets of about 1000 packets. Each consecutive set was compared to using the KS test. Each comparison actually consists of 256 independent KS tests, since the comparison is performed for each bin (byte value). In Fig. 2, the X-axis shows the byte value, Y-axis shows the packet sets and Z-axis shows the KS statistic value. Our modification to the KS test (since we need to summarize 256 tests into one result) was to look at the fraction of the total bins that suggest that the sets are not from the same distribution. The collected traffic fails the test for many set pairs for the byte value ranges 0 to 128. Beyond 128 (not shown), most packets do not contain much data (typical for non-encrypted HTTP), and thus have low KS statistic value (which would suggest that they are from the same distribution: all are near zeros anyway). When the data was split into two sets of approximately 12.5k packets each, the result was slightly more consistent, but both tests revealed inconsistency in the traffic. As a reference, other representative traffic sets such as the DARPA dataset are more artificial in nature, and thus found to be more consistent. The threshold at which one may consider the test sets equivalent is not clear however. Therefore, we derived a another modified KS test to see if anomaly detection may be actually performed given a KS test consisting of a sample distribution (the data set) vs. a single sample (a single packet from the data set). In this method, the resulting KS statistic value average across the bins was used to find a threshold for detection. When tested, it resulted in over 8.7% false positives, which is unacceptable.
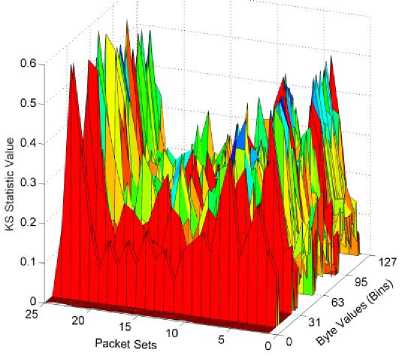
Fig. 2. KS test with sets of 1000 packets each.
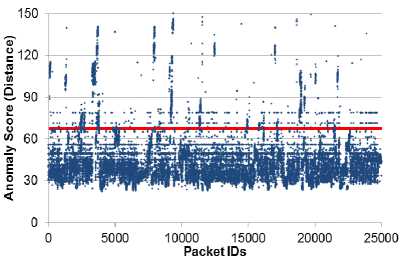
(a) With Cookie (7.6% above threshold)
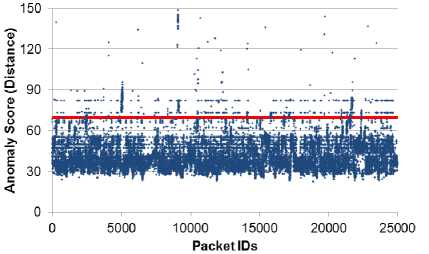
(b) Without Cookie (3.1% above threshold)
Fig. 3. Self-Assessment test for WEB Traffic with threshold line shown.
-
B. IDS-based Self Assessment
Prior to deployment, the potential performance of the IDS is typically tested. A set of collected traffic can be used for both training and testing of the setup. For illustration purposes, we again utilize the same exact data set for both training and testing for PAYL. This scheme utilizes the Mahalanobis distance for each packet, which shows how much each packet is varying from the mean value obtained from the training data. There is a possibility of having the standard deviation of zero, which leads to a divide by zero error. To avoid this problem a (non-zero) smoothing factor is added to the standard deviation. We utilized a varying number of smoothing factors, and the differences were insignificant. The specific results we discuss are from having used a smoothing factor of 0.5. Using PAYL, the best tuned performance was not satisfactory, yielding over 10% false positives, which in turn suggests that the traffic collected is not representative of a general normal activity and that there are variations unaccounted for. Fig. 3a illustrates the anomaly scores along with the threshold line shown.
-
C. Impact of Cookies
In Fig. 3b, we show what happens when the IDS ignores the cookie portion. A significant change is actually seen in the false positive rates. Table 1 shows the summary for both test methods discussed while comparing the results that depend on the presence of cookies. The variability attributed by the cookies is due to the fact that they contain hash values that are random, especially compared to other parts of the HTTP payload.
Table 1. Test Results
|
Algorithm |
Cookie |
TP |
FP |
|
KS-based |
Present |
0.9926 |
0.0874 |
|
KS-based |
Stripped |
0.9926 |
0.0368 |
|
PAYL |
Present |
0.9928 |
0.1002 |
|
PAYL |
Stripped |
0.9924 |
0.0358 |
A significant improvement can be seen as a result of realizing that the cookie portion (1) cause increased variability and (2) does not contain attacks that anomalybased IDSs care about. Therefore, the cookie portion can be ignored in computing the bin histograms for use by the IDS. There are cookie-based attacks, but they are orthogonal problems. Typically, these attacks basically attempt cookie tampering or identity spoofing, which are outside the scope of this paper (this issue is further discussed in Section IV.c.). Despite the improvements, however, the resulting false positive figures are still not low enough for practical considerations. Therefore, we next discuss another mitigation technique, which together with cookie bypassing can improve training and tuning.
-
IV. Augmented Training Methodology
In this section, we describe an approach that can be used to augment the training and tuning step if there is too much variability in the traffic (as demonstrated in the previous section) or if the site lacks relevant historical data. Essentially, the problem is the lack of traffic data that can be used to model what the system will perceive as normal activity. To this end, we ask the following question. Is it possible for the system to artificially generate traffic that can be used for training such that it allows for sufficiently high detection and low false positive rates? Such technique can allow the system to tune itself from the time at which the site first goes public.
Then, as real traffic is obtained, further tuning can take place in real time. More importantly, it also allows for changes in the site content to be reflected as soon as those changes go live. It is not meant as a replacement for having real data nor should one expect the artificial traffic to be better a real data set that is representative of the site activity; Rather, it fills the gap when the captured traffic has unforeseen variability or when there is not enough volume of traffic sufficient for IDS training. To address the problem described above, we investigate the use of some information forensics to create artificial packet payloads for incoming HTTP requests. First, we illustrate what the request payload looks like for the protocol in question. Next we discuss the pertinent parts that vary based on current use trends of web technologies (external factors) as well as parts that are related to the site content (internal factors). We then discuss how to artificially generate those parts to create the artificial packet payloads.
-
A. Underlying Protocol: HTTP over TCP/IP
Fig. 4 illustrates the internal structure of an Ethernet frame (IEEE 802.3, also with 802.1Q Tagging). The actual payload that we are interested in is the TCP/IP payload. This portion is found inside the Ethernet payload, minus the TCP/IP headers (40bytes). Therefore, the maximum size per-packet is 1460 bytes. The HTTP protocol, found within this payload, contains many different fields. A simple example is shown in Fig. 14. This example contains fields such as connection, cachecontrol, Accept and User-agent. There may be up to 47 of such fields as of HTTP/1.1. In practice, they vary depending on which platform combination was used to generate the request. User settings can also change the fields (such as the use of DO NOT TRACK setting). Finally, cookies are also an important part of the anatomy, and discussed separately below.
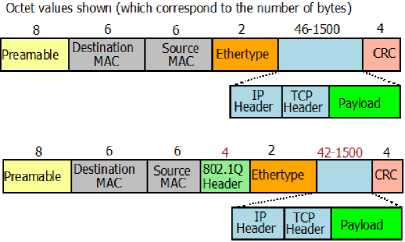
Fig. 4. Ethernet frame format with maximum 1500byte payload for HTTP/TCP/IP (bottom is with 802.1Q Tagging).
-
B. Artificial Packet Construction
Using the typical anatomy of the network packets that are sent to web servers, we show that it is possible to construct packets that resemble real traffic (well enough to be used for training an IDS). This process requires two types of information described below. First, the make-up of the various parts of the HTTP protocol is what defines the characteristic of the web traffic. This portion largely. consists of information generated by the different endusers’ web-browser, based on the different hardware and software configurations on top of which the packets are generated. Second, the access to resources on the web server requires that the request message contain the string that identifies the resource. This string also constitutes a part of the protocol that plays an important role in traffic characterization.
-
1) External Factor: Platform Fingerprint:
When a user accesses the web server, he or she does so under a particular combination of devices and software (as well as different versions of the software). Each different type of device or software leaves different fingerprints inside the payload (the HTTP message). It is difficult (if not impossible) to collect the signature of every possible device and software combination. However, we found that a general sketch can be drawn using a combination of different sets of most popular devices, web browsers and operating systems. These combinations generate different strings that become part of the message sent to the server. We term this the platform fingerprint.
Fig. 5 shows the breakdown of the browser popularity for the past five plus years (January 2010 to April 2015) as reported by W3Counter [20]. The first thing to note is that, though the market share by each browser has changed over time, the overall percentage of the top five most utilized browsers has stayed relatively constant at around 99%. This shows that investigating the top five browsers allows significant coverage of the actual user statistics, and further shows that many other browsers may effectively be ignored (until such market share breakdown changes, of course). These figures are consistent across other sources such as StatCounter, Wikimedia and NetApplication [21], [22]. The use of the
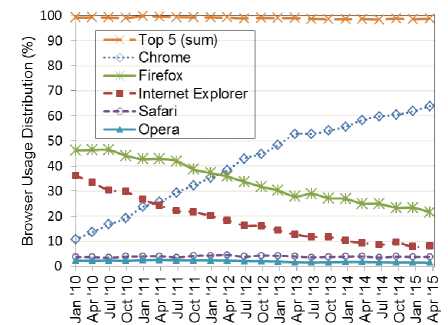
Fig. 5. Popularity of browsers in the last 5 years.
top web browser's signatures, therefore, can provide a representative set that covers a large fraction of the activity targeted towards the web server.
In total we put together 28 platform fingerprint templates generated by taking the different browser and operating system combinations. Investigating the composition of these templates revealed similarities across many. Thus, we eliminated the templates that were similar and selected 10 unique templates. The platform combinations for these 10 templates are shown in Table 2. There are four combinations including the Chrome browser as the payloads it generates has more variations.
Table 2. List of HTTP request templates used for training
|
Device |
Operating System |
Browser |
Version |
|
PC |
Ubuntu |
Chrome |
37 |
|
PC |
Windows 7 |
Chrome |
38 |
|
Smartphone |
Android 4.1 |
Chrome |
18 |
|
Smartphone |
IOS 7 |
Chrome Crios |
36 |
|
PC |
Windows 8 |
Internet Explorer |
11 |
|
PC |
Ubuntu |
Firefox |
33 |
|
Smartphone |
IOS 8 |
Safari |
8 |
|
Tablet |
IOS 8 |
Safari |
8 |
|
PC |
Windows 8 |
Opera |
25 |
|
Smartphone |
Android 4.4 |
Android Browser |
4 |
It is interesting to note that some browsers generate and send cookies along with their initial HTTP request. In other words, even though the site that is being requested has never been browsed before, and therefore no cookies were left by the web server in question, the user’s browser can insert a cookie. The appearance of cookies plays an important role for what we are trying to convey in this paper, and is discussed more in a later section. (As examples, two templates are shown in Fig. 13 and Fig. 14 in the Appendix, with and without cookie respectively.)
-
2) Internal Factor: Resource URL Extraction:
The access to resources residing on web servers occurs through a sequence of user and automated HTTP requests. Users clicking on links generate the request for that particular resource, whereas loading of the page requested by the user leads to the generation of subsequent request messages to fetch all resources contained within the page. The string that identifies these resources is part of the URL that is included in the packet payload sent to the server. These URL strings play a significant factor in characterizing the normal traffic for a server.
The possibilities for a valid resource URL are limited by the actual resources stored on (and advertised by) the server. Therefore, our normal traffic estimation scheme includes the extraction of all available resource URLs from the server, including CSS scripts, Java scripts, images, etc. To perform the extraction, a script was written which searches through the web server collecting all of the resource strings present in the server. The script first requests for the index.html or the home page of the web server. When the request for the page is sent to the server, the server sends a response which contains a status code, a list of header fields, a blank line and then the requested document. The requested document contains the links to the various other resources used in that page, as well as the URLs of other pages to which you can navigate to. There are some spider tools that are available, such as [23] and [24], but they are not suitable for this task as they have issues dealing with relative URL matching, page redirection, and HTML entities.
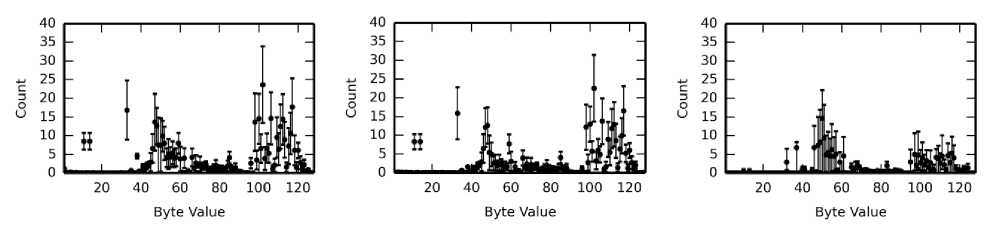
(a) Real traffic with cookies, without cookies, and cookies alone.
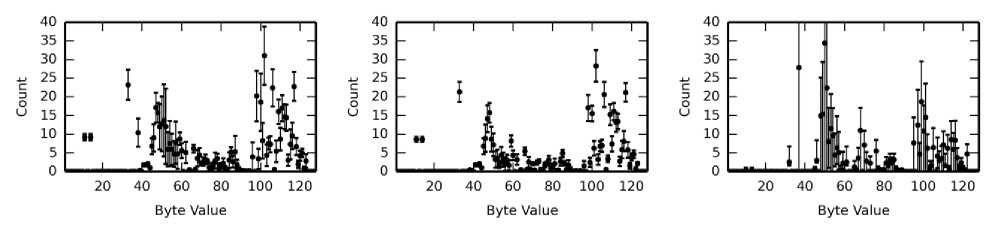
(b) Artificial traffic with cookies, without cookies, and cookies alone.
Fig. 6. Byte value counts for values 0 to 127. Difference can be seen visually.
-
C. Ignoring Cookies for IDS
When a URL is typed into a web browser, the browser checks to see if any cookies related to that web server are already present. If such a cookie is found, the cookie is sent to the server along with the request for the URL in question via the HTTP request message. If the cookie for the server is not found, no cookie data is sent. On the server side, if the request message does not contain any cookie name-value pairs, the server assumes that the user is visiting the site for the first time (or its history has been deleted). A cookie is then generated and sent to the user's device with some name-value pairs along with other attributes such as expires and max-age. Google Chrome is an exception in that it will itself inject cookies to request messages going towards never-visited sites for tracking and statistics collection.
Often, hash values can be found within the cookie, and similar to encrypted text, they are randomly distributed, which may pose some problems to the IDS. That is, these values may affect the normal characterization process. Therefore, we investigate the impact of removing the cookie (for both training and testing stages).
Note that we must understand that attacks cannot be contained with the cookie portion if the IDS is to consider ignoring cookies from incoming packets. Most common attacks involving cookies are used to impersonate another user/machine in what is known as session hijacking. In such scenarios, valid cookies from another user/machine are stolen, which may allow the attack to gain access using another person’s credentials. These types of attacks are outside the scope of our work because packet level inspection schemes cannot detect these instances as they would look completely normal to the system. As such these attacks are assumed to be addressed at a different layer, and it is an orthogonal issue that is outside the scope of this paper.
-
V. Results
In this section, we provide a description of the experiments and discuss the results. The tests were performed on network data we collected (32 days of traffic going towards a web server hosted at the university) as well as a set of known web attacks consisting of 2485 attack packets (from DARPA data set as well as newer attacks including Code Red ii and Nimda). The captured packets are processed with WireShark for analysis, and Snort was utilized to attempt to sanitize against known attacks being included in the training (non-attack) set. In our data, no known attacks were found. We also sanitized the traffic by removing some anomalous packets with payload sizes larger than that of the standard MTU. These large packets were segmented before transmission and reconstructed before being dumped by the collection method we used via the pcap library. We performed an analysis of these packets and found that, interestingly, they contained what appear to be attempts to look for victims for future attacks. There were five instances of this type of anomaly (three in the training set, two in the
testing set). They were removed from the training set to avoid skewing the results, which is consistent with standard procedure for preparing training data. Of the traffic collected over 25k packets were used for training (which we refer to as the real training data), and over 13k packets were used for testing. About 25% of the packets contained cookies for both sets. There are 7160 artificially generated packets in the artificial training set. This set is composed of 716 unique resource strings (mined from the web server being protected) in combination with the 10 templates based on platform fingerprint generation. This data set, based on the web server at the university is referred to as WEB. In addition to the attack packets, we also utilize the normal packets from the DARPA 2000 data set (both Week 1 and Week 3) to show that the base IDS performance that we report is in line with other existing works.
The three figures in Fig. 6(a) show the byte value frequency distributions for the collected traffic, both with cookies and after having the cookies stripped from the payload. The right most figure shows just the cookies from this set. We refer to the traffic collected by capturing actual incoming network packets as the real traffic. The same information is illustrated in Fig. 6(b) for the artificial packets. The frequency distributions are quite different between the cookies and the rest of the payload as expected, where the values found in the cookies are more uniform across the readable ASCII text range due to hash values contained in the cookies (but they are not completely uniform because they are not entirely hashes). The cookies we captured and used in the artificial packets have high variance because there were only five unique default cookies used for the platform fingerprints tested.
Tables 3∼6 show the summary of results for the various settings based on the use of real or artificial packet payloads for training. The normalized version of each algorithm is denoted by the star (*), and the respective true positive rate (TP), false positive rate (FP) and the area under the curve (AUC) are shown. Only real traffic is used for actual testing for detection and false positive rates. They are differentiated by the WC (with cookie) and WoC (without cookie) designations. The results show two main points of interest. First, they indicate that the use of artificial packets may be effective in helping with the training of the IDS. The DARPA results are shown for comparison. As DARPA data is easier to work with, the IDS performs quite well. Relatively, the IDS schemes perform worse using our real world traffic (WEB), especially when real traffic is used to train the system with the cookies intact. The artificial payload use for training, along with the method of ignoring cookies for incoming packets yields significantly better detection performance. It should be noted that this does not suggest that artificial payload is better than real traffic; rather, it shows that weeks of data that was collected at the site was not suitable for testing and that the artificial payload was a practical substitute in the absence of good training data. Second, as expected, ignoring cookies yields better performance in general.
Table 3. PAYL results
|
Data Set |
TP |
FP |
AUC |
|
DARPA W1 |
0.9932 |
0.0071 |
0.9974 |
|
DARPA W3 |
0.9948 |
0.0130 |
0.9943 |
|
WEB (Real WC) |
0.9936 |
0.0746 |
0.9929 |
|
WEB (Real WoC) |
0.9932 |
0.0283 |
0.9976 |
|
WEB (Art. WC) |
0.9936 |
0.0209 |
0.9985 |
|
WEB (Art. WoC) |
0.9932 |
0.0180 |
0.9986 |
Table 4. PAYL* results
|
Data Set |
TP |
FP |
AUC |
|
DARPA W1 |
0.9899 |
0.0001 |
0.9996 |
|
DARPA W3 |
0.9899 |
0.0019 |
0.9996 |
|
WEB (Real WC) |
0.9907 |
0.0083 |
0.9991 |
|
WEB (Real WoC) |
0.9907 |
0.0082 |
0.9991 |
|
WEB (Art. WC) |
0.9899 |
0.0080 |
0.9979 |
|
WEB (Art. WoC) |
0.9907 |
0.0019 |
0.9990 |
Table 5. PBD results
|
Data Set |
TP |
FP |
AUC |
|
DARPA W1 |
0.99557 |
0.00063 |
0.9993 |
|
DARPA W3 |
0.99235 |
0.00232 |
0.9984 |
|
WEB (Real WC) |
0.99315 |
0.01811 |
0.9903 |
|
WEB (Real WoC) |
0.99356 |
0.01518 |
0.9919 |
|
WEB (Art. WC) |
0.99235 |
0.01518 |
0.9916 |
|
WEB (Art. WoC) |
0.99275 |
0.00811 |
0.9946 |
Table 6. PBD* results
|
Data Set |
TP |
FP |
AUC |
|
DARPA W1 |
0.9497 |
0.0006 |
0.9992 |
|
DARPA W3 |
0.8970 |
0.0007 |
0.9992 |
|
WEB (Real WC) |
0.9907 |
0.006 |
0.9963 |
|
WEB (Real WoC) |
0.9907 |
0.0025 |
0.9952 |
|
WEB (Art. WC) |
0.9907 |
0.0048 |
0.9962 |
|
WEB (Art. WoC) |
0.9883 |
0.0028 |
0.9967 |
The use of cookies for training degrades the performance because of the potential randomness in the cookies’ byte values. During the detection stage, the use of cookies also degrades performance (regardless of whether the system was trained with or without cookies) because the cookies that appear in individual packets may vary significantly from the previous cookies. These findings are consistent with our previous discussion. The numbers are consistent with previous findings, where we expect to see false positive rates below 1% and between 1 to 2% for operating points that are not tuned well [18], [19]. Note the high per-packet detection rate (>99%) reported for nearly all data points. In practice, in order to lower false positives, detection rates can be lowered without significantly affecting practical security. (Fig. 15 and Fig. 16, which are presented in the Appendix, show the Receiver Operating Characteristic (ROC) curves for the different approaches, and illustrate the different potential operating points. These figures illustrate that the performance of training with artificial or real traffic while also considering whether or not to ignore the cookie portion.)
-
VI. Performance Evaluation And Tuning
Given that ignoring cookies requires the knowledge of where the cookie starts and ends, there is going to be some cost in terms of latency (and subsequently impact of throughput) associated with this choice. In this section, we evaluate the latency and maximum throughput of the different IDS schemes we covered both with and without the cookie-related processing overhead. We also present a novel performance optimization that should be utilized in practice, and show our evaluation results for using the optimization with normalization techniques.
Fig. 7 illustrates the different operations that take place inside a network router if the IDS were to be implemented alongside the router. The routing functionality is not associated with the IDS and will occur regardless of the presence of the IDS. Packet header information is utilized, and as such the header processing operation also is incurred regardless of the IDS placement. Inside the IDS portion, there are two parts: Cookie "stripping" 1 (string search, which is optional) and the detection algorithm. In a realistic implementation, these two parts should be pipelined. In a pipelined scenario, the average throughput will be determined by the dominant operation (slowest of the two). We report the latency and throughput figures for each of the operations, as measured on a desktop machine with an AMD FX-8350 CPU, with each operation performed with a single thread.
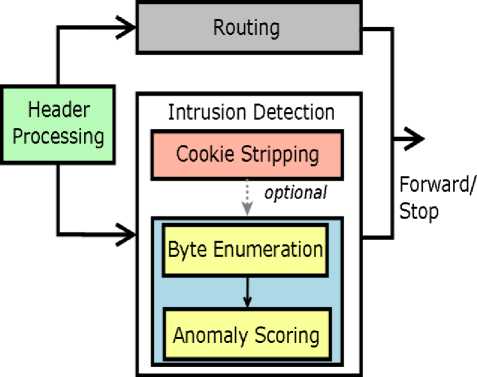
Fig. 7. IDS on a Router.
Note that, despite the name cookie "stripping," our approach does not discard the cookie portion. We simply pass on the non-cookie portion to the detection algorithm such that the cookie is ignored by the IDS.
-
A. Cookie Search Penalty
The search for cookie involves the use of a string search algorithm over the packet payload, and consists of two consecutive searches. First, the string "\r\nCookie:" is searched, followed by a standard terminator "\r\n" for the HTTP protocol that marks the end of the cookie.
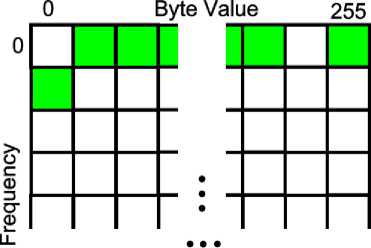
Fig. 8. Lookup Table.
We show how three well-known algorithms perform— Boyer-Moore-Horspool (BMH), Rabin-Karp (RK), and Knuth-Morris-Pratt (KMP).
The test payload format assumes that some fields (for example, GET) show up before the cookie portion. We test max size payloads since they are the worst for string searching, and the "\r\n" showing up at the very (also worst case). The distance between "\r\nCookie:" and "\r\n" is what determines the cost of the search, and the further apart they are the worse it is. If the "\r\nCookie:" portion shows up later, its distance is closer to "\r\n ", and if the "\r\nCookie:" portion shows up earlier, the distance increases. Because of how the more efficient substring search algorithms work, the shorter substring length ("\r\n" is shorter than "\r\nCookie:") leads to worse performance. In this case, the difference of seven characters does not amount to much. We constructed our tests to represent the worst case. Table 7 shows the latency and throughput values for the different algorithms.
Table 7. Performance of Cookie searching
|
Algorithm |
Latency (ms) |
Throughput (Mbps) |
|
BMH |
0.0053 |
2202.5 |
|
RK |
0.0180 |
648.5 |
|
KMP |
0.0052 |
2226.5 |
-
B. Look-up Optimization
Table 8 shows the different latency values for each of the algorithms used. The total time includes, in addition to the detection algorithm time, both the header processing and byte enumeration times. The header processing and byte enumeration delays are same across all at 0.00006 ms and 0.00359ms respectively. For byte enumeration, the time we report is for the maximum size
Table 8. Performance Measures
In both PAYL and PBD, the anomaly score for an incoming packet is computed in real-time to determine whether or not the packet is anomalous. Instead, we propose a table lookup method, where each byte value’s contribution to the anomaly score is precomputed and stored in a table based on their frequency count. Because each byte value can occur a maximum of 1460 times (if the entire payload consists of this single byte value), the table must be 256×1461 (Fig. 8). This is equivalent to approximately 1.4MB of storage overhead. At run-time, this table can be used to perform 256 lookups followed by simple addition operations to add the values rather than performing the entire computation for determining the anomaly score. For example, in the figure 256 indexed locations are highlighted corresponding to packet’s byte value distribution. The byte values 0 and 254 have frequency counts of 1 and 1459, respectively, and the rest do not occur, so they are all 0s. This is an example of a 1460 Byte packet. Each of the highlighted indexed location’s contains the precomputed per-bin anomaly value, which can be simply added rather than recomputing these values every time a new packet is inspected. The resulting latency is 0.0011ms, which is an improvement over the standard implementation. Where the lookup shines, however, is in the size normalized versions of the algorithms (again, denoted with a *). Because of the added overhead, the normalized versions are slower, and relative to that, the lookup method offers roughly 40% to 70% faster performance, which in turn equates to a significant throughput gain.
There is a critical issue that needs to be resolved regarding the use of the lookup method for the normalized versions of the IDS schemes. When normalization is used, the byte value counts have no

Fig. 9. Lookup table size variation for PAYL* using DARPA Week 3 traffic.
with lookup without lookup
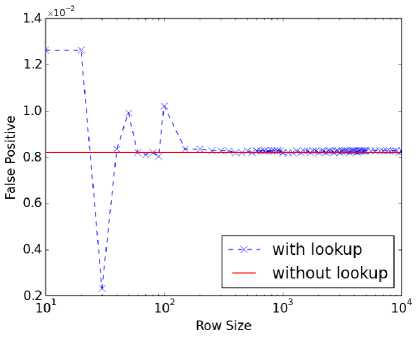
Fig. 10. Lookup table size variation for PAYL* using WEB traffic without cookies.
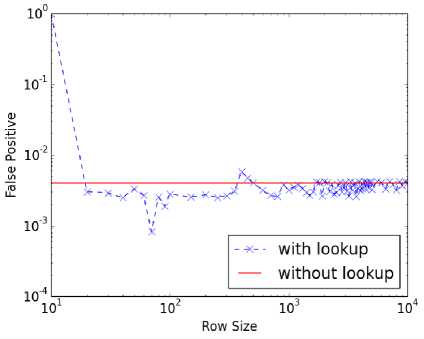
Fig. 11. Lookup table size variation for PBD* using DARPA Week 3 traffic.
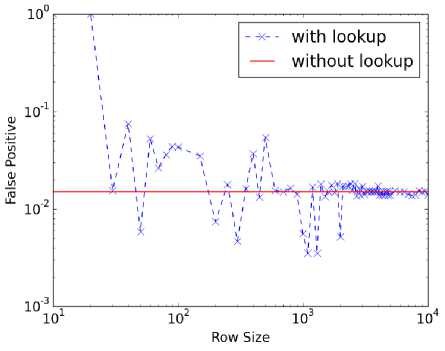
Fig. 12. Lookup table size variation for PBD* using WEB traffic without cookies.
actual count values. The fractional values can be quantized into integers to fit the row indices of the table. For example, if we allow for 1001 rows, each increment of 0.1% value would map to each row. A percentage value of 43.7, for instance, would then fit into row 437. Because the quantization does not result in an exact alignment, we tested different row sizes from 10 to 10000. Figures 9 ~12 show our test results. In the figures, the Y-axis represents false positive rates (all corresponding to high detection rates).The line that represents the performance without using the lookup table (W/O lookup) is the reference performance. At row sizes of over 1000, convergence of the results can be seen. The number of rows can be set to 1461 just to match the size of the original lookup table, but the size normalization can be performed without any added penalty in storage.
-
VII. Conclusion And Future Works
In this paper, we considered the possibility of tuning payload anomaly based IDSs when the system lacks the collected traffic (in either quantity or quality) to effectively model the normal behavior. We evaluated the use of artificially generated payloads for training the system. We also investigated the effect of ignoring the cookie portion of the HTTP/TCP/IP packet payloads on the effectiveness of the IDS in characterizing the normal traffic. Our results showed that the augmented training method utilizing artificial traffic, while ignoring cookies can effectively be used. We also quantified the worst case latency introduced by the processing overhead of the cookie stripping method, as well as the IDS algorithms themselves. Maximum throughput values were also reported.
The need for frequent updates to the IDS, whether it is adding new signature to the database or re-characterizing normal pattern/behavior, is becoming increasingly important. This trend is driven by both the increasing rate of attacks and the more dynamic nature of the system that is being protected. In the case of web servers, the need to retrain the system with new data can also arise due to the change in the content hosted by the server. To this end, an ontological model of the website, based on both autonomous algorithms and guidance provided content developers, may be utilized to guide the training. Such technique can be especially useful when the training is performed with a mix of real traffic along with the artificial ones.
As protecting web servers involve security against many different types of attacks, no single solution will suffice. Rather, different approaches need to be utilized simultaneously to ensure maximum protection. One of many different types of tradeoffs across cost, performance, overhead, etc., is that of training overhead. To this end, we are currently investigating the use of lowcost, dedicated subsystems to perform the task of constant monitoring and updating to allow dynamic, near real-time tuning of IDSs. The insights gained from this particular study thus far have been beneficial for such systems. Understanding the degree to which different security paradigms can co-operate, and analyzing the implementation costs are also going to be interesting in going forward
Appendix A Figures
We provide additional figures from the various discussions in the paper (shown in the following page). Fig. 13 and Fig. 14 are artificially generated templates from the discussion in Section IV.B.1. The highlighted parts are unique to the particular platform combination, with the rest being standard fields that will be found across different platforms. This example assumes that the web address is at , and that an attempt is being made to fetch a file named
Fig. 15 and Fig. 16 are ROC curves from the discussion in Section V. The Y-axis is the true positive rate (detection) and the X-axis is the false positive rate. The use of artificial and real traffic is compared while also considering the cookie usage. The artificially augmented method works well, and can be used to help supplement training strategies. Note the lower end of the Y-axis is at 0.988. The two next highest true positive rates found across all cases were around the 0.7 and 0.5 marks, which are too low to be of use for any kind of intrusion detection.
Acknowledgments
The work presented in this paper was supported in part by Northrup Grumman and 2014 UAH RIF. The authors would like to thank Sara Graves, Ken Keiser, Michael McEniry, and John Rushing from the Information Technology and Systems Center at the University of Alabama in Huntsville for their support. The views expressed in this work are that of the authors only, and do not necessarily reflect the position or the policy of the above mentioned organizations.
Host:
Connection: keep-alive
Accept:text/html,application/xhtml+xml,application/xml;q=0.9,*/*;q=0.8,image/ webp
User-Agent: Mozilla/5.0 (iPhone; CPU iPhone OS 7_1_2 like Mac OS X)
AppleWebKit/537.51.2 (KHTML, like Gecko) CriOS/36.0.1985.49 Mobile/11D257
Safari/9537.53
Accept-Encoding: gzip,deflate,sdch
Accept-Language: en-US,en;q=0.8
Cookie: _ga=GA1.2.1329186302.1409018745;
km_ai=Q7UccLTzSzsd0Gpr0lLn9I2Caf8%3D;
%252Fdepartments%252Fcomputer-science%26Referrer%3DDirect%26_n%3DVisited%2520
Site%26_k%3Dfd8cd2be3714dc44020a13aaccb55cbc5389aadf%26_p%3DQ7UccLTzSzsd0Gpr0 lL n9I2Caf8%253D%26_t%3D1413226130%7C1413226130%20%2Fs%3Freturning%3D1%26_k
%3Dfd8cd2be3714dc44020a13aaccb55cbc5389aadf%26_p%3DQ7UccLTzSzsd0Gpr0lLn9I2Caf 8%2
53D%26_t%3D1413226130; km_lv=x
Fig. 13. Payload Template with Cookies - Mobile - IOS 7 - Chrome Crios Browser (V.36).
Host:
Connection: keep-alive
Cache-Control: max-age=0
Accept:
Text/html,application/xhtml+xml,application/xml;q=0.9,image/webp,*/*;q=0.8
User-Agent: Mozilla/5.0 (X11; Linux i686) AppleWebKit/537.36 (KHTML, like
Gecko)
Ubuntu Chromium/37.0.2062.120 Chrome/37.0.2062.120 Safari/537.36
Accept-Encoding: gzip,deflate,sdch
Accept-Language: en-US,en;q=0.8
If-Modified-Since: Thu,16 Oct 2014 02:35:55 GMT
Fig. 14. Payload Template without Cookies - PC - Ubuntu OS - Chrome Browser (V.37).
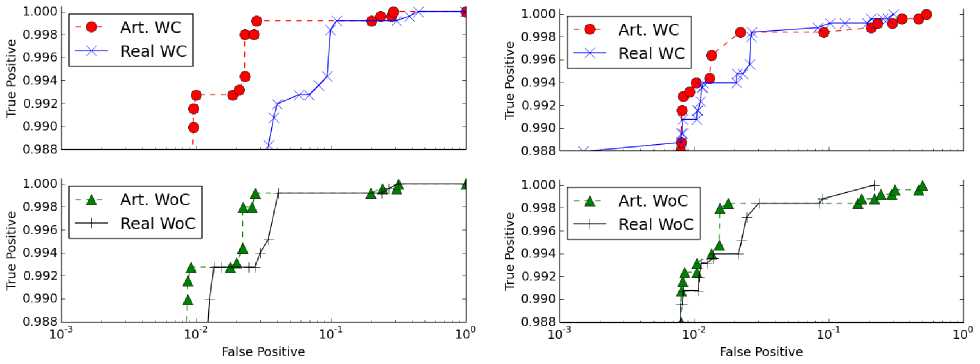
Fig. 15. ROC curves for PAYL (left) and PAYL* (right).


Fig. 16. ROC curves for PBD (left) and PBD* (right).
References Artificially Augmented Training for Anomaly-based Network Intrusion Detection Systems
- Gartner says worldwide information security spending will grow almost 8 percent in 2014 as organizations become more threat-aware. August 22, 2014. [Online]. Available: http://www.gartner.com/newsroom/id/2828722
- S. Kim, W. Edmonds, and N. Nwanze, "On gpu accelerated tuning for a payload anomaly-based network intrusion detection scheme," in ACM Proceedings of the 9th Annual Cyber and Information Security Research Conference, 2014.
- F. M. Cheema, A. Akram, and Z. Iqbal, "Comparative evaluation of header vs. payload based network anomaly detectors," in Proceedings of the World Congress on Engineering, 2009.
- H. S. Javits and A. Valdes, "The nides statistical component: Description and justification," Technical report, SRI International, Computer Science Laboratory, 1993.
- P. K. C. M. Mahoney, "Learning nonstationary models of normal network traffic for detecting novel attacks," Proc. SIGKDD, pp. 376–385, 2002.
- C. Azad and V.K. Jha, "Genetic Algorithm to Solve the Problem of Small Disjunct In the Decision Tree Based Intrusion Detection System," International Journal of Computer Network and Information Security (IJCNIS), vol. 7, no. 8, pp. 56–71, July 2015.
- F. Geramiraz, A. S. Memaripour, and M. Abbaspour, "Adaptive anomaly-based intrusion detection system using fuzzy controller." I. J. Network Security, vol. 14, no. 6, pp. 352–361, 2012.
- P. Mafra, V. Moll, J. da Silva Fraga, and A. Santin, "Octopus-iids: An anomaly based intelligent intrusion detection system," in IEEE Symposium on Computers and Communications, June 2010, pp. 405–410.
- C. Krügel, T. Toth, and E. Kirda, "Service specific anomaly detection for network intrusion detection," in Proceedings of the 2002 ACM Symposium on Applied Computing.
- K. Tomar and S.S. Tyagi, "HTTP Packet Inspection Policy for Improvising Internal Network Security," International Journal of Computer Network and Information Security (IJCNIS), vol. 6, no. 11, pp. 35–42, Oct. 2014.
- M. Almgren and U. Lindqvist, "Application-integrated data collection for security monitoring," Recent Advances in Intrusion Detection, 2001.
- M. Zolotukhin, T. Hamalainen, T. Kokkonen, and J. Siltanen, "Analysis of http requests for anomaly detection of web attacks," IEEE Dependable, Autonomic and Secure Computing (DASC), Aug 2014, pp. 406–411.
- T. Threepak and A. Watcharapupong, "Web attack detection using entropy-based analysis," in Information Networking (ICOIN), 2014 International Conference on, Feb 2014, pp. 244–247.
- C. Kruegel and G. Vigna, "Anomaly detection of web-based attacks," in Proceedings of the 10th ACM Conference on Computer and Communications Security, 2003.
- F. Maggi, W. Robertson, C. Kruegel, and G. Vigna, "Protecting a moving target: Addressing web application concept drift," International Symposium on Recent Advances in Intrusion Detection, 2009.
- M. Tavallaee, N. Stakhanova, and A. Ghorbani, "Toward credible evaluation of anomaly-based intrusion-detection methods," Systems, Man, and Cybernetics, Part C: Applications and Reviews, IEEE Transactions on, vol. 40, no. 5, pp. 516–524, Sept 2010.
- M. Bhuyan, D. Bhattacharyya, and J. Kalita, "Network anomaly detection: Methods, systems and tools," IEEE Communications Surveys Tutorials, vol. 16, no. 1, pp. 303–336, 2014.
- K. Wang and S. J. Stolfo, "Anomalous payload-based network intrusion detection," International Symposium on Recent Advances in Intrusion Detection, 2004.
- S. Kim and N. Nwanze, "Noise-resistant payload anomaly detection for network intrusion detection systems," in IEEE International Performance, Computing and Communications Conference, 2008.
- Browser statistics. [Online]. Available: http://www.w3schools.com/browsers/browsers_stats.asp
- Usage share of web browsers. [Online]. Available: http://en.wikipedia.org/wiki/Usage_share_of_web_browses
- Net market share. [Online]. Available: http://www.netmarketshare.com/
- Search engine spider. June. 12, 2014. [Online]. Available: http://www.webconfs.com/search-engine-spider-simulator.php
- Search engine webmaster. June. 12, 2014. [Online]. Available:http://freetools.webmasterworld.com/tools/crawler-google-sitemap-generator/
