Assault Type Detection in WSN Based on Modified DBSCAN with Osprey Optimization Using Hybrid Classifier LSTM with XGBOOST for Military Sector

Author: R. Preethi
Journal: International Journal of Computer Network and Information Security @ijcnis
Article in issue: 6 vol.17, 2025.
Free access
Military tasks constitute the most important and significant applications of WSNs. In military, Sensor node deployment increases activities, efficient operation, saves loss of life, and protects national sovereignty. Usually, the main difficulties in military missions are energy consumption and security in the network. Another major security issues are hacking or masquerade attack. To overcome the limitations, the proposed method modified DBSCAN with OSPREY optimization Algorithm (OOA) using hybrid classifier Long Short-Term Memory (LSTM) with Extreme Gradient Boosting (XGBOOST) to detect attack types in the WSN military sector for enhancing security. First, nodes are deployed and modified DBSCAN algorithm is used to cluster the nodes to reduce energy consumption. To select the cluster head optimally by using the OSPREY optimization Algorithm (OOA) based on small distance and high energy for transfer data between the base station and nodes. Hybrid LSTM-XGBOOST classifier utilized to learn the parameter and predict the four assault types such as scheduling, flooding, blackhole and grayhole assault. Classification and network metrics including Packet Delivery Ratio (PDR), Throughput, Average Residual Energy (ARE), Packet Loss Ratio (PLR), Accuracy and F1_score are used to evaluate the performance of the model. Performance results show that PDR of 94.12%, 3.2 Mbps throughput at 100 nodes, ARE of 8.94J, PLR of 5.88%, accuracy of 96.14%, and F1_score of 95.04% are achieved. Hence, the designed model for assault prediction types in WSN based on modified DBSCAN clustering with a hybrid classifier yields better results.
Modified DBSCAN, OOA, Hybrid LSTM-XGBOOST, WSN, Military Sector
Short address: https://sciup.org/15020119
IDR: 15020119 | DOI: 10.5815/ijcnis.2025.06.10
Text of the scientific article Assault Type Detection in WSN Based on Modified DBSCAN with Osprey Optimization Using Hybrid Classifier LSTM with XGBOOST for Military Sector
Wireless sensor networks (WSN) uses a collection of sensors deployed in regions where wired connections are unable to be installed to deliver services [1]. The sensor nodes (SN) in this network have the ability to sense their surroundings, process the data, store and aggregate it, and then communicate it with the network's base station and other SNs. The sink node aggregates the data in this process and sends it via the communication medium regarding further usage [2]. The primary drawback of WSN is the limited computational and storage ability in addition to restricted energy. Numerous application domains, including the military, industry, healthcare, remote area monitoring and environmental monitoring, can benefit from the use of WSNs. Sensor networks can assist to avoid destructions or losses in every one of those sectors by quickly and appropriately delivering vital data to the appropriate organization or individual during the correct moment in time [3]. WSN find numerous uses in the military, including tracking military vehicles, enemy intrusion detection, surveillance of border fencing, land mine field surveillance, battlefield damage assessment, and detection of nuclear, chemical and biological (NBC) attacks. WSNs can be used in tactical military applications to lower the mortality rate by securing the data [4]. Additional SN are able to be installed in accordance with the needs of the application because WSNs are scalable in nature [5]. Confidentiality, authentication, integrity, authorization are the most important security criteria for the network. WSN security should secure network communication, prevent resource attacks, and protect against malicious entities or network nodes [6].
Numerous security mechanism, including Public Key Cryptography (PKC) approaches involving ECC and ECDSA, have been established to secure WSN. These methods require additional operands that are processed according to the sensor nodes, resulting in more complex and time-consuming [7]. However, these methods only provide certain levels of security. Furthermore, data exchanged via military networks is extremely important and needs to be kept private since leaking of this data could have a disastrous impact or affect national security. Therefore, the SN involved during interaction must be authenticated [8]. Furthermore, when sensor nodes are placed in unfavourable or insecure environments, they become vulnerable to a variety of security threats, including traffic analysis, spoofing, eavesdropping, Sybil attacks, and Denial of Service (DOS) attacks. Although there are numerous methods for identifying attacks based on AI and machine learning algorithms such as Logistic Regression (LR), Support vector Machine (SVM) and Naive Bayes (NB) have certain disadvantages, such as expense and higher processing times. In order to prevent assaults, lessen casualties, and protect national sovereignty, WSNs in military applications must have a secure and efficient system. Thus, the proposed method has been implemented the designed model based on modified DBSCAN with OSPREY optimization that optimally clusters the nodes and transmit the data efficiently without minimal loss compared to the existing algorithms. Then, by using the hybrid classifier LSTM with XGBOOST is used to predict attack for military sector sensor nodes that avoid different types of assaults in WSN based on the in-depth learning of the network attributes. The following list of significant contributions to the proposed method includes:
• Assault type detection in WSN using hybrid classifier LSTM with XGBOOST for a military sector based on modified DBSCAN with osprey optimization.
• Military sensors are considered as nodes in the network are initially deployed and clustered using modified DBSCAN based on density clustering to minimize the energy usage in WSN.
• Osprey optimization is used to chosen the Cluster Head (CH) on the basis of its distance and higher energy for the transmission of data between CH and the base station (BS).
• Hybrid LSTM with XGBOOST classifier is used to learn the parameter and predict the four types of attack in WSN for security in the military sector.
2. Literature Review
The remaining portions of the article are arranged as follows: Reviewing the literature in sector 2 discusses about security concerns in military WSNs and the various protocols that are currently in place. The proposed approach to anticipate assaults on military WSNs is described in Sector 3. The proposed protocol's performance analysis is covered in Sector 4, along with a comparison of the proposed protocol with existing methods. Sector 5 wraps up with a conclusion.
Many research have discovered and classified attacks in WSN and the security design. Some of these earlier efforts are reviewed in this section using recent procedures.
Salmi and Oughdir [9] introduced a CNN-LSTM network for identified and classified DoS intrusion attacks. The identification of attacks was regarded as a classification task, with the primary goal being to categorize the attack like Black hole, Flooding, Normal, Grayhole or TDMA. A computer-generated dataset from a WSN detection system was used in this investigation. Using the network simulator NS-2, which depends on the LEACH routing protocol, the WSN environment was simulated. Data was collected from the network and preprocessed to create 23 features that categorize the condition of each sensor and mimic five different types of Denial of Service (DoS) assaults.
Hemanand et al. [10] developed an intelligent IDS framework to improve the WSN security using the Likelihood Support Vector Machine (LSVM) models and Cuckoo Search Greedy Optimization (CSGO). The most commonly utilized network datasets, including UNSW-NB15 and NSL-KDD, are taken into account in this model in order to validate it. The first step in normalizing the attributes of the dataset was preprocessed, which involves filtering, missing value prediction, and the elimination of extraneous information. Following pre-process, the ideal quantity of features was chosen and sent into the CSGO algorithm, which determined the ideal fitness function for feature selection. Lastly, the categorized label are normal or abnormal was predicted using an LSVM-based machine learning classification technique. Several performance metrics were used to compared and assessed the security model's performance during the results evaluation process.
Rezvi et al. [11] presented a data mining technique for multiple sorts of classification algorithms to detect four forms of denial of service (DoS) attacks are Grayhole, Flooding, Blackhole and TDMA. Numerous data mining methods, including support vector machines (SVM), ANN algorithms, KNN, Naïve Bayes and Logistic Regression, are used on the dataset to assess how well they predict threats. The analysis showed how these algorithms can be used to identify and anticipated these kinds of threats, and network specialists and analysts may found them useful.
Tan et al [12] established by the synthetic minority oversampling technique (SMOTE) to balance the dataset and train the classifier for intrusion detection uses the random forest algorithm (RFA). The RFA have greater accuracy than other comparable algorithms, based on simulations run on a benchmark incursion dataset. When the minority samples were oversampled, the random forest along with the SMOTE combination yields an accuracy of 92.57%. This demonstrated how the suggested approach enhances intrusion detection performance and offered a workable solution to the class imbalance issue.
Alruhaily and Ibrahims [13] demonstrated a multi-layered architecture for WSN intrusion detection, wherein build a defense-in-depth security approach with the deployment of two tiers of detection. The first layer was situated on the dispersed network edge sensors and makes decisions about the inspected packets in real-time used a Naive Bayes classifier. The second layer was situated in the cloud and conducted a thorough examination of the packets under inspection used a Random Forest multiclass classifier. The outcomes showed that the multi-layer detection model performs well for the Normal, Scheduling, Grayhole, Blackhole attacks and flooding respectively.
The majority of the papers that are reviewed above deal with identifying attacks in WSN. A few of the limitations are listed in the articles under investigation are training takes a lot time [9], interpretive complexity [10], performs poorly and suffers from over-fitting if the training data is too small [11], It takes a long time to train because it combines many decision trees to decide the class [12] and a large amount of power for computation is required [13]. Thus, the proposed model overcomes the above mentioned problem by using the modified DBSCAN with OSPREY optimization using hybrid classifier LSTM with XGBOOST for detecting attacks.
3. Proposed Methodology
One of the most important and significant uses of WSNs is in the military. As usual, one of the biggest challenges in military operations is device security, and another is intrusion or masquerade attack. Therefore, the proposed approach is intended to detect these assaults and improve security by using modified DBSCAN with OSPREY optimization using a hybrid classifier LSTM-XGBOOST.

Modified DBSCAN clustering
CH selection using OSPREY optimization

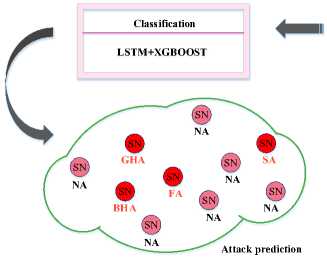
NA- No Attack
GHA – Grayhole attack
BHA – Blackhole Attack
FA – Flooding Attack SA- Scheduling Attack

Data Transmission between BS and CH
Fig.1. Flow diagram of the proposed model
Figure 1 presents the flow architecture of the proposed model. The sensor nodes (SN) used in the military sector involve active sensors, smart sensors, intelligent sensors, camera sensors, Infrared (IR) sensors, micro-electro-mechanical systems (MEMS), Nano-sensors and wearable sensors are taken into consideration in the proposed method for the gathering of data. At first, nodes are deployed and these nodes are clustered by using modified DBSCAN based density clustering for reducing energy usage then the cluster head (CH) is chosen for the data transmission from the BS and CH and vice versa with the help of Osprey optimization based on low distance and high energy. The transmitted data are then classified using hybrid LSTM and XGBOOST classifier for learning the parameter and detecting the types of attack such as Normal, Flooding, Scheduling, Grayhole, and Blackhole attacks, respectively.
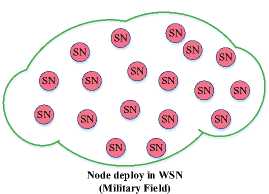
Node deployment
In this article, 100 sensor nodes that are dispersed throughout a 1000 m × 1000 m area in the network are taken into consideration for node deployment. WSNs are networks composed of nodes also referred to as sensors that carry out sensing activities. Data collection regarding vibration, motion, weaponry controls, monitoring enemies, environment monitoring, propulsion and so on is done through the process of sensing. A wireless sensor network incorporates these nodes, which are usually deployed in remote areas and communicate information wirelessly using their wireless radios. Basically, the lifetime of the network is determined by measuring the amount of time that happens between the data transfer to the network's sink and sensing function.
Modified Density-Based Spatial Clustering of Applications with Noise (DBSCAN) Clustering
An unsupervised learning method, clustering divides a set of data demonstrates on various groups or clusters so that the data points in the same clusters have identical attributes and the data points in distinct clusters have different attributes
Density-based clustering, often referred to as unsupervised learning techniques, focuses on classifying distinct clusters in the data so that they may be distinguished from one another by continuous regions of low and high point densities. DBSCAN is a density-based technique that allows for the identification of clusters with varying sizes and forms from a huge amount of noisy and outlier-filled data. [15]. DBSCAN has employed the subsequent two parameters:
MinPts: For a set of data points to be declared dense, a minimum of those points must be grouped together.
Eps (e): The length of time needed to map the locations of all nearby points
^EP s (u} = {vew \d(u,v) < Eps} (1)
Stated alternatively, when the distance from u and v is smaller than Eps, then data point v is positioned in the Eps close by of point u.
In other terms, the data point v is in the Eps neighbourhood of point u if the distance between u and v is less than Eps. Where d(u, v) represents the separation between data points u and v.
Density reachability and density connection are two notions that help to describe these two factors. When a point is within a Eps distance of another, it is considered reachable in terms of density. The transitivity-based chaining strategy is a component of connectivity that determines whether points are located in a specific cluster.
The terms "Core point," "Border point," and "noise point" refer to three different kinds of points in the DBSCAN algorithm.
Core point (Rear}: A point u is referred to be a core point when there are a greater number of points than MinPts in the Eps neighbourhood of that data point.
Border point: Point u is referred to be a border point when the Eps close by of point p contains a minimum of one neighbour that is a core point but less data points overall than MinPts.
Noise point: A point u that falls into either the core or the boundary is referred to as an outlier or noise point.
Osprey optimization
Osprey, often referred to as the fish hawk, sea hawk or, river hawk, is a diurnal, omnivorous bird of prey that lives throughout a vast region [16]. As a piscivorous bird, ospreys eat fish to a large extent (99%). The fish it often catches are alive, 25–35 cm long, and weigh between 150 and 300 g. It can, however, capture any species of fish weighing between 50 g and 2 kg. Ospreys can see well enough to identify items beneath the surface of the water. The osprey tracks the fish underneath when it is flying between 10 and 40 meters over the water's surface. It then advances in the direction of the fish, submerges its feet, and dives to get it. When the osprey gets its meal, it brings it to a nearby rock where it starts to consume it. The clever biological actions of ospreys in hunting and transporting fish to an optimal eating posture can serve as a model for developing novel optimization algorithms.
Start
I
Initialize population
Evaluation of fitness function
Maximize Energy Minimize Distance
No update CH based on the
Conditions for equation by (5), (6) and termination satisfied (7)
Yes
Obtained best solution
I
Stop
Fig.2. Flow diagram of the CH selection using Osprey optimization
Optimization of the proposed model
To select optimal features, the Osprey optimization algorithm (OOA) is used in accordance with the fitness function. Choosing the optimal value involves a number of steps, including initialization, updating, termination, and fitness value evaluation.
Figure 2 shows the flow diagram for determining the best optimal value based on the Osprey optimization.
Step 1: Initialization
Establishing a population's initial state, which includes nodes that can serve as inputs in an optimization method to choose the best node for data transmission.
Z1,Z2,Z3... Z100
F= (Z1;Z2,Z3. Z^o)
Step 2: Fitness Function
Each node's energy and distance from the network are taken into account while choosing the best nodes, and the cluster head (CH) for data transmission is determined by maximizing energy and minimizing distance.
j itness ^ uncnon {
'mini (distance) . maxi (energy)
Step 3: Update
Until the nodes are closer to the occurrence, the optimization algorithm updates the CH continuously. The CH is updated using the formula below until the best CH is chosen. Determine the OOA member’s new location by using the updated equation and the boundary conditions.
^m n ^ Hmn + (kxn + rmn • (uxn — kxn)) / t
n m2n ^ {
H m,n , kx j — H m,n — ux n >
Q2 x n , m,n их HQ2 ux n , m,n
< kxn;
> uxn
Xm ^ {
' xm2,c
m2
Where, based on OOA's second phase, X ^ represents the mth osprey's new location, G ^ represent its objective function value, H ^n denotes its nth dimension, algorithm’s iteration counter is t, random numbers between 0 and 1 are denoted by rmn and T represents the overall iterations. The best CH is chosen using the equation mentioned above.
Step 4: Termination
The optimization method will be stopped after the best CH has been determined. Data is transmitted between CH and BS once the best-chosen CH gathers it from the other nodes.
Hybrid Classifier LSTM-XGBOOST
Hybrid model combines or integrates machine learning (ML) with deep learning (DL) models. Utilizing a combination of methods yields better results than using decision-making models or individual ML alone. Hybrid models can take advantage of the various extension processes of basic models while minimizing their unique constraints.
Figure 3 depicts the architecture of the proposed hybrid classifier. XGBOOST techniques need extracted features to complete the classification tasks, it decided to obtain these features from a robust technique like DL. This model extracted features using a LSTM and then fed these features to one of the ML techniques as XGBOOST. It hybridized LSTM and XGBOOST with one used as learn the parameter and the other for the classification process to detect the types of attack.
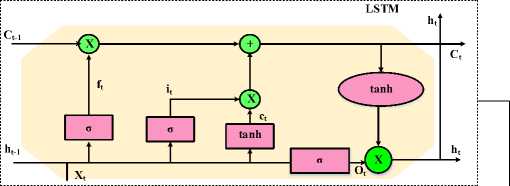
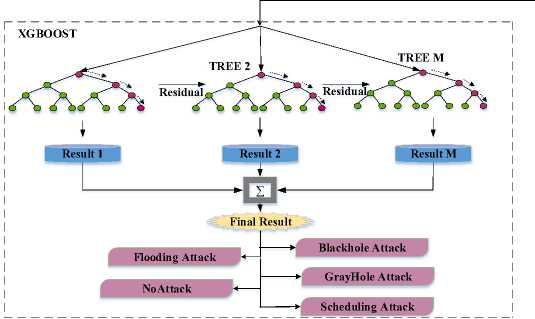
Fig.3. Architecture of hybrid LSTM-XGBOOST classifier
-
A. LSTM
The most frequently employed and efficient network in the upgraded model of recurrent neural networks is Long Short Term Memory (LSTM) [17]. LSTM uses a control gate and memory cell technologies to memorize data. LSTM is capable of long-term data retention in complicated and extensive network elements by establishing the appropriate gate structure and managing the information flow in the network. It carries out the tasks of updating the hidden layer parameters to the new input network and remembers the old information network. The gradient disappearing in the training issue is resolved. Three control gates and a memory unit comprise the basis of the LSTM unit.
To create a black box with state output 0 and input X , an LSTM cell consists of input gates, forgetting gates, and output gates together with a flow of data demonstrating long-term memory. With the help of these two characteristics, LSTM can be trained more successfully, making full use of previous sequence data.
Zt represents the current input, current and previous cell memory information are represented by Ct/Ct-i, Ht/Ht-1 represent the hidden layer's current and previous states. The weight matrices wc, W[ , Wf , w0 connect the incoming data Z and the output signal hidden layer Y, accordingly; a denotes the sigmoid activation function, offset vectors represented as B[, Bc , Bf , B0.
ft = a(Wf.[Ht—i,Zt]+Bf)(8)
it = a(wi.[Ht—i,Zt] + Bi)(9)
Ct = tanh(wc.[Ht—i,Zt]+Bc)(10)
0t = a(Wo. [Ht-i,Zt] + Bo)(12)
To reduce the prediction error, the LSTM network's weights can be adjusted based on the input training data. By changing the weight, important information can be kept in memory because LSTM is a deep neural network and the data it transmits is historical memory in motion. In order to process the time series data, LSTM offers an essential benefit.
-
B. XGBOOST
An extremely scalable end-to-end tree boosting system called Extreme Gradient Boosting (XGBoost) is a machine learning method for classification and regression issues [18]. A collection of M classification and regression trees (CARTs), each with M ^ \j E 1 ...M nodes, is used by XGBoost. The total of each tree's prediction scores determines the final prediction:
Z i = ^(U j ) = X m=1 f M (u j ),fMef
Where the members of the training set are denoted by U i and the corresponding class labels by Z i , F is the set of all M scores for all CARTs and fM is the leaf score for the m th tree. To enhance the final result, regularization is employed:
L(y) = X i l(Z i ,Z i ) + Xmn(f M )
The difference between the target Zi and the forecast made by j is measured by the differentiable loss function, which is represented by the first term, I. Over-fitting is prevented by the second term as complexity in the model is penalized byfl:
^(f)=yT + 1 AXk i W i 2
The weight of each leaf is represented by w, the number of leaves in the tree is represented by T, and the constants у and A control the regularization degree. Regression and classification issues benefit from the use of gradient boosting (GB). The following simplified objective was obtained at step t by using GB in conjunction with the loss function that was expanded by the 2nd-order Taylor expansion and the constant term eliminated:
L(t) - Е П=1 [G j f j (u j ) ■ Hf (u )\ + fl(ft) (17)
L(t) = ? } =1 [G i f i (u i ) + ^H, f 2 (u)] +yT + l AT^ i W2 = E к > [(YjeIkG № + 2 (YjeIkH i + A)W 2 ] + yT Where the instance set of leaf t represented as Ik = {_)'\ц(ц ) = k}, and д^-%) i d2 j(t-1
d 2^-1^ J д^ -)
The loss function's gradient statistics at first and second order. For a given tree structure s(U j ), it can be possible to compute the optimal weight Wk of leaf k and the quality of the tree structure s:
W ^
( T i^‘k G i )
Vt) (s)-=-^^^
When split candidates are evaluated in practice using the scores in the instance sets of the right IRT and left ILF nodes following the split (I — ILF U IRT), the loss reduction following the split is as follows:
1 1eILFG 1 } № RT G (^ jEl G j k
SPLIT 2 [(^^H (^/rthH У ( }
Finally, the attack types such as garyhole attack, blackhole attack, flooding attack, scheduling attack and no-attack are predicted as output based on its attributes by using a hybrid classifier as LSTM-XGBOOST.
Algorithm : Pseudocode for detecting attack types using Modified DBSCAN clustering with hybrid LSTM-XGBOOST classifier
-
# Node deployment
m— m(1),m(2),m(3) ....m(k)
Sn = Node deployment (m)
-
# Clustering and CH selection
CHS =MDO(5n) // Nodes clustering and select CH using modified DBSCAN technique with osprey optimization by equation (1) to equation (7)
datatxm = Data gathered from nodes
BS= datatxm (CHS) // transmission of data between CH and BS
#Classification
A = LSTM-XGBOOST (BS) // detecting assault by hybrid LSTM and XGBOOST classifier using the equation (8)-(24)
If (A=1)
class 1=No attack
Else if (A=2)
class 2= Grayhole attack
Else (A=3)
class 3= Blackhole attack
Else if class 4= flooding attack
Else (A=5)
class 5= Scheduling attack
Output: prediction of assault types in WSN
4. Results and Discussions
To predict the types of assault, the proposed method implemented by using MDBSCAN clustering with Osprey optimization and hybrid LSTM-XGBOOST classifier in WSN. The designed model is assessed employing the matlabR2021b software, which requires the following hardware to function: an NVIDIA GeForce RTX 3070 GPU, an Intel Core i7 CPU, and an operating system that supports 64 bits. Nodes are first setup and then CH is selected based on modified DBSCAN with osprey optimization to select the CH node optimally to send information to the BS or sink node. Afterwards, attack types are detected using a hybrid classifier using LSTM with XGBOOST to identify the attack.
Dataset Description
The NSL-KDD data set is analysed and categorized into four different clusters depicting the four common different types of attacks. An in depth analytical study is made on the test and training data set [19]. Here the 20% train and test data set. The parameters considered for training the classifier are duration, protocol_type, service, flag, src_bytes, dst_bytes, land, wrong_fragment, urgent and hot. This paper uses the NSL-KDD data set to reveal the most vulnerable protocol that is frequently used intruders to launch network based intrusions.
Table 1. Parameters for simulation in the proposed technique
|
Parameter |
Range |
|
Number of WSN Nodes |
100 |
|
Region of Network |
1000mx1000m |
|
size of Packet |
512 bytes |
|
Initial Energy (Mega Joule) |
2.6 J |
|
Total cluster |
5 |
|
Range of transmission |
250m |
The proposed method simulation parameters are provided in Table 1. Parameters for simulation are the total node in WSN are 100 nodes, network region, packet size, initial energy, clustering node and selected clusters Head as 5 and transmission range are defined.
The deployment of nodes and process of clustering utilizing the modified DBSCAN technique are displayed in Figure 4 and Figure 5. A 1000 x 1000 m area has 100 nodes deployed for the task of evaluating the data transmission. The WSN nodes are clustered according to their density using the modified DBSCAN algorithm, which is utilized to cluster the deployed nodes optimally by Osprey optimization in the square region. The deployed nodes are grouped into five separate clusters using the modified DBSCAN algorithm.
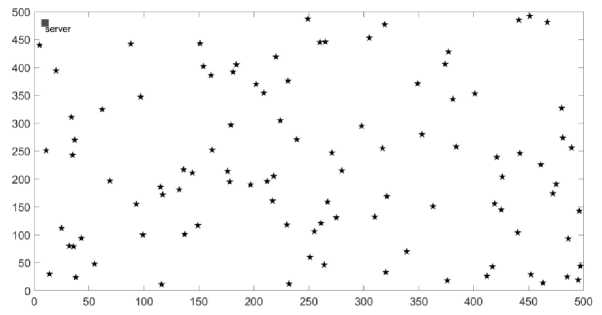
Fig.4. Node configuration in 1000 x 1000 m region
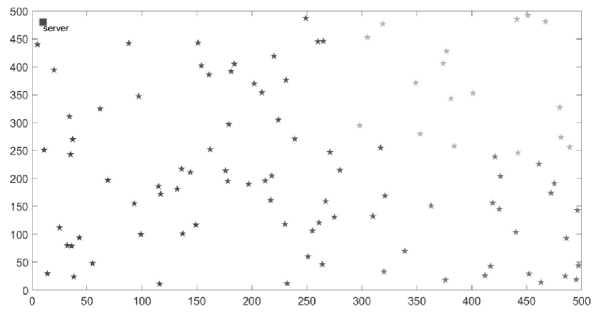
Fig.5. Node clustering using modified DBSCAN algorithm
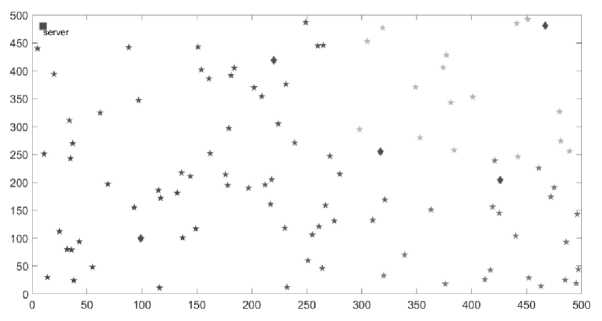
Fig.6. Select cluster head using modified DBSCAN with OOA
Cluster head selection using modified DBSCAN with OOA is depicted in Figure 6. The head of the cluster is selected using the least amount of distance and maximum amount of energy. Regarding improved energy-efficiency of communication, the information obtained from the cluster head (CH) is communicated to the BS.
Metrics of network performance
Performance metrics are evaluated for the proposed modified DBSCAN with OOA (MDO) method and existing models such as Balanced Iterative Reducing and Clustering using Hierarchies (BIRCH), Density-based Clustering (DENCLUE) and Robust Clustering using links (ROCK). The proposed model implementations are contrasted with the existing approaches in order to assess the network performance metrics involving Packet Loss Ratio (PLR), delay, throughput, Average Residual Energy (ARE), and Packet Delivery Ratio (PDR).
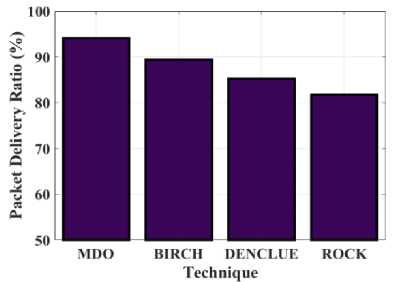
Fig.7. Examination of Packet Delivery Ratio (PDR) for the proposed MDO and existing techniques
MDO BIRCH DENCLUE ROCK
Technique
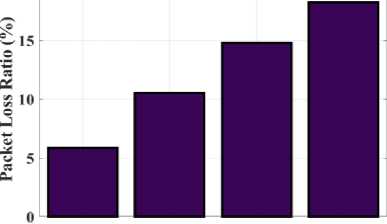
Fig.8. Examination of Packet Loss Ratio (PLR) for the proposed MDO and existing techniques
Technique
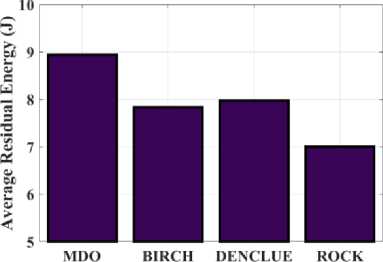
Fig.9. Examination of Average Residual Energy (ARE) for the proposed MDO and existing techniques
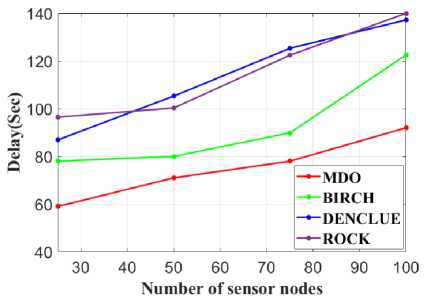
Fig.10. Examination of delay for the proposed MDO and existing techniques
Figure 7 exhibits the PDR determination of the proposed MDO algorithm and the existing models, BIRCH, DENCLUE, and ROCK. The Packet Delivery Ratio (PDR) calculates the proportion of packets generated to received packets. The relationship between PDR and PLR is inverse and also reduced packet loss is the result of a greater PDR. The value measured using the proposed MDO approach is 94.12%, while the values produced by the existing methods including BIRCH, DENCLUE, and ROCK are 89.45%, 85.2%, and 81.79%. Consequently, compared to the other approaches, the PDR value produced by the proposed approach is higher. The proposed MDO approach outperforms existing approaches in terms of data transmission efficiency. An analysis of the packet loss ratio (PLR) for the existing model and the proposed MDO is presented in Figure 8. Performance can be greatly impacted by PLR, a metric that counts the number of data packets lost during communication. The results for the BIRCH, DENCLUE, and ROCK techniques are 10.55%, 14.88%, and 18.21%, respectively, yet the proposed MDO strategy yields a result of 5.88%. MDO has a lower packet loss rate than the other models.
Figure 9 presents the examinations of the Average Residual Energy (ARE) for each of the existing models such as BIRCH, DENCLUE, and ROCK and the proposed MDO. The amount of energy left in the sensor node can be calculated by including the energy used during each circumstance. A value of 8.94 J is obtained via the proposed MDO methodology, while values of 7.84 J, 7.98 J, and 7 J are obtained from the BIRCH, DENCLUE, and ROCK methods, respectively. As a result, the proposed method produced a higher ARE value than the previous approaches. The proposed MDO technique and other models, such as BIRCH, DENCLUE, and ROCK, are compared in terms of delay in Figure 10. The delay, measured in milliseconds, is a measure of the network's efficiency and even if the causes of delays have a significant influence on system functionality. The time a packet takes to move from the source to its destination in a communication network is referred to as its delay. The MDO approach yields the following values for delay: 59ms for 25 nodes, 71ms for 50 nodes, 78ms for 75 nodes, and 92ms for 100 nodes. The delay that occurs by applying BIRCH is 78ms for 25 nodes, 80ms for 50 nodes, 89.89ms for 75 nodes, and 122.56ms for 100 nodes. When DENCLUE is used, there is a delay of 86.9ms for 25 nodes, 105.3ms for 50 nodes, 125.34ms for 75 nodes, and 137.23ms for 100 nodes. ROCK has a delay of 96.45ms at 25 nodes, 100.31ms at 50 nodes, 122.45ms at 75 nodes, and 140ms at 100 nodes. It is clear from the graphical representation that the delay recorded in MDO is less than that of the other methods.
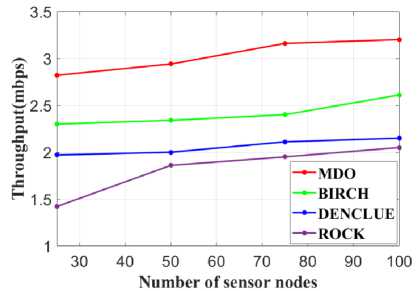
Fig.11. Examination of throughput (mbps) for the proposed MDO and existing techniques
A throughput analysis of the proposed MDO and other methods, including BIRCH, DENCLUE, and ROCK, is illustrated in Figure 11. Network throughput, which is often measured in megabits per second (mbps), is the total quantity of data which can be transmitted successfully through a network in a certain period of time. The average speed of information bits reaching their intended locations is measured by throughput. MDO achieves a value of 25 nodes at a throughput of 2.82, 50 nodes at 2.94, 75 nodes at 3.16, and 100 nodes at 3.2. Likewise, for 25, 50, 75, and 100 nodes, respectively, BIRCH obtains throughput rates of 2.3, 2.34, 2.4, and 2.61. DENCLUE attains a throughput of 1.97 for 25 nodes, 2 for 50 nodes, 2.11 for 75 nodes, and 2.15 for 100 nodes. For 25, 50, 75, and 100 nodes, the estimated ROCK throughput is 1.42, 1.86, 1.95, and 2.05, in that order. In terms of throughput, the graph demonstrates that MDO outperforms other approaches.
Metrics of Classification Performance
Confusion performance indicators for the proposed method is provided in Figure 12. Using this confusion metric, the actual and anticipated data for the provided dataset are evaluated. Class 1, 2, 3, 4, and 5 are different attack types predicted to have 11020, 7350, 1520, 680, and 1001 projected data, correspondingly. An overall of 22545 data samples were employed in the testing process; 21571 of those were successfully predicted, while the remaining 873 were not.
The proposed model's ROC analysis curve is represented in Figure 13. An illustration of a categorization model's efficiency is known as a ROC curve, or receiver operating characteristic curve. The relationship between the percentage of true and false positives rate is described by ROC curves if the prediction model is applied with different probability thresholds. Evaluating the proposed LSTM-XGB approach against existing methods namely Logistic regression (LR), Random Forest (RF) and Naive Bayes (NB) involves comparing performance metrics such as accuracy, FPR, F1-score, precision, error, specificity, sensitivity and FNR.
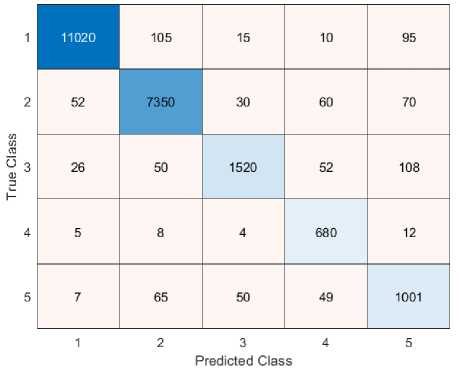
Fig.12. Confusion performance indicators for the proposed method
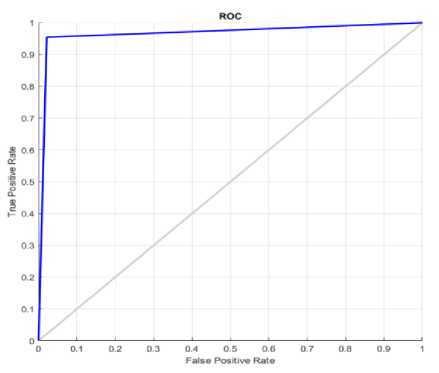
Fig.13. Proposed method ROC plot
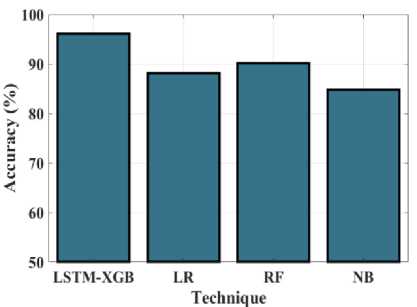
Fig.14. Accuracy (%) measurements for the proposed LSTM-XGB and existing techniques
The graph demonstrated in Figure 14 evaluates the accuracy of the proposed hybrid LSTM-XGB approach to that of other approaches. Accuracy is the percentage of correctly classified participants in the assessment dataset. By contrasting it with existing methods BIRCH, DENCLUE, and ROCK, the accuracy of the proposed approach hybrid LSTM-XGB is examined. The corresponding values for hybrid LSTM-XGB, LR, RF and NB are 96.14%, 88.17%, 90.2%, and 84.79%. The proposed approach is highly accurate as well as effective at predicting the assault types in WSN than previous approaches. The specificity of the hybrid LSTM-XGB technique is compared to the outcomes of existing methods in the graph seen in Figure 15. It is vital to compare the proposed hybrid LSTM-XGB model to existing approaches, like BIRCH, DENCLUE, and ROCK, in order to evaluate specificity. For hybrid LSTM-XGB, LR, RF and NB, the final scores are 91.92%, 89.34%, 85%, and 96.72%, accordingly. When contrasted with all of the previous methods, the specificity value of the proposed approach gets higher as a result.
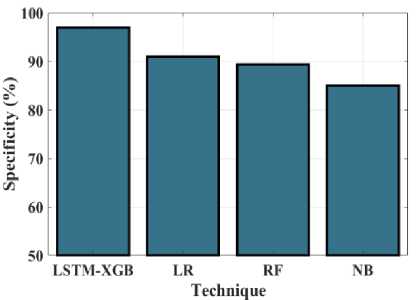
Fig.15. Specificity (%) measurements for the LSTM-XGB and existing techniques
Technique
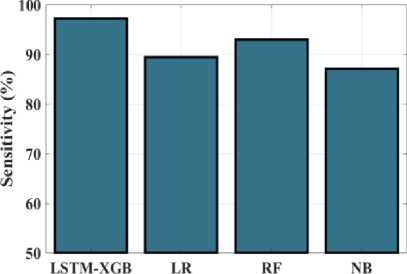
Fig.16. Sensitivity (%) measurements for the LSTM-XGB and existing techniques
Technique
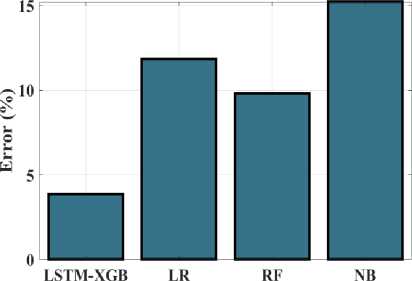
Fig.17. Error (%) measurements for the LSTM-XGB and existing techniques
Figure 16 graph presents the findings and contrasts the proposed MDO strategy's sensitivity with that of other methods. Hybrid LSTM-XGB, LR, RF and NB all achieved sensitivity values of 97.23%, 89.45%, 93%, and 87.12%, respectively. Hence, compared to the previously used methodologies, the proposed approach's sensitivity value is larger. The graph depicted in Figure 17 examines the error outcomes obtained from the proposed Hybrid LSTM-XGB approach and existing strategy. The respective values for Hybrid LSTM-XGB, LR, RF and NB are 3.86%, 11.83%, 9.8%, and 15.21%. Contrasted with previous methods, the accuracy of the proposed framework is lower.
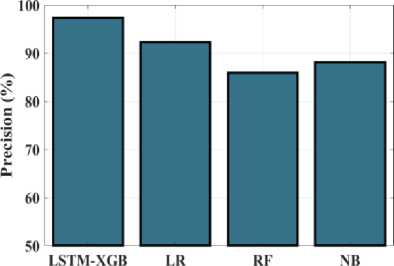
Evaluation of the proposed Hybrid LSTM-XGB precision when compared to several existing techniques is demonstrated in Figure 18. The proposed Hybrid LSTM-XGB compares to existing techniques namely Hybrid LSTM-XGB, LR, RF and NB. The precision values determined using Hybrid LSTM-XGB, LR, RF and NB are 97.34%, 92.24%, 85.89%, and 88.1%, respectively. As a result, the precision value of the proposed approach is greater than that of existing methods. The proposed Hybrid LSTM-XGB strategy FPR has been compared to the existing approaches in the graph presented in Figure 19. The FPR values of Hybrid LSTM-XGB, LR, RF and NB respectively, are 3.08%, 9%, 10.66%, and 15%. The proposed approach has lower FPR values as compared to other conventional methods.
Technique
Fig.18. Precision (%) measurements for the LSTM-XGB and existing techniques
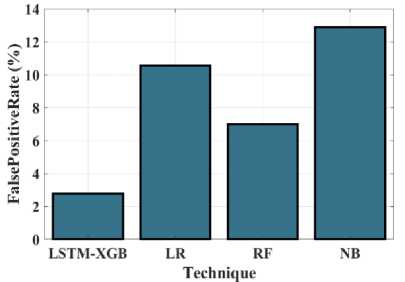
Fig.19. FPR (%) measurements for the LSTM-XGB and existing techniques.
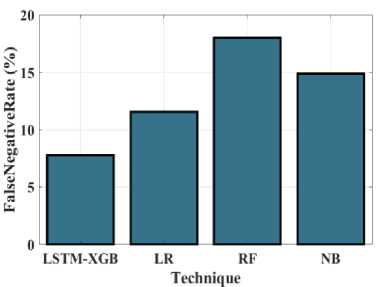
Fig.20. FNR (%) measurements for the LSTM-XGB and existing technique
Technique
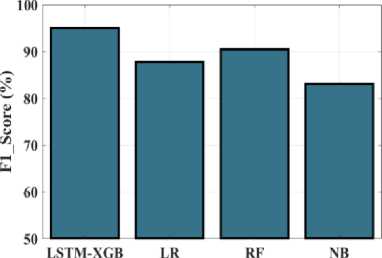
Fig.21. F1_Score (%) measurements for the LSTM-XGB and existing techniques
Figure 20 examines the proposed MDO method using existing employed methodologies in relation to FNR values. For Hybrid LSTM-XGB, LR, RF and NB, the corresponding FNR rates are 2.77%, 10.55%, 7%, and 12.88%. This finding demonstrates that the FNR value of the proposed approach is lower than that of the existing model. The proposed Hybrid LSTM-XGB method is contrasted with other methods by the F1_score in Figure 21. The proposed Hybrid LSTM-
XGB method is contrasted with methods that are currently in use, such as Hybrid LSTM-XGB, LR, RF and NB. F1_scores obtained for the previously used approaches namely LR, RF and NB are 87.7%, 90.43%, and 83.1% and the proposed Hybrid LSTM-XGB methodology attained as 95.04%, respectively. The proposed strategy has a higher F1_score rate than the existing approaches. According to the performance indicators given above, the proposed method does perform well in terms of effectively recognizing the assault types.
5. Conclusions
Military applications for WSN include monitoring attackers and defend forces, as well as monitoring terrorist activity. A collection of dispersed, network-connected sensor nodes comprise a WSN, which have a high power consumption, inexpensive, and a restricted computational ability. However, WSN are susceptible to a number of assaults that can lead to wireless congestion and network overload wasting limited resources on the network like bandwidth and energy, which negatively impacts the accessibility and authenticity of data. In order to get over the obstacles, the proposed method designed a model to enhance security by modified DBSCAN with OSPREY optimization using hybrid classifier LSTM-XGBOOST to predict the types of attack. Nodes get initially deployed and modified DBSCAN served to group the nodes in order to minimize the use of energy, and Osprey optimization is used to choose the cluster head optimal that would carry data to the base station and nodes at least distance and with the maximum amount of energy. The four attack types are predicted and the parameters are learned using a hybrid LSTM-XGBOOST classifier. Proposed LSTM-XGBOOST and existing methods, namely LR, RF, and NB, are compared with classification parameters like accuracy, error, specificity, F1_score, FNR, precision, sensitivity and FPR to predict the types of assault. Likewise, the network Performance for the proposed model is measured by network parameters, such as PDR, PLR, throughput, ARE and delay are examined for proposed MDO and existing techniques, like BIRCH, DENCLUE, and ROCK for WSN. The results of this experiment attained for the performance of networks got value for 94.12% of PDR, 8.94J for ARE, 5.88% PLR, 100 nodes have a throughput of 3.2 Mbps and a delay of 92 seconds and the classification parameters evaluated values are 96.14% accuracy, F1_score 95.04%, 96.92% specificity, Error rate of 3.86%, sensitivity of 97.23%, FNR has a 2.77% rate, 97.34% precision and FPR 3.08%, of the proposed method. It proves the proposed method is more efficient than existing approaches. The performance of the proposed model is better for the attack detection due to the combination of the LSTM and XGBoost, which extracts and learns the more depth information from the dataset and then the XGBoost algorithm that classifies the data more fast and efficient to detect the attack type accurately. The major drawbacks that are attained by the existing model to the attack type are fails to predict continuous outcome, sma ll sample size tends to become inaccurate, computational complexity, zero-frequency problem. These issues are solved by using the hybrid trained LSTM-XGBoost model. In future updates, the data in the network can be secretly encrypt and authenticate to provide a higher level of security using advanced technology.
