Assessing air pollution tolerance: a study of roadside plants

Author: Anumol J., Chitra A., Reshmi G.R.
Journal: Журнал стресс-физиологии и биохимии @jspb
Article in issue: 2 т.21, 2025.
Free access
Urban air pollution has significant impacts on plant life, affecting their growth, development, and overall health. Understanding plant responses to pollution is crucial for environmental monitoring and mitigation efforts. In this study, plants were collected from both polluted and non-polluted areas using the Quadrant method. Four plant species- Alternanthera sessilis , Mimosa pudica , Boerhaavia diffusa , and Sida acuta -were selected to assess their pollution tolerance. Key parameters such as ascorbic acid content, relative water content, leaf extract pH, and total chlorophyll content were analyzed separately for each plant. Ascorbic acid content was determined by the Colorimetric method, total chlorophyll content was measured using Spectrophotometry, leaf extract pH was calculated with a pH meter, and relative water content was assessed using initial, turgid, and dry weights. These parameters were used to calculate the Air Pollution Tolerance Index (APTI) value. The results revealed that the dominance pattern of plants along NH 47 was consistent with APTI value determinations. Alternanthera sessilis and Boerhaavia diffusa exhibited higher APTI values and were the most dominant species in the polluted areas, whereas Mimosa pudica and Sida acuta showed lower APTI values and were less dominant. The study demonstrated that ascorbic acid content, leaf extract pH, total chlorophyll content, and relative water content are crucial parameters for determining plant tolerance to air pollution. Furthermore, it suggested that plants in polluted areas adapt to environmental changes by altering their physical and biochemical characteristics. Future molecular and gene expression studies could provide deeper insights into these adaptive mechanisms. Identifying tolerant plant species through APTI values is significant for employing these species in air pollution control and mitigation efforts.
Apti value, tolerance, vehicular emission
Short address: https://sciup.org/143184712
IDR: 143184712
Text of the scientific article Assessing air pollution tolerance: a study of roadside plants
According to Odum (1983), “Pollution is an undesirable change in physical, chemical and biological characteristics of air, water and soil that may harmfully affect the life or a potential hazard of any living organisms”. Any agent or substance that causes pollution is called pollutant. On the basis of the type of environment being polluted, it can be classified in to air pollution, water pollution, and soil pollution. On the basis of kinds of pollutant, air pollution is classified in to Sulphur dioxide pollution, carbon monoxide pollution, etc.
Today main threat to environment is caused by air pollution. Air pollution is a major problem arising mainly from industrialization (Odilara et al., 2006). Air pollution is the introduction of chemicals, particulate matter, or biological materials that cause harm or discomfort to humans or living organisms, or causes damage to natural environment. Air pollution is caused due to industrialized expansion of cities, increased traffic, rapid economic development, higher level of energy consumption. The high influx of population to urban areas, increase in consumption patterns and unplanned urban and industrial development has led to the problem of air pollution. This will result in ozone depletion, acid rain, greenhouse effect, global warming and later leads to environment degradation. This will equally effect life of plants and animals and cause health hazards like asthma, lung cancer, nausea, heart palpitation, hypoxia, and headache and eye irritation. Generally, the air we breathe is composed of molecular oxygen, nitrogen with about 1% constituted by other constituents such as carbon dioxide, water vapor, and air pollutant if present. Even when the pollutants are present in small concentration, they may be extremely harmful to life and property.
Currently, in India, air pollution is widespread in urban areas where vehicles are the major contributors and in a few other areas with a high concentration of industries and thermal power plants. Vehicular emissions are of particular concern since these are ground level sources and thus have the maximum impact on the general population. Also, vehicles contribute significantly to the total air pollution load in many ways. The number of motor vehicles has increased from 0.3 million in 1951 to 37.2 million in 1997 (MoST, 2000). Out of these, 32% are concentrated in 23 metropolitan cities. Delhi itself accounts for about 8% of the total registered vehicles and has more registered vehicles than those in the other three metros (Mumbai, Calcutta, and Chennai) taken together. In India, millions of people breathe air with high concentrations of dreaded pollutants. The air is highly polluted in terms of suspended particulate matter in most cities. This has led to a greater incidence of associated health effects on the population manifested in the form of sub-clinical effects, impaired pulmonary functions, and use of medication, reduced physical performance, frequent medical consultations and hospital admissions with complicated morbidity and even death in the exposed population. The ever-increasing vehicular traffic density posed continued threat to air quality (Sharma, 2007). The combustion of fuel in engines of motor gives rise to Sulphur dioxide, nitrogen oxide, CO as well as suspended particulate matter (Singh et al. , 1985; Tripathi & Gautham, 2007).
Quality of air can be measured by air quality monitoring techniques that are designed to measure all type of contaminants natural as well as manmade. There are mainly three methods of air quality monitoring that are, measurements of emissions, meteorological measurement, ambient air quality and biological methods. In biological methods, microbes, plants, animals, cell organelles, organ, individual population, biotic community, ecosystems show different levels of sensitivity and can be successfully employed as ecological indicators. Among these indicators plant species which are more sensitive to act as biological indicators of air pollution (Escobedo et al., 2008). Plants are an integral basis for all ecosystems and also most likely to be affected by airborne pollution which are identified as the organisms with most potential to receive impacts from ambient air pollution. Also, the effects are most often apparent on the leaves which are usually the most abundant and most obvious primary receptors of large number of air pollutants. It is a common observation that none of the plant has been found to be uniformly distributed around the globe; similarly, no particular region in the world has been reported to lodge all the plant of the plant kingdom. This disparity of plant distribution depends on interaction of a plant with its surrounding (Kumar and Soodan, 2006). It Interaction and establishment of plants in any area also depends upon the sensitivity or resistance of plants to air pollutants (Tripathi and Dwivedi, 2002). Biomonitoring of plants is an important tool to evaluate the impact of air pollution. Hence in the latest years urban vegetation became increasingly important not only for social reasons but mostly for affecting local and regional air quality. The use of plants as monitors of air pollution has been established as plants are the initial acceptors of air pollution. They act as the scavengers for many airborne particles in the atmosphere. Plants exposed to air pollution for long duration, they experience physiological changes before exhibiting visible damages to leaves (Dohmen et al., 1990).
The present work was done to study the sensitivity or resistance of plants based on the selected parameters such as ascorbic acid content (Falla et al., 2000), chlorophyll content (Bell and Mudd, 1976), leaf extract pH (Chaudhary & Rao, 1997), and relative water content (Dedio, 1975). As only one particular character recognizing sensitivity or resistance of a plant is not justifiable. Singh & Rao (1983) suggested a method of determining Air Pollution Tolerance Index (APTI) by combining the four parameters Ascorbic acid, Total chlorophyll content, Leaf extracts pH and Relative water content. Air pollution tolerance index has also been used to rank plant species in their order tolerance to air pollution (Raza & Murthy, 1988; Singh & Rao, 1983). The usefulness of evaluating APTI for the determination of tolerance as well as sensitiveness of plant species was followed by several authors (Agarwal & Tiwari, 1977;
This work is carried out with a view to find out the tolerance as well as sensitivity of common plants species subjected to vehicular pollution. Air pollution tolerance index is used by landscapers to select plant species tolerance to air pollution (Agbaire, 2009). Using plants, as indicator of air pollution is the possibility of synergistic action of pollutants (Lakshmi et al., 2009). These studies provided valuable information for landscapers and greenbelt designers to select the sensitive as well as tolerant varieties of plant species. The result of these studies showed that the plants with higher APTI values were found to be resistant to air pollution. In this present work, plants were collected from both polluted as well as non-polluted areas. This was done by Quadrant method. From this; four plants were selected to study pollution tolerance. The plants were Alternanthera sessilis, Mimosa pudica, Boerhaavia diffusa, Sida acuta, Peltoohorum pterocarpum, Ficus religiosa, Ficus benghalensis, Swietenia macrophylla and Gliricidia septum. Parameters like Ascorbic acid content, relative water content, pH of leaf extract, total chlorophyll content were studied separately of each plant. Ascorbic acid content was determined by Colorimetric method. Total chlorophyll content was determined using Spectrophotometry. Leaf extract pH was calculated using pH meter. Relative water content was calculated by using initial weight, turgid weight, and dry weight. Using all these four parameters APTI value was calculated.
MATERIALS AND METHODS
Study area
For this study the plant specimens were collected from two ecologically different areas, one from a polluted area (ES) and other from a control area (CS). The polluted site extends from Paravoor Junction to Seminaripady of Aluva, Kerala along the sides of NH-45
which is on the latitude 10.124338, 76.339695. These polluted areas were hyper disturbed areas of the highway due to vehicular pollution. The area selected as non-polluted was Union Christian College campus. The controlled area was comparatively less polluted. The plants were collected by quadrat method.
Sample collection and laboratory analysis
Biochemical study
Estimation of Ascorbic Acid Content (mg/g)
Preparation of standard solution:
1gm of ascorbic acid was made up to 100ml. from this 1ml pipette out and made up to 100ml. This becomes 0.01%. Correspondingly 2, 3… 8 was pipette out and made in to corresponding concentrations. 1ml bromine water, 1ml DNPH, 2ml thiourea was added to each test tube and were incubated for 3 hours at 37°C.
After this 7ml 85% H2SO4 added. Then optical density was measured at 520nm. From this value standard Figure were prepared.
For the estimation, 5gm fresh mature leaves were homogenized with 10ml 4% Oxalic acid and filtrate the homogenate by using Waterman’s No:1 filter paper and collected the extract and make up 50 ml by adding 4% Oxalic acid. This 50 ml solution is considered as stock solution. From this stock solution 1 ml is again diluted with 10 ml of 4% Oxalic acid. From this working standard different amount of sample solutions was pipette out in to test tubes in a series, .02, .04, .06,…. and add same amounts of bromine water for brominating the sample. Then add 1 ml 2-4 Dinitrophenyl Hydrazine reagent and is followed by adding two drops of 10% Thiourea solution. Then these test samples were incubated for 3 hours at 37°C. After the incubation period, an orange red crystal named as Osazone were formed in the sample. These Osazone crystals were dissolved by adding 7 ml 85% H 2 SO 4 . Then measure the optical density of test samples at 540 nm. These readings were plotted in the standard ascorbic acid Graph. Thus, from the standard Graph the amount of ascorbic acid of different plants were calculated.
Estimation of Total Chlorophyll (mg/g)
Estimation of total chlorophyll was carried out according to the method described by Arnone (1949). In this method 5gm of fresh mature leaves were blended by using Pestle and Mortar and extracted with 10ml 85% Acetone. The extract is decanted into centrifuge tube and centrifuged at 2,500 rpm for 3 minutes. The supernatant was collected and measured the absorbance at 640 nm and 610 nm in colorimeter.
Total chlorophyll content of the plant was calculated by the following formula
Chlorophyll a = 13.71 x Ab 610 – 2.85 x Ab 640 Chlorophyll b = 22.39 x Ab 640 – 3.42x Ab 610 Total chlorophyll content = chlorophyll a + chlorophyll b Analysis of pH of Leaf Extract
-
• According to the protocol of Agbaire (2009) the leaf extract pH was measured. In this method the 5gm of fresh mature leaf was homogenized with 10ml distilled water. This was then filtered
Relative Water Content (%)
RWC of plant samples were calculated by the formula,
Relative Water Content = (FW-DW/TW-DW) X 100
FW = Fresh Weight
TW = Turgid Weight
DW = Dry Weight
3.5 Determination of Air Pollution Tolerance Index (APTI)
APTI = (A (T+P) +R)/100
A = Ascorbic acid content (mg/g)
T = Total chlorophyll content (mg/g)
P = pH of leaf extract
R = Relative water content
The APTI results are further classified as sensitive (1–11), intermediate tolerant (12–16), and tolerant (≥ 17) to assess the vulnerability and resistance of various plant species to air pollution (Agbaire and Esiefarienrhe, 2009; Ogunkunle et al ., 2015).
RESULTS
Dominance pattern of plants present on the sides of NH-47 was find out by quadrat study. The most dominant plants were Alternanthera sessilis and Boerhaavia diffusa .
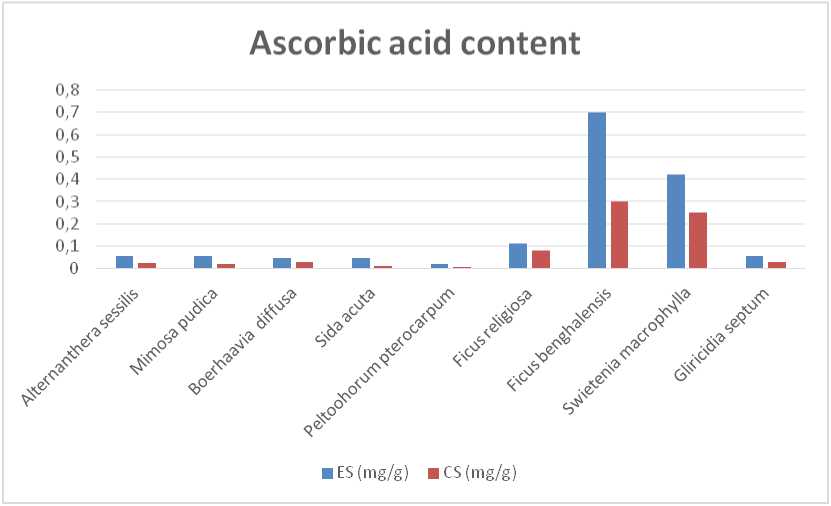
Ascorbic acid content
In plants collected from polluted sites, ascorbic acid content ranged from 0.11 to 0.02, while in control site plants, it varied from 0.3 to 0.01, showing a notable decrease in ascorbic acid levels in plants exposed to polluted environments (Table 2 and Figure 3).
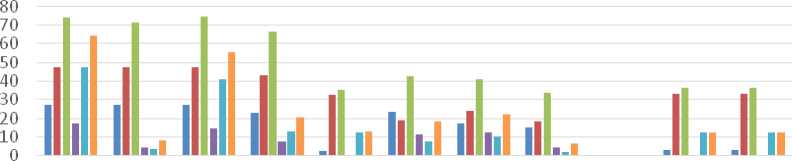
Estimation of chlorophyll content
Plants collected from experimental site contain high amount of chlorophyll compared to control site. The total chlorophyll content varied from 33.51 to 74.57in plants collected from polluted site and 6.30 to 64.27 plants collected from control site (Table 3 and Figure 4).
pH of the plant extract
There was a slight increase in pH of plants collected from experiment site compared to plants from control sites. Ficus benghalensis exhibited high difference in pH between two sites . Alternanthera sessilis exhibited minute difference between two sites (Table 4 & Figure 5).
Relative Water Content
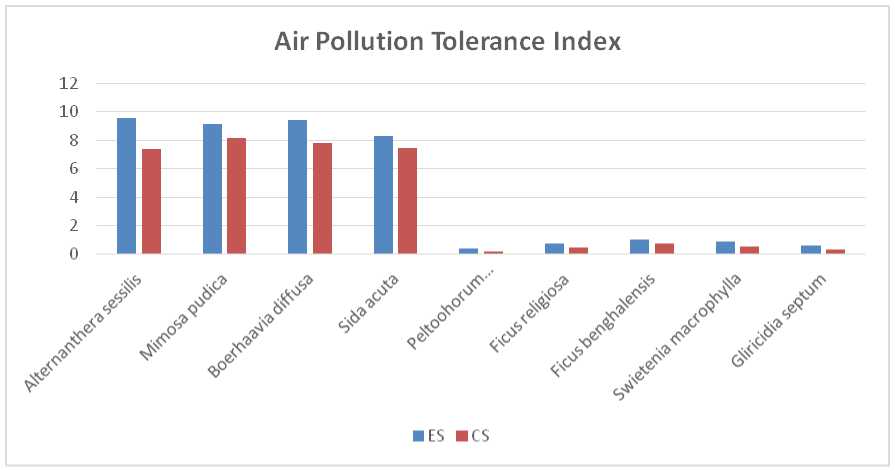
Determination of Air Pollution Tolerance Index
DISCUSSION
Vehicular pollution is one of the major threats to our environment. The roadside plants are highly exposed to vehicular pollution. They act as the scavenger of airborne pollution, so they act as biological agents of pollution monitoring. Pollutants get accumulated in plants and plants act as both accumulators and indicators of pollution. By having certain biochemical and physiological adaptations, plants become either tolerant or sensitive to pollution.
Evaluating the tolerance of plants to air pollutants provides a reliable assessment of their potential to mitigate air pollution and improve local air quality. Understanding the response of plants to varying climatic conditions can help address both local and regional air pollution problems. Environmental factors influence the biochemical processes in plants, and assessing these biochemical parameters can yield valuable insights into their air pollution tolerance. The results of the Relative Water Content (RWC) studies demonstrate that pollution distinctly affects pH levels among different plant species, with some becoming more alkaline and others showing minimal or no change (Puckett et al., 1973). RWC is crucial to various plant processes, including growth, respiration, transpiration, and metabolic activities (Rai and Panda, 2014). These activities encompass photosynthesis, cell permeability, and enzymatic reactions, as noted by Bandara and Dissanayake (2021).
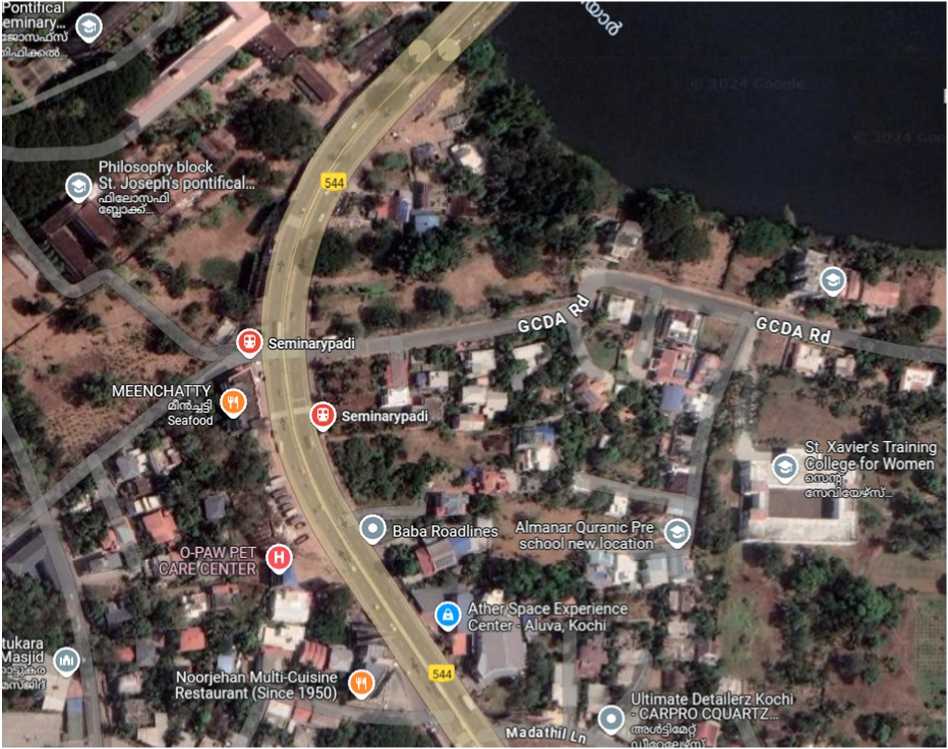
Figure 1. Study area
Table 1: Showing the list of selected plants for the study
|
Sl. No: |
Name of the plants |
Name of the family |
|
1 |
Alternanthera sessilis, Linn. |
Amarantheceae |
|
2 |
Boerhaavia diffusa, Linn. |
Nyctaginaceae |
|
3 |
Mimosa pudica, Linn. |
Mimosae |
|
4 |
Sida acuta, Burm.f. |
Malvaceae |
|
5 |
Peltoohorum pterocarpum |
Fabaceae |
|
6 |
Ficus religiosa |
Moraceae |
|
7 |
Ficus benghalensis |
Moraceae |
|
8 |
Swietenia macrophylla |
Meliaceae |
|
9 |
Gliricidia septum |
Fabaceae |
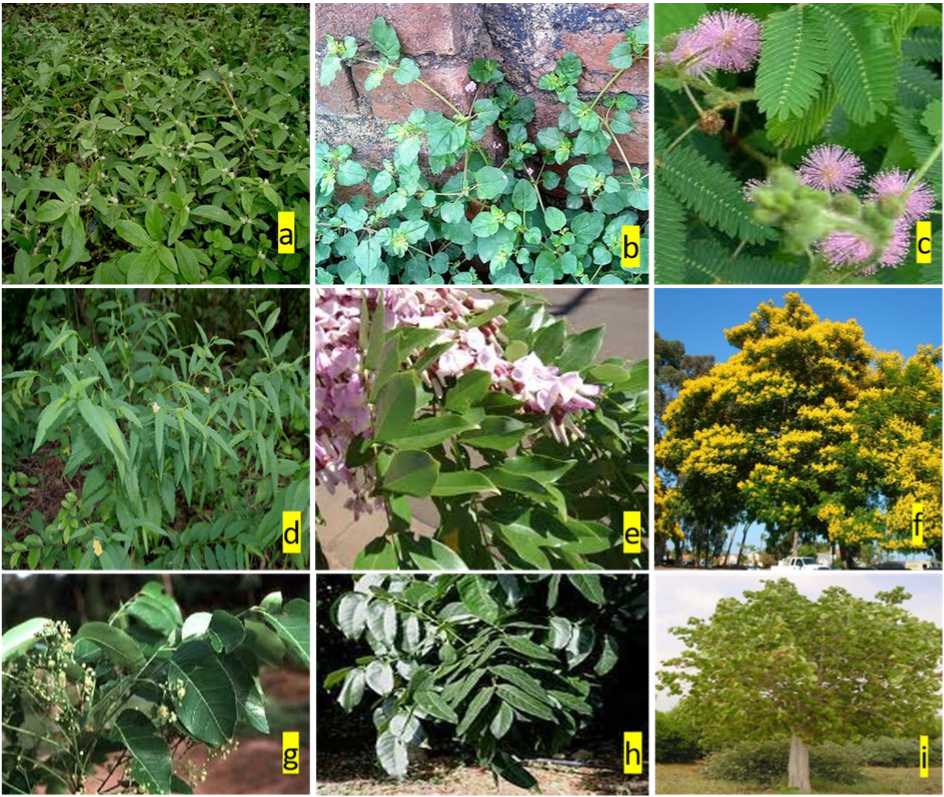
Figure 2. Habit of selected plants for the study a) Alternanthera sessilis ; b) Boerhaavia diffusa ; c) Mimosa pudica ; d) Sida acuta ; e) Gliricidia sepium ; f) Peltophorum pterocarpum ; g) Ficus benghalensis ; h) Swietenia macrophylla I) Ficus religiosa
Table 2: Absorbic acid composition in plants collected from polluted and control site
|
Sl. No: |
Name of the plant |
ES (mg/g) |
CS (mg/g) |
|
1 |
Alternanthera sessilis |
0.058 |
0.026 |
|
2 |
Mimosa pudica |
0.056 |
0.02 |
|
3 |
Boerhaavia diffusa |
0.05 |
0.03 |
|
4 |
Sida acuta |
0.05 |
0.014 |
|
5 |
Peltoohorum pterocarpum |
0.02 |
0.01 |
|
6 |
Ficus religiosa |
0.11 |
0.08 |
|
7 |
Ficus benghalensis |
0.7 |
0.3 |
|
8 |
Swietenia macrophylla |
0.42 |
0.25 |
|
9 |
Gliricidia septum |
0.06 |
0.03 |
ES – Experimental site CS – Control site
Figure 3. Showing the ascorbic acid content of plants in polluted site and control site
Table 3 : Chlorophyll content in plants collected from polluted and control site
|
Sl.no: |
Name of the plant |
ES (Experimental site) |
CS (Control site) |
||||
|
Chl a |
Chl b |
TCL (mg/g) |
Chl a |
Chl b |
TCL (mg/g) |
||
|
1 |
Alternanthera sessilis |
27.15 |
47.12 |
74.27 |
17.15 |
47.12 |
64.27 |
|
2 |
Mimosa pudica |
27.15 |
47.12 |
71.27 |
4.32 |
3.57 |
7.89 |
|
3 |
Boerhaavia diffusa |
27.15 |
47.42 |
74.57 |
14.75 |
40.59 |
55.34 |
|
4 |
Sida acuta |
23.03 |
43.23 |
66.26 |
7.34 |
13.08 |
20.42 |
|
5 |
Peltoohorum pterocarpum |
2.837 |
32.52 |
35.35 |
0.35 |
12.35 |
12.70 |
|
6 |
Ficus religiosa |
23.49 |
19.18 |
42.68 |
11.15 |
7.5 |
18.65 |
|
7 |
Ficus benghalensis |
17.28 |
23.67 |
40.89 |
12.15 |
10.21 |
22.36 |
|
8 |
Swietenia macrophylla |
14.90 |
18.612 |
33.51 |
4.15 |
2.15 |
6.30 |
|
9 |
Gliricidia septum |
3.108 |
33.15 |
36.26 |
0.05 |
12.15 |
12.25 |
Chlorophyll content
■ ES(Experimental site) ■ ES(Experimental site) ■ ES (Experimental site)
■ CS (Control site) ■ CS (Control site) ICS (Control site)
Figure 4. Showing the levels of Chlorophyll of plants in polluted site and control site
Table 4: Plant extract pH of plants collected from polluted and control site
|
Sl. no: |
Name of the plant |
ES |
CS |
Difference |
|
1 |
Alternanthera sessilis |
7.11 |
7.06 |
0.05 |
|
2 |
Mimosa pudica |
6.61 |
6.31 |
0.3 |
|
3 |
Boerhaavia diffusa |
6.56 |
6.17 |
0.39 |
|
4 |
Sida acuta |
7.04 |
6.94 |
0.1 |
|
5 |
Peltoohorum pterocarpum |
6.7 |
6.2 |
0.5 |
|
6 |
Ficus religiosa |
5.58 |
5.4 |
0.18 |
|
7 |
Ficus benghalensis |
6.62 |
6.1 |
0.52 |
|
8 |
Swietenia macrophylla |
4.85 |
4.7 |
0.15 |
|
9 |
Gliricidia septum |
6.6 |
6.42 |
0.18 |
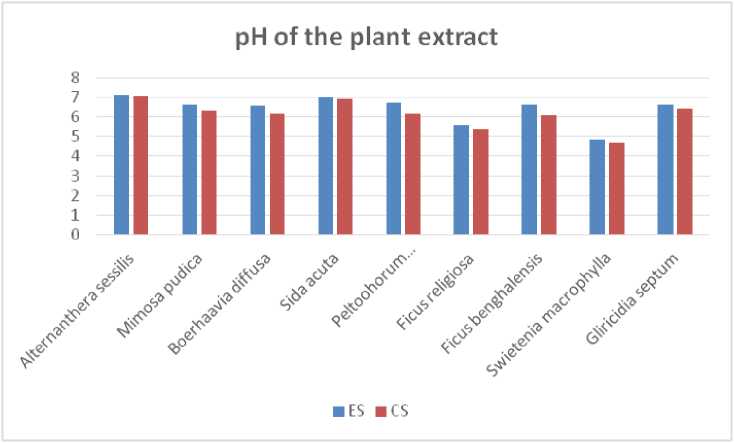
Figure 5. Showing pH of plant extract of plants in polluted site and control site. ES – Experimental site. CS – Control site
Table 5: Relative Water Content in plants collected from polluted and control site
|
Sl. No. |
Plant |
Relative water % |
|
|
ES |
CS |
||
|
1 |
Alternanthera sessilis |
90.74 |
71.86 |
|
2 |
Mimosa pudica |
86.78 |
81.57 |
|
3 |
Boerhaavia diffusa |
90.51 |
76 |
|
4 |
Sida acuta |
79.33 |
74.38 |
|
5 |
Peltoohorum pterocarpum |
39.288 |
36.25 |
|
6 |
Ficus religiosa |
69.845 |
42.12 |
|
7 |
Ficus benghalensis |
71.056 |
56.12 |
|
8 |
Swietenia macrophylla |
72.027 |
54.25 |
|
9 |
Gliricidia septum |
60.983 |
48.12 |
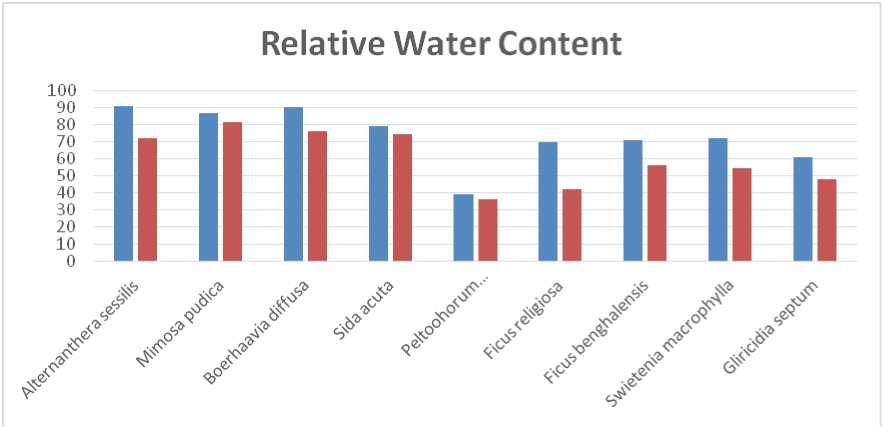
blue – Experimental site. red – Control site
Figure 6. Relative Water Content of plants in polluted site and control site
Table 6: Air Pollution Tolerance Index in plants collected from polluted and control site
|
Sl. no: |
Name of the plant |
ES |
CS |
|
1 |
Alternanthera sessilis |
9.54 |
7.39 |
|
2 |
Mimosa pudica |
9.13 |
8.18 |
|
3 |
Boerhaavia diffusa |
9.45 |
7.78 |
|
4 |
Sida acuta |
8.29 |
7.47 |
|
5 |
Peltoohorum pterocarpum |
0.421 |
0.212 |
|
6 |
Ficus religiosa |
0.751 |
0.52 |
|
7 |
Ficus benghalensis |
1.043 |
0.74 |
|
8 |
Swietenia macrophylla |
0.888 |
0.54 |
|
9 |
Gliricidia septum |
0.635 |
0.32 |
CS – Control site
ES – Experimental site
Figure 7. APTI of plants in polluted site and control site
Plants growing on experimental site showed an elevation in the ascorbic acid content. In experimental site Ficus benghalensis showed highest value of ascorbic acid content. Boerhaavia diffusa and Sida acuta has the lowest value. In control site , Ficus benghalensis also showed the maximum value. Peltoohorum pterocarpum has the lowest value in control site. Ascorbic acid is also known as vitamin-C. It plays an important role in Photosynthesis, defence mechanism (Arora et al ., 2002), cell wall synthesis and cell division. And have important role in the tolerance capacity of plants. Present study showed an increase in the ascorbic acid content in plants from experimental site compared to plants from control site.
Plants collected from experimental site contain high amount of chlorophyll compared to control site. In both control and experimental sites, Alternanthera sessilis shows same and the highest total chlorophyll content. In experimental site, both Alternanthera sessilis and Boerhaavia diffusa contain high chlorophyll content. In control site, Alternanthera sessilis contains the highest amount and Mimosa pudica contain the least chlorophyll content. Exceptionally Mimosa pudica exhibit a marked difference in total chlorophyll content between two sites. Chlorophyll is an index of the productivity of plant and it signifies its photosynthetic activity, growth, development. It is evident that chlorophyll content of plant varies from species to species; age of the leaf and also with the pollution level. The total chlorophyll content is also related to ascorbic acid productivity because ascorbic acid is mainly concentrated in chloroplast. In the present study, plants except Mimosa pudica from experimental site possess higher level of chlorophyll than plants from control site.
Plants collected from experimental site has high amount of relative water content. Among the plants collected from experimental sites, Alternanthera sessilis and Boerhaavia diffusa has high amount of relative water content. And Sida acuta has the least. In control site Mimosa pudica has the highest amount of relative water content. Alternanthera sessilis shows highest difference in relative water content between two sites. Least difference was shown by Mimosa pudica and Sida acuta. Relative water content of leaf is the water present in it relative to its full turgidity. Plants in polluted areas have demonstrated higher Relative Water Content (RWC), indicating an adaptive response to environmental stressors and a balance in physiological parameters (Tsega and Prasad, 2014). This increased resistance may be due to a reduction in the transpiration process, which is caused by the closure of stomata as a result of dust accumulation on leaves and lowered soil water levels at contaminated sites (Shakeel et al., 2022). Similar findings have been observed in previous studies by Rai (2020) and Anake et al. (2022). The relative water content helps to maintain the physiological balance under stress conditions of air pollution (Dedio, 1975). The plants with high relative water content under polluted conditions may be tolerant to pollutants. In this work, there was an increase in relative water content in plants collected from experimental site than plants collected from control site. In the case of Boerhaavia diffusa, it shows an elevated level in relative water content and total chlorophyll content difference between experimental and control site. By these two elevated parameters, it became the tolerant species in the experimental site which is highly polluted. In the case of Mimosa pudica, surprisingly it exhibits higher total chlorophyll content in experimental site. It can be suggested that mimosa pudica adapting to the polluted environment by increasing the photosynthetic activity as chlorophyll content is direct measure of photosynthesis. Mainly because of this parameter, it became tolerant to air pollution and survive in experimental site. But its APTI value was low and hence it is least dominant. Sida acuta comparatively shows reduced level in total chlorophyll content and have least APTI value. Hence it is sensitive to vehicular pollution and least dominant.
The Air Pollution Tolerance Index (APTI) used to identify plants that are more tolerant to air pollution for the purpose of reducing air pollution levels. APT evaluates the ability of plant species to tolerate air pollution based on biochemical characteristics of their leaves, such as ascorbic acid content, total chlorophyll content, relative water content, and leaf extract pH. Meanwhile, API quantifies the environmental performance of plant species by incorporating APTI and the socioeconomic benefits of the species (Subramani and Devaanandan, 2015).
In experimental site, Alternanthera sessilis and Boerhaavia diffusa shows highest APTI value. In control site Mimosa pudica shows highest APTI value. Peltoohorum pterocarpum exhibited highest difference in APTI value between experimental and control site. This study reveals that different plant species respond differently to air pollution. The plants with high and low APTI value can serve as tolerant and sensitive species respectively (Singh & Rao, 1983). It was observed that plants collected from experimental site have higher APT value compared to those from control site. Among the four parameters to determine the APTI value, highest difference between experimental and control site was observed in the Relative water content. All the other parameter differences were low. This suggests that Alternanthera sessilis physiologically adapted to the vehicular pollution by increasing the relative water content. Even though the exact mechanism of this adaptation is not known, it can be concluded that the tolerance and dominance of Alternanthera sessilis in the road side of NH 47 may be due to this adaptation.
Research has shown that the concentrations of ascorbic acid, total chlorophyll, relative water content, and leaf extract pH indicate polluted urban environments due to stress from dust particle deposition on leaf surfaces (Rao, 1979). These parameters help determine whether plants are sensitive or tolerant to air pollution. APTI is used to assess and rank plant species based on their capacity to withstand air pollution. Sensitive plants can serve as biological monitors or indicators of air quality, while tolerant species help reduce overall pollution levels. Sensitive species act as early warning signs of contamination (Rai et al, 2013). Vegetation is a crucial element in the environment for reducing air pollution levels and it can also be used as a bioindicator of air pollution.
CONCLUSION
This study reveals that in NH 47 the dominance pattern of plants obtained during quadrant study is similar to the result obtained by APTI value determination. The APTI value was higher for Alternanthera sessilis and Boerhaavia diffusa and they were the most dominant species of NH 47. The APT value of Mimosa pudica and Sida acuta was lesser and they were the least dominant species present in NH 47. Current study proves that parameters like Ascorbic acid content, pH of the leaf extract, Total chlorophyll content and Relative water content are important and useful parameters in determining the sensitiveness or tolerance of plants to air pollution. This study also suggests that plants present on the polluted site when compared to control adjust to the changed environment by altering the physical and biochemical characteristics. A study in the molecular and gene expression level may give more insights in to the actual mechanism of the adaptations shown by these plants. The significance of determining APTI value is that the tolerant or sensitive plant species can be identified. It is suggestible that the tolerant plants marked in the investigation can be employed in abatement and control of air pollution.
ACKNOWLEDGMENTS
