Assessing export potential of the country in the context of global demand in the world food market

Author: Otmakhova Yuliya S., Usenko Natalya I., Devyatkin Dmitrii A., Songkasiri Warinthorn
Journal: Economic and Social Changes: Facts, Trends, Forecast @volnc-esc-en
Section: Economics of the agro-industrial complex
Article in issue: 4 (64) т.12, 2019.
Free access
Food export, diversification, basket of export specialization, global import, data filtering, food space
Short address: https://sciup.org/147224190
IDR: 147224190 | UDC: 338.43:339.564 | DOI: 10.15838/esc.2019.4.64.7
Text of the article Assessing export potential of the country in the context of global demand in the world food market
Opportunities to grow and implement country’s export potential are among key factors which ensure competitiveness of national economy. Analysis of export flows is an important component of country’s export policy development. Indices of Balassa and Vollrath and their modifications [1–7] are classic tools for conducting these types of research. Methodological tools for identifying the most perspective external markets include classic methodological “shift-share” [8]. The work [9] examines issues of revealing export directions which can effectively develop with internal financial support. The metric of “complexity”, or “manufacturability”, of goods, which can be used as one of the factors of revealing and assessing growth points’ prospects, is proposed for assessment of interconnections between export and “complexity” of goods in the work [10].
Foreign researchers in the works [11–13] present a concept of food space exported by a country. A number of domestic researchers support and develop these approaches [14; 15]. It is highlighted in the work [15] that it is necessary to assess export potential of goods which have higher share in country’s export than in average global export. Also, a large part of export growth should go through deepening of export flows of top goods.
In recent years, export of food and agricultural commodities has become an important direction of Russian agricultural policy. According to the Order of the Russian Federation President “On National Goals and Strategic Objectives of the Russian Federation through to 2024” No. 204, dated 07.05.2018, goals of achieving export numbers of agricultural sector products in the amounts of 45 billion American dollars per year until 2024 were set. The scale of this task determines the relevance of scientific researches on export topics, food export in particular. The aim of this study is to develop approaches to the methodology of analysis of the dynamics and structure of global food import in assessing the directions to strengthen Russia’s export position on the global market of food products and raw materials.
Despite the success in food export, current undiversified commodity structure of Russian food export, in our opinion, may show strategic vulnerability in the environment of political and economic instability growth in global economy. According to data of customs statistics, in 2017, three major product groups – grains and its processed products; fish and crustaceans; fats and oils of animal or vegetable origin – represented 70% of total food export value1 in in the structure of Russian food export. Unproportioned participation of regions in export shipments also takes place. As it is stated in the work [18], irregularity of distribution of export activity caused the situation when 10 primary entities provide 69.3% of country’s total non-resource export.
It is necessary to note serious problems concerning the implementation of export potential on the food market in Russia. In practice, Russian exporters of agricultural products often face subjective difficulties in obtaining qualified information about the “rules of the game” on the markets of individual countries [19]. In our opinion, the fact of Russia’s leadership on the global market in terms of wheat grain export creates an illusory idea for many manufacturers that it is enough to grow a crop in order to solve issues of selling it and getting high incomes. Thus, there was a record grain harvest in the Novosibirsk Oblast in 2017 – local farmers sowed all available areas with wheat. Consequently, amounts of harvest significantly exceeded capabilities of storage and selling. Rapid growth of grain reserves led to non-production costs (grain rotting in fields, warehouses and elevators), price drop, and agricultural manufacturers’ bankruptcy.
Necessity to address the issues of export income improvement and growth sustainability of country’s agricultural sector causes scientific and practical relevance of researches on developing approaches to assessing directions of increasing country’s export potential.
Methods and information
Data from FAOSTAT informational basis – The Food and Agriculture Organization of the United Nations (FAO) [20] – are used in this research. It contains information about production, export, and import levels in more than 90 food and agricultural product categories of 245 countries from 1961 until present moment.
Within research, a comparative assessment of Russian export trade positions and summary measures of global food import in the context of trade groups, not including fishery products, was performed. It must be noted that fishery products are included into FishStat database in FAO. For providing data comparability for export analysis from the RF, FAO statistics was also used2. Authors in the work [21] did the analysis of existing global statistics databases and pointed out that usage of FAO informational base allows performing a complex analysis of dynamics and trade structure of global food export.
A basic stage of the research was usage of methods for filtering records of trade currents in FAOSTAT informational bases for estab-lishing samples suitable for the analysis’ purpose. Pandas3 library was used for program implementation of efficient computational filtering of named sets of big data.
According to the purpose of this research, we propose an assessment methodology of trade positions of export specialization, based on the criteria we allocate (Tab. 1), for defining competitive status of trade items, taking into account a degree of global food demand satisfaction.
The following threshold values and conditions for suggested criteria were adopted for assessing a value of commodity items of Russian food export:
-
• for criterion C0 – the share in the total value of the Russian Federation food exports, not less than 10%;
-
• for criterion C1 – the presence of the matching pairs “Top global import” – “Top export of the Russian Federation”;
Table 1. Criteria for defining competitive status of trade items
Criteria
Interpretation
C0
The value of the export share of commodity items in the Russian Federation food export.
C1
Includes determination of matching/mismatching commodity items in the pair “Top global import” – “Top export of the Russian Federation”.
C2
The average growth rate of global imports (in kind) in the context of commodity items.
C3
The value of the rate of dynamics variation of global goods import amounts. Shows the degree of variability of these products demand on global market.
C4
SPR coefficient, showing the share of commodity items of Russian exports in meeting global needs (import) of specific goods and commodity groups.
Source: own compilation.
2 Russia, as a member of the Food and Agriculture Organization of the United Nations (FAO), forms balances of food resources according to a unified international methodology.
3 Available at:
-
• for criterion C2 – the average growth rate of world imports (in kind), not less than 6%;
-
• for criterion C3 – the value of the rate of dynamics variation of global import amounts, not more than 20%;
-
• for criterion C4 – the value of SPR coefficient showing the share of commodity items of Russian exports in meeting global needs (import), not less than 4%.
Within the research, formation of selective informational arrays, necessary for analysis and calculations of indicators, was conducted. In particular, we filtered the records about trade flows in the FAOSTAT databases, the total volume of world imports of which (based on data for 245 countries) is at least 200 million US dollars per year (2013) and has a positive trend growth in kind over the period from 1993 to 2013. Then the procedure of acquired samples ranking was performed and the list of leading commodity items “TOP-Global food import” was made. The ranking was organized according to the amount of share of overall import of commodity item in total amount of global export. The ranking is based on values’ decline and the limiting value for inclusion in the ranking was value of estimate not less than one percent.
For the TOP-list products, the average growth rate of total imports (in kind) was calculated according to FAO data for the period of 1993–2013. Also, the coefficients of variation were calculated on the basis of pre-formed dynamic series for the period of 2000–2013 in order to assess the degree of their variability over time.
The ranking of commodity items of export specialization – the Russian Federation food (not including fishery products) – was compiled on the basis of the sample obtained from the FAO database. It was done by filtering goods,
Russian export amounts of which were at least 10 million dollars per year (for 2013). The ranking, just like in the previous case, was organized in descending value order: the limiting value of estimated indicator, necessary for inclusion in the ranking, was at the level of at least one percent.
Then the analysis for defining competitive status of commodity items was conducted in accordance to suggested by authors criteria C0–C4, including calculation of SPR (Substantial PRoduct) relative indicator for matching commodity items in pair “Top global import” – “Top export of the Russian Federation”.
Results and discussion
On the first stage of the research sample from the FAO database of food products was acquired in order to analyze dynamics and structure of global food import indicators. 258 products and product groups, with values of total import amount (on the basis of 245 countries) not less than 200 million dollars per year (for 2013), were included in the sample. After ranking acquired sample, the list of leading commodity items “TOP-Global food import” was complied. The list of commodity items of this ranking included 28 items. It should be noted that five top positions of the ranking accumulate 20% of overall amount of global import: 1) soybeans – 4.9%; 2) readycomposite and other food products – 4.5%; 3) wheat – 4.3; 4) palm oil – 4.3; 5) corn – 3.1%. The share of commodity items gradually decreases further in the list. From the position number 21 to 28 values of indicators become almost equal (Fig. 1).
For items from the TOP-list, indicators of total import average growth rates (in kind) on the basis of FAO data for 1993–2013 were calculated. The analysis showed that, despite
Figure 1. Ranking of commodity goods of global food import, 2013, %
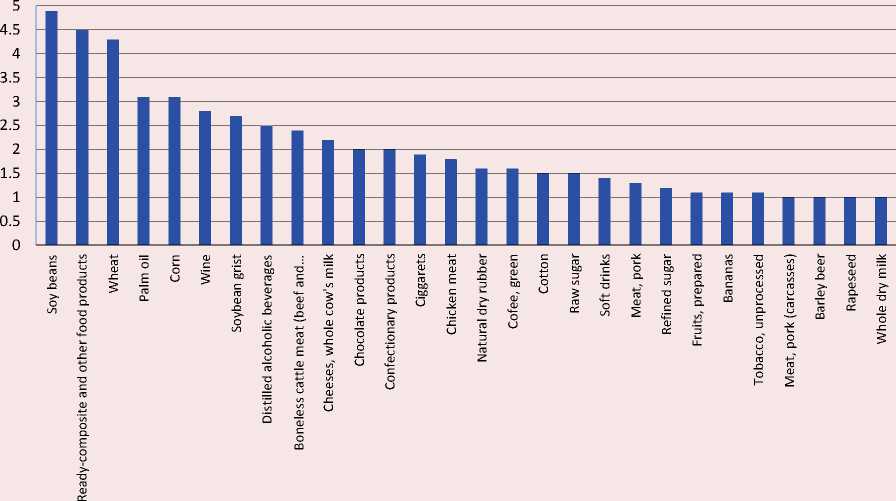
Source: own compilation according to FAOSTAT data.
different average growth rates of import, positive values of this indicator are present for all leading commodity items. The highest growth rates of global import were spotted in the following commodity items: pork meat (10.9%); confectionery (8.9%); soft drinks (8.8%); chicken meat (8.4%). The nature of the relationship between the average import rates of commodity items and their share in global import is very contradictory and divergent (Fig. 2).
To assess the degree of global import indicators’ variability (in kind) over the years for commodity items of ranking, variability coefficients were calculated on the basis of preformed dynamic arrays for 2000–2013. The analysis of these indicators shows the degree of variability of demand for these types of products on the global market. According to this, it is possible to draw conclusions concerning risk degree of export shipment of products or product groups4.
The analysis results of distribution of calculated coefficients of commodity items variability, included in TOP-import rating, show that more than one third of commodity items are in the big risk zone (Tab. 2).
More than a half of commodity items, included in TOP-Global food import, have values of variation coefficients indicating the average degree of dispersion, i.e. showing quite moderate variability of global demand for these types of products. Indicators analysis of commodity item share in global import and variation coefficients show the lack of dependence of demand variability indicators on the share of a given commodity item in global import ( Fig. 3 ).
Figure 2. Average import speed (%) for 1993–2013 and a share of a total import amount of commodity items (on the basis of 245 countries) in global food import
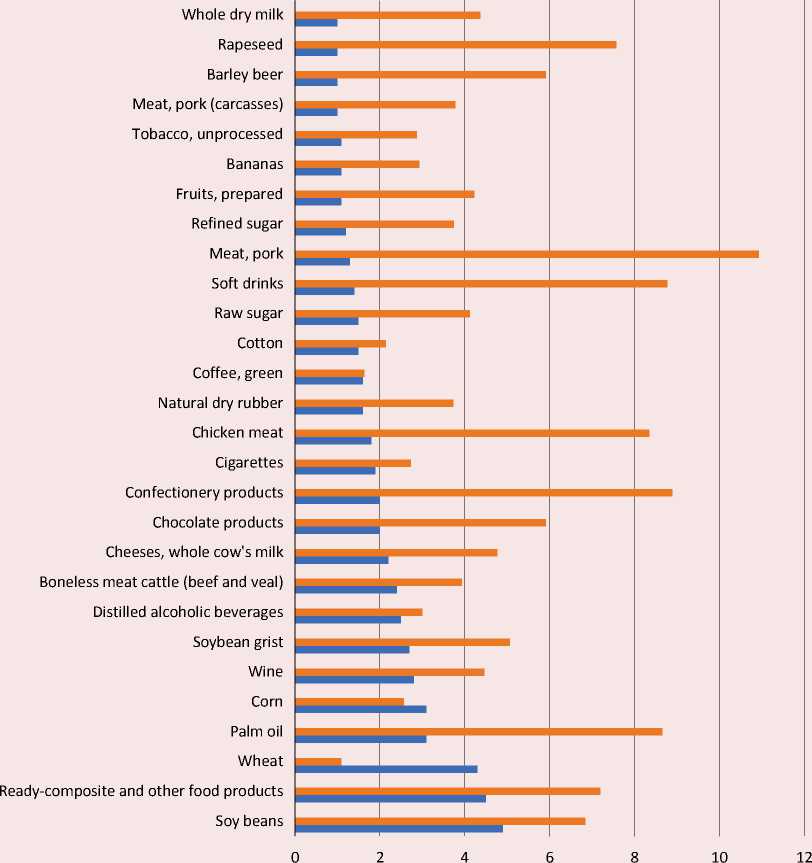
■ Average import growth rate, % ■ Share of a commodity item in global import, %
Source: own compilation according to FAOSTAT data.
Table 2. Distribution of variability coefficients’ values over intervals
|
Indicator |
Range of variation coefficient, % |
||
|
Until 10 |
10–20 |
21–33 |
|
|
For TOP-import |
|||
|
Number of commodity items in the interval |
2 |
15 |
10 |
|
The share of the number of commodity items in the interval, in the total amount |
7.5 |
55.5 |
37.0 |
|
Source: own compilation according to FAOSTAT data. |
|||
Figure 3. Variation coefficients and share of a total amount of commodity items import (on the data of 245 countries) in global food export
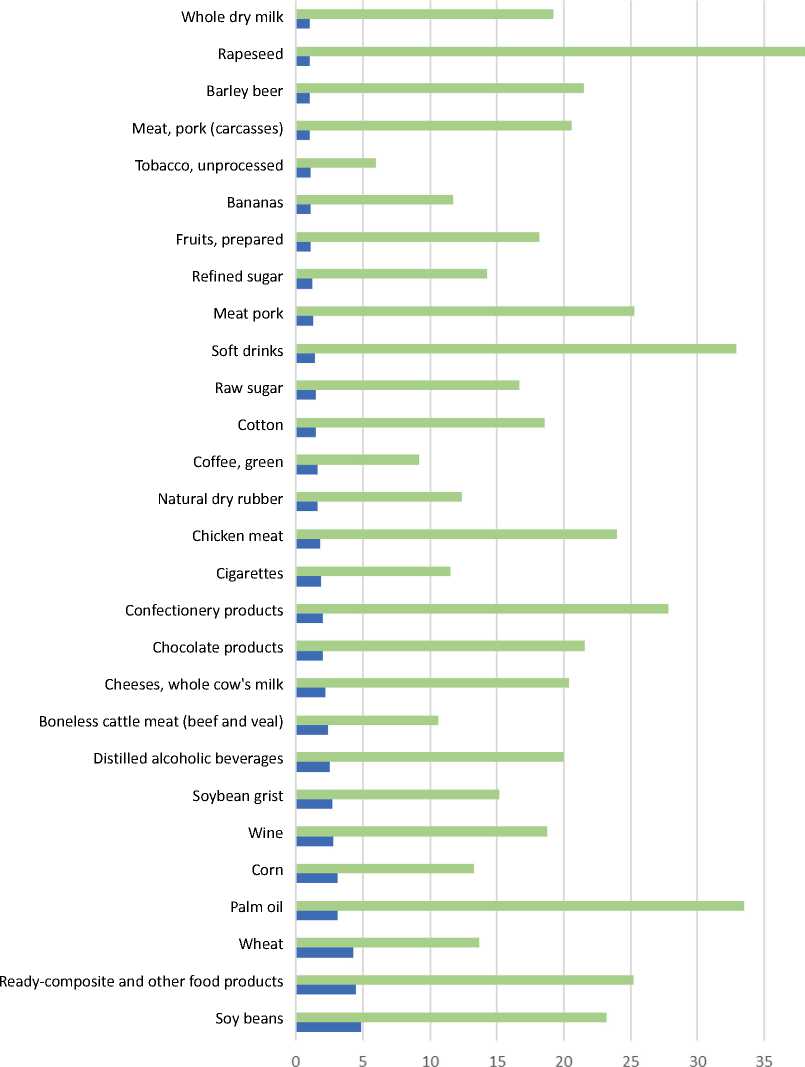
Variation coefficient, % ■ Share of commodity item position in world import, %
Source: own compilation according to FAOSTAT data.
Figure 4. Ranking of commodity items if Russian food export (not including fishery products), 2013, %
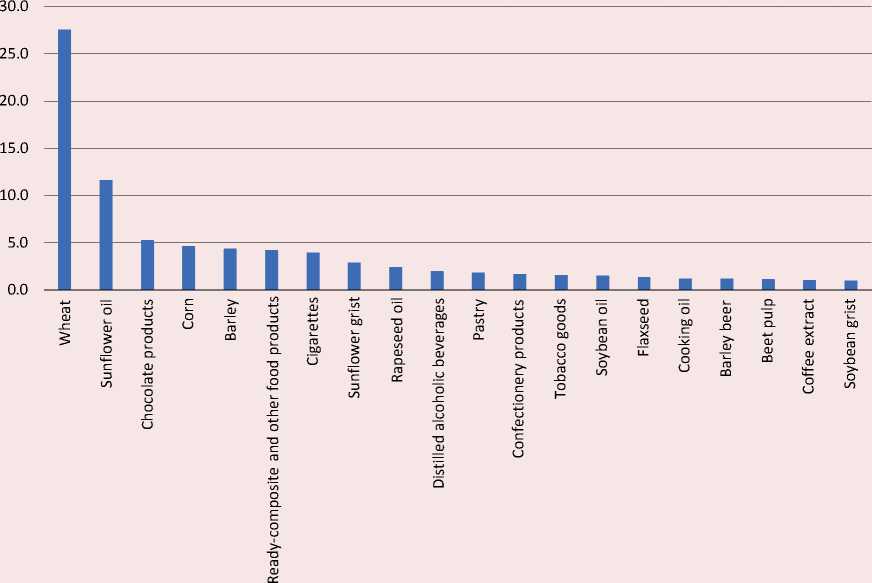
Source: own compilation according to FAOSTAT data.
For the analysis of Russian food export, a sample from the FAO database was analyzed by filtering goods whose export amount from Russia was at least 10 million dollars per year (for 2013). This sample included 72 commodity items ( Fig. 4 ).
Two leading commodity items (wheat and sunflower oil) account for 40% of a total amount of the sample (27.5% and 11.7% respectively). The next in the list – 5 commo-dity items (chocolate products, corn, barley, ready-composite and other food products, cigarettes) with a share between 4 and 5.3%, their total share is 22.5%. Thus, 7 commodity items account for 62.5% and the following 70 products and product groups – less than 38%.
Then, ranking of the most important products was complied. It was limited by inclusion of commodity items with share numbers of export value in its total amount not less than one. Twenty commodity items of export specialization were included in this list, which, in total, account for 78.22% of Russian food export.
To define the competitive status related to various commodity items of export specialization basket of Russian food exports, an assessment, in accordance with the criteria C0-C4 suggested by authors, was made. The research was conducted on the basis of initial data obtained from two samples: “TOP-Global food import” and “TOP-20. The Russian Federation food export (not including fishery products)”. The results of the analysis of commodity positions for matches in leading groups of Russian export and global food import show (Fig. 5) that 9 items coincide: wheat, chocolate products, corn, ready-composite and other food products,
cigarettes, distilled alcoholic beverages, confectionery, sugar confectionery, barley beer. It means that a significant part of items list (one third) in the basket of the Russian Federation export specialization corresponds to the list of goods-leaders of global demand
Figure 5. Definition of positions in the pair “Top-Global import” – “The Russian Federation top-exports”
|
Commodity items “Top global import” |
|
|
According to FAO classification |
Translation |
|
Soybeans |
Соевые бобы |
|
Food preparationsnes |
Составные готовые и другие пищевые продукты w |
|
Wheat |
Пшеница |
|
Oil, palm |
Пальмовое масло |
|
Maize |
Кукуруза |
|
Wine |
Вино |
|
Cake, soybeans |
Шрот соевый а |
|
Beverages, distilledalcoholic |
Напитки дистиллированные алкогольные ft |
|
Meat, cattle, boneless (beef & veal) |
Мясо КРС без костей (говядина и телятина) |
|
Cheese, whole cow milk |
Сыры, цельное коровье молоко |
|
Chocolate productsnes |
Шоколадные изделия ф |
|
Pastry |
Кондитерские изделия |
|
Cigarettes |
Сигареты |
|
Meat, chicken |
Мясо курицы |
|
Rubbernaturaldry |
Натуральный каучук сухой |
|
Coffee, green |
Кофе зеленый |
|
Cottonlint |
Хлопчатник |
|
SugarRawCentrifuga |
Сахар сырец |
|
Beverages, nonalcoholic |
Напитки безалкогольные |
|
Meat, pork |
Мясо, свинина |
|
Sugarrefined |
Сахар рафинированный |
|
Fruit, preparednes |
Фрукты, подготовленные |
|
Bananas |
Бананы |
|
Tobacco, unmanufactured |
Табак, необработанный |
|
Meat, pig |
Мясо, свинина (в тушах) |
|
Beerofbarley |
Пиво из ячменя |
|
Rapeseed |
Семена рапса |
|
Milk, wholedried |
Молоко сухое цельное |
|
Commodity items “Top global import” |
|
|
According to FAO classification |
Translation |
|
Wheat |
Пшеница |
|
Oil, sunflower |
Подсолнечное масло |
|
Chocolate products nes |
Шоколадные изделия |
|
Maize |
Кукуруза |
|
Barley |
Ячмень |
|
Foodprepnes |
Составные готовые и другие пищевые продукты |
|
Cigarettes |
Сигареты |
|
Cake, sunflower |
Шрот подсолнечный |
|
Oil, rapeseed |
Рапсовое масло |
|
Beverages, distilled alcoholic |
Напитки, дистиллированные алкогольные |
|
Pastry |
Кондитерские изделия |
|
Sugarconfectionery |
Сахаристые кондитерские изделия |
|
Tobaccoproductsnes |
Табачные продукты |
|
Oil, soybean |
Соевое масло |
|
Linseed |
Семена льна |
|
Fat, nes, prepared |
Кулинарные жиры, приготовленные из растительных и животных масел и жиров |
|
Beer of barley |
Пиво из ячменя |
|
Beetpulp |
Свекольный жом |
|
Coffee, extracts |
Кофе экстракт |
|
Cake, soybeans |
Шрот соевый |
Source: own compilation according to the results of conducted calculations.
for food. From the list of commodity items with the highest growth rates of world import, only confectionery products were included in the “TOP-20. The Russian Federation food export” list.
To assess competitiveness of products from Russian export basket specialization, SPR coefficient was suggested and calculated. It shows a share of Russian export in meeting global demand (import) for specific products and product groups (Fig. 2). This coefficient can be analyzed as an indicator showing the competitiveness of commodity groups on global market (the higher the coefficient, the higher the competitiveness). Then, the distribution of items, included in the rating “TOP-20. The Russian Federation food export”, over SPR interval with the selection of items matching and not matching names of product-leaders of global import was made (Tab. 3).
According to the results of calculations, item, corresponding with arterial directions of global import, with a maximums SPR indicator (6.46) is wheat. This indicator’s numbers of all the other items from this list are significantly lower. If we combine such groups as confectionary (0.93), chocolate products (2.63), sugar confectionery (2.03), allocated within FAO classification, the value of this group will be 5.59% – it shows growing global demand for these products.
The highest SPR coefficient values are found in commodity items not matching the list of “TOP-Global food import”. For example, an important item of Russian export is sunflower oil. Its share is 11.7% in a total
Table 3. SPR distribution of commodity items according to SPR indicator*
|
No |
Interval, % |
Matching commodity items** |
Not matching commodity items |
||
|
According to FAO classification |
Translation |
According to FAO classification |
Translation |
||
|
1. |
<1 |
Ready-composite and other food products (0.95), distilled alcoholic beverages (0.81), confectionary (0.93) |
Составные готовые и другие пищевые продукты (0.95) напитки дистиллированные алкогольные (0.81) кондитерские изделия (0.93) |
Soybean grist (0.37) |
Шрот соевый (0.37) |
|
2. |
1–3 |
Corn (1.51), chocolate products (2.63), barley beer (1.16), sugar confectionery products (2.03), cigarettes (2.11) |
Кукуруза (1.51), шоколадные изделия (2.63), пиво из ячменя (1.16), сахаристые кондитерские изделия (2.03), сигареты (2.11) |
Rapeseed oil (3.87), tobacco products (3.96), soybean oil (1.81), coffee, extract (1.88) |
Рапсовое масло (3.87), табачные продукты (3.96), соевое масло (1.81), кофе экстракт (1.88) |
|
3. |
4–7 |
Wheat (6.46) |
Пшеница (6.46) |
Barley (5.89), сooking fats made from veg etable and animal oils and fats (4.45) |
Ячмень (5.89) кулинарные жиры, приготовленные из растительных и животных масел и жиров (4.45) |
|
4. |
8–16 |
No |
Sunflower oil (14.5); |
Масло подсолнечное (14.5) |
|
|
5. |
17–20 |
No |
Sunflower grist (17.8), flaxseeds (19.5) |
Шрот подсолнечный (17.8) Семена льна (19.5) |
|
* Product “Beetpulp” was not included in sample “Global food import” due to amount of overall import being below threshold value used for constructing sample. That is why SPR-indicator was not calculated for this item.
** Matching/not matching items in the pair “Top-Global import” – “The Russian Federation top-exports”.
Source: complied by the authors according to FAOSTAT and The Russian Federal State Statistics Service data.
amount of Russian food export (not including fishery products). High value of SPR indicator should be noted: it is equal to 14.5% and indicates a significant role of this item’s export on global market. A share of its total import value on global market is 35.7%, so the reviewed sample is inhomogeneous and deviations from trend lines are significant. Consequently, organization of export shipments of this item is followed by great risks.
The accompanying product in the production of sunflower oil is sunflower grist (used for feeding animals, birds, fish, and also as food additive), which accounts for a significant share of exports from Russia (about 17.8%). However, the share of this item on global market is 0.2%, and in the ranked list of global commodity items import it occupies 119th position. The coefficient of variation is very high – 34.4%.
Product “Linseed” is in an interesting situation: it was not included in TOP-20 group, but this product’s share in Russian export is quite large (19.5%) in global import of this item. Share of this item in global import is 0.1% and it occupies only 180th position in the list ranked according to descending value order of global commodity items import. Coefficient of variation – 13.8%, which indicates quite average fluctuations of demand for this product. Almost the entire Russian harvest of this agriculture is exported. Oil flax can compete with grain crops in regions with low yields, in particular in the Volga Federal District and Western Siberia. Flax is simply cultivated and well integrated into the crop rotation, but it accounts for less than 1% of all crops in the country. Export prospects of this crop are determined by comparative advantages of its production and the growing areas of processing of this raw material.
The commodity item with the highest competitive status, selected in accordance with suggested criteria and thresholds, is wheat. From the point of view of assessing the competitive characteristics of this product, wheat grain has an internal potential for growth and a high level of global demand. The analysis showed that the commodity item “Wheat” is in the trend of global needs and occupies a leading position in Russian export and on global market (highest value of share in Russian export, matching positions in the pair “Top-Global import” – “The Russian Federation top-exports”, SPR coefficient is 6.46%).
Over the past 15 years, Russia has reached a fundamentally new level: it turned from importer into a largest exporter of wheat grain. Russia is the first in the world rank of wheat grain market share (in terms of amount in kind), and the fifth in the world in terms of value of sales, measured in million USD [22]. This is primarily determined by the fact that Russian grain is in a low price category. World market of wheat is traditionally one of the largest and important segments of global food market. Its distinguishing feature is progressive dynamics in long-term dynamics (Fig. 6).
The results of growth prospects of global import amount were verified by objective factors with the help of regression models. These factors include the ratio between the dynamics of global production growth in FAOSTAT (linear trend) and dynamics of growth in UN Comtrade (illustrative trend), as well as dynamics of countries’ population growth according to data of International Monetary Foundation. Acquired prognosis is preliminary and it will be updated by authors with the help of more complex models taking into account significant factors which can have an impact on global consumption and production of wheat (climatic data, macroeconomic, political, and etc.).
Figure 6. Dynamics and prospects of total global wheat import in 1993–2021
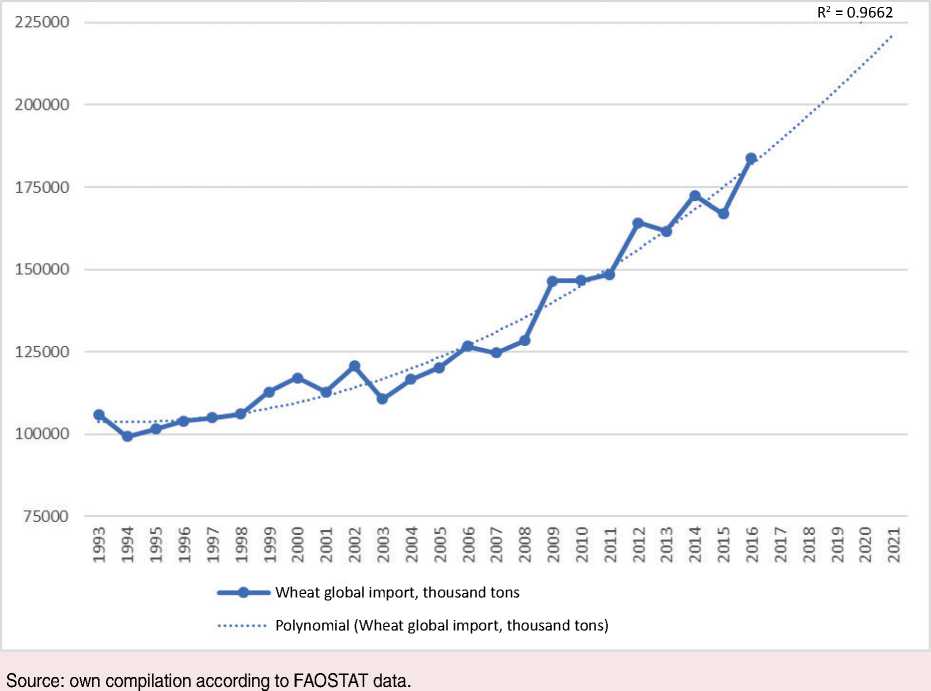
The authors obtained the forecast data of global wheat imports until 2021, which indicate the strengthening of the increasing trend and the possible achievement of global demand for wheat by 2021 at the level of 220 million tons. The forecast was carried out using model of polynomial function, the trend line in the second degree, the approximation coefficient is 0.97, which allows us to talk about an adequate trend model that accurately reflects the patterns of world wheat imports.
It is important to note that growing interest to such traditional type of raw material as wheat happens because of wider use of modern biotechnologies. At the present moment, there is a whole array of high-tech areas on global market for developing food vegetable raw materials which nutritional value and composition may be pre-defined at the stage of creating a variety [23; 24]. In the last 20 years, selection and production of grain crops (rice, wheat, corn) enriched with anthocyanins have become widespread [25-28]. In Russia, the leader in the introduction of DNA markers in crop production (especially in wheat programs) is the Federal Research Center Institute of Cytology and Genetics SB RAS. Conducted experimental studies have shown the possibility of obtaining bakery and confectionery products from a new type of raw material with good organoleptic properties and increased levels of anthocyanins [29]. Thus, the development of new products and raw materials on the food market can ensure
Table 4. Areas of products of wheat grain procession usage
Nowadays, except using wheat grains as raw material for production of food products for population (bread and bakery, flour confectionery: waffles, crackers, pasta), wheat is widely used on global market for obtaining animal food. One of the modern global economy trends is growing demand for food raw material related to expansion of areas of using products of its deep procession for nonfood purposes (Tab. 4). Researchers note that circulation of such product as biofuel in current environment has a global nature [30].
Many products from this list of processed products are used in B2B sphere as food additives, auxiliary ingredients, the purpose of which is associated with increase of the efficiency and manufacturability of industrial production of food products. A vivid example is wide usage of dry gluten, a product of wheat grain procession. A growing number of areas of wheat grain multipurpose usage definitely influences the demand for this important food raw material on global market.
While studying opportunities for increasing potential of Russian wheat export, it is impossible to ignore regional specifics of grain resources reproduction in the country.
Russia, the biggest country in the world, has a significant differentiation of climate and economic environment for growing wheat. At the same time, 85% of its territory is in the zone of risky agriculture. At the current moment in Russia, the structure of grain quality has a noticeable tendency of increasing amount of poor quality grain [31].
The usage of wheat for processing, when it is possible to use low-quality grain, is currently very limited in Russia. For example, most distilleries, processing wheat grain, are closed or are closing. Grain procession into starch and molasses has small production amounts. Complex technology of nonconforming grain procession into raw material for cultivation of different microorganisms – producers of biologically active substances – just starts to develop. Until mid-2014, there were no companies for deep grain procession in Russia3. It needs to be mentioned that this is an expensive market segment, which primarily attractive for foreign investors. At the same time, production of items of deep grain procession has distinct ecological risks connected to technological peculiarities of production. There is largely imported equipment of high capacity offered on the current market: from
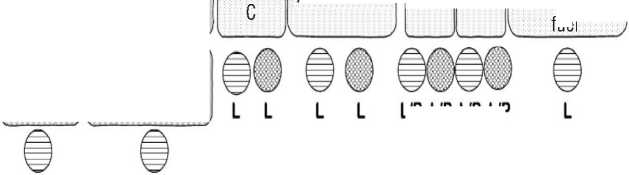
Figure 7. Generalized classification of existing and promising areas and technologies of cassava solid wastes usage in Thailand
AGRICULTURAL SECTOR
Plant auxiliary materials Fertilizers
UP L/P
C
c
50 Baht/ut
In Thailand
1.5-25
Baht/kg
INDUSTRIAL SECTOR
Food industry
C 0.5-3.5 Baht/kg
Vitamin
Production of renewable energy sources
Г Solid
Aromatizers Ethanol Biogas recovered fue
L.
P-
Laboratory scale Pilot project
C 17-18.5 Baht/ut
UP UP UP UP
40 4.7-13.6
Baht/liter Baht/ cubic meter
Worldwide
Existing ways of cassava usage (solid waste)
Promising opportunities for cassava usage (solid waste)
C- Fully commercial project
Source: own compilation on the basis of primary information on the use of cassava processing products.
200 to 500 tons of raw materials per day. It costs several million US dollars. In such environment, domestic developments of deep grain processing technologies, which are oriented at using small form equipment with less capacity, are especially required. Minilines allow more flexible usage of resource potential – not “tied” to raw materials amounts in a limited area without additional logistics schemes of grain supplies. At the first stage of this segment development, mini-factories could provide smoother “entrance” into the market of manufactured products to guarantee selling and to minimize possibilities of financial risks.
From our point of view, the production chain of export products should be overviewed in a complex, including its final stage – management and utilization of production waste. Thailand best practices are interesting:
there was a whole developed array of related industries and options for waste usage around “top” export item – cassava starch (manioc) [32]. Global demand for cassava starch increases every year and, therefore, new options of its usage also emerge. It also causes steady export growth of high quality cassava starch from Thailand over the last 20 years. In 2017, a share of Thailand export in the structure of global cassava starch export was 78%, the value of export – 1.13 billion US dollars.
The growth of starch export – a product of cassava procession – is accompanied by the growth of production waste. It leads to many negative moments and this problem is examined at the government level. Researches of environmental and economic prospects of starch wastes usage and searches for options of cassava starch production improvement are conducted by universities and research centers. Cassava solid waste might be used as raw materials in agricultural and industrial sector productions [32].
Options and technologies of utilization of starch production wastes from tropical cassava raw materials for food and non-food usage are presented in Figure 7. It also includes usage at the lab level, in pilot projects, and in fully commercially demanded productions [33].
Conclusions and suggestions
In this work, our methodology for assessing dynamics and structure of global import and Russian food export was suggested and tested. It was done for correcting directions of Russian export positions strengthening together with assessment of global demand on global market.
Our studies develop the theory of comparative analysis with using indices of competitiveness and the concept of food space by suggesting new direction in the analysis of the assessment of potential opportunities for expanding export potential related to the implementation of modern technologies and scientific solutions on food market. The novelty of the research includes theoretical statement and practical implementation of the research purpose of cooperative review of aggregated values of global import (as a reflection of global demand) and values of commodity items export in the country’s context using methodic of processing large data. The conducted research showed that several leading commodity items with maximum values of Russian export costs are included in global food import ranking:
wheat, corn, chocolate products, barley beer. The authors suggested criteria and threshold values for conducting multi-criteria assessment of products and detailed product groups, new SPR indicator was developed. Promising export commodity items were selected according to the results of calculations of SPR indicator, suggested by the authors: sunflower oil, barley, sunflower cake, flax seeds. These results show that it is necessary to increase the presence of products having high share in global import in Russian export. It could be done by deepening and expanding export flows at the cost of “related” products. At the same time, the article shows that it is necessary to consider the positive experience of other countries, paying attention to the manufacturing of products with high degree of recycling and waste management.
In the future, we intend to continue the research in terms of using our approach toward other informational bases, Comtrade for example, which will allow assessing structure of global food import on terms of another product classification. Our methodology can be used as one of the approaches to the analysis of the potential for expanding Russia’s export potential on food products and raw materials market, as well as defining further technologies in terms of creating competitive products of the non-resource sector according to the new technological agenda. The suggested methods of evaluation may be of interest to employees of public administration and used in the activities of educational and scientific institutions.
References Assessing export potential of the country in the context of global demand in the world food market
- Balassa B. Trade liberalisation and "revealed" comparative advantage. The Manchester School, 1965, vol. 33, no. 2, pp. 99-123. DOI: 10.1111/j.1467-9957.1965.tb00050.x
- Vollrath T.L. A theoretical evaluation of alternative trade intensity measures of revealed comparative advantage. Review of World Economics, 1991, vol. 127, no. 2, pp. 265-280. DOI: 10.1007/BF02707986
- Amador J., Cabral S., Maria J.R. A simple cross-country index of trade specialization. Open Economies Review, 2011, vol. 22, no. 3, pp. 447-461. DOI: 10.1007/s11079-009-9130-z
- Utkovski Z., Pradier M.F., Stojkoski V, Perez-Cruz F., Kocarev L. Economic complexity unfolded: interpretable model for the productive structure of economies. PLoS ONE, 2018, vol. 13, no. 8. 10.1371/journal. pone.0200822 DOI: 10.1371/journal.pone.0200822
- Bahar D., Rosenow S., Stein E., Wagner R. Export take-offs and acceleration: unpacking cross-sector linkages in the evolution of comparative advantage. World Development, 2019, vol. 117, pp. 48-60. 10.1016/j. worlddev.2018.12.016 DOI: 10.1016/j.worlddev.2018.12.016
- Laosutsan P., Shivakoti G.P., Soni P. Comparative advantage and export potential of Thai vegetable products following the integration into the ASEAN Economic Community. International Food and Agribusiness Management Review, 2017, vol. 20, no. 4, pp. 575-590.
- DOI: 10.22434/IFAMR2016.0029
- Desmarchelier B., Regis P.J., Salike N. Product space and the development of nations: a model of product diversification. Journal of Economic Behavior and Organization, 2018, vol.145, pp. 34-51. 10.1016/j. jebo.2017.10.020
- DOI: 10.1016/j.jebo.2017.10.020
- Green R.T., Allaway A.W. Identification of export opportunities: a shift-share approach. The Journal of Marketing, 1985, vol. 49, pp. 83-88.
- Jaud M., Kukenova M., Strieborny M. Financial development and sustainable exports: evidence from firm product data. The World Economy, 2015, vol. 38 (7), pp. 1090-1114.
- Lall S., Weiss J., Zhang J. The "sophistication" of exports: a new trade measure. World Development, 2006, vol. 34 (2), pp. 222-237.
- Hausmann R., Klinger B. Structural Transformation and Patterns of Comparative Advantage in the Product Space. Research Working Paper RWP06-041. John F. Kennedy School of Government, Harvard University, 2006.
- Hausmann R., Klinger B. The structure of the product space and the evolution of comparative advantage. CID Working Papers, 2007, no. 146.
- Hausmann R., Hwang J., Rodrik D. What you export matters. Journal of Economic Growth, 2007, vol. 12 (1), pp. 1-25.
- Kaukin A., Freinkman L. Structure and productivity of Russian export. Ekonomicheskaya politika=Economic Policy, 2009, no. 5, pp. 99-117. (In Russian).
- Gnidchenko A. Improving methods for assessing the structure and base of export potential at the cost of export diversification. Zhurnal Novoi ekonomicheskoi assotsiatsii=The Journal of the New Economic Association, 2014, no. 1, pp. 83-109. (In Russian).
- Yaklai P., Suwunnamek O., Srinuan C. How intellectual capital, knowledge management, and the business environment affect Thailand’s food industry innovation. Asia-Pacific Social Science Review, 2018, vol.18, no. 3, pp. 30-42.
- Revenko L.S. Usage of foreign experience in the promotion of agricultural products to foreign markets for the formation of the Russian export strategy. Vestnik MGIMO - Universiteta= The MGIMO Review of International Relations, 2017, no. 1 (52), pp. 212-226. (In Russian).
- Panteleeva O.I. Export of agricultural products: can Russia become one of the leading exporters in the world? Srednerusskii vestnik obshchestvennykh nauk=Central Russian Journal of Social Sciences, 2018, vol. 13, no. 3, pp. 118-136. (In Russian).
- Gulin K.A., Yakushev N.O., Mazilov E.A. Promoting economic growth in regions of the Russian Federation by boosting the development of non-resource-based exports. Ekonomicheskie i sotsial'nye peremeny: fakty, tendentsii, prognoz=Economic and Social Changes: Facts, Trends, Forecast, 2018, vol. 11, no. 3, pp. 57-70. (In Russian).
- DOI: 10.15838/esc.2018.3.57.4
- FAOSTAT. The Food and Agriculture Organization of the United Nations. Website. Available at: http://faostat.fao.org/beta/en/#data, свободный.
- Suvorov R.E., Devyatkin D.A., Usenko N.I., Otmakhova Yu.S. Overview of identification of export potential growth points using data mining. Trudy Instituta sistemnogo analiza rossiyskoy akademii nauk=Proceeding of the Institute for Systems Analysis of the Russian Academy of Science, 2017, vol. 67, no. 3, pp. 75-85. (In Russian).
- Eremchenko O.A. Technological barriers of increasing the export potential of the Russian grain industry. Ekonomika nauki=The Economics of Science, 2017, no. 3, pp. 40-52. (In Russian).
- Khlestkina E.K., Pshenichnikova T.A., Usenko N.I., Otmakhova Yu.S. Promising opportunities for the use of molecular genetic approaches to control the technological properties of wheat grain in the context of the chain "grain-flour-bread". Vavilovskii zhurnal genetiki i selektsii=Vavilov Journal of Genetics and Breeding, 2016, no. 20(4), pp. 511-527. (In Russian).
- DOI: 10.18699/VJ15.140
- Usenko N.I., Khlestkina E.К., Asavasanti S., Gordeeva E.I., Yudina R.S., Otmakhova Y.S. Possibilities of enriching food products with anthocyanins by using new forms of cereals. Food and Raw Materials, 2018, vol. 6, no. 1, pp. 128-135.
- DOI: 10.21603/2308-4057-2018-1-128-135
- Chotimarkorn C., Benjakul S., Silalai N. Antioxidant components and properties of five long-grained rice bran extracts from commercial available cultivars in Thailand. Food Chemistry, 2008, vol.111, no. 3, pp. 636-641.
- DOI: 10.1016/j.foodchem.2008.04.031
- Jung D., Lee F., Eun J. Quality properties of bread made of wheat flour and black rice flour. Korean Journal of Food Science and Technology, 2002, vol. 34, no. 2, pp. 232-237.
- Sompong R., Siebenhandl-Ehn S., Linsberger-Martin G., Berghofer E. Physicochemical and antioxidative properties of red and black rice varieties from Thailand, China and Sri Lanka. Food Chemistry, 2011, vol. 124, no. 1, pp. 132-140.
- DOI: 10.1016/j.foodchem.2010.05.115
- Kushwaha U.K.S. Black Rice: Research, History and Development. Switzerland: Springer International Publ., 2016. 192 p.
- DOI: 10.1007/978-3-319-30153-2
- Khlestkina E.K., Usenko N.I., Gordeeva E.I., Stabrovskaya O.I., Sharfunova I.B., Otmakhova Y.S. Evaluation of wheat products with high flavonoid content: Justification of importance of marker-assisted development and production of flavonoid-rich wheat cultivars. Vavilovskii Zhurnal Genetiki i Selektsii, no. 21 (5), pp. 545-553. (In Russian).
- DOI: 10.18699/VJ17.25-o
- Revenko L.S. Modern agri-food crisis: characteristics and features of development. Rossiiskii vneshneekonomicheskii vestnik= Russian Foreign Economic Bulletin, 2010, no. 1, pp. 3-8. (In Russian).
- Usenko N.I., Otmakhova Yu.S., Poznyakovskii V.M. Structural and qualitative transformations in the Russian food market, Novosibirsk State University, Novosibirsk: NSU, 2018. 184 p. (In Russian).
- Trakulvichean S., Chaiprasert P., Otmakhova J., Songkasiri W. Comparison of fermented animal feed and mushroo m growth media as two value-added options for waste cassava pulp management. Waste Management & Research, 2017, vol. 35, no. 12, pp. 1210-1219.
- DOI: 10.1177/0734242X17730135
- Trakulvichean S., Chaiprasert P., Otmakhova J., Songkasiri W. Integrated economic and environmental assessment of biogas and bioethanol production from cassava cellulosic waste. Waste and Biomass Valorization, 2019, vol. 10, no. 3, pp. 691-700.
- DOI: 10.1007/s12649-017-0076-x
