Assessing federal transfers' role in the subnational budget system of the Russian Federation

Author: Kolomak Evgeniya A., Sumskaya Tatyana V.
Journal: Economic and Social Changes: Facts, Trends, Forecast @volnc-esc-en
Section: Public finance
Article in issue: 2 т.13, 2020.
Free access
Subfederal authorities' financial independence is an essential condition for their effective functioning. Currently, in Russia, the procedure of inter-budgetary regulation is excessively centralized, and the share of transfers in the structure of regional revenues is high. At the same time, subfederal budgets arethebasiclevelofthebudgetsystem, whichconcentratesthemainpartofsociallysignificantexpenditures. In this regard, the development of a comprehensive tool for the empirical analysis of tax revenues and the effectiveness of inter-budget transfers, undertaken in the study, seems relevant. The purpose of the research is to develop an economic and statistical apparatus for assessing the results of transferring inter-budget transfers from the federal budget to the constituent entities of the Federation. Achieving this goal required to: consider the features of the structure of budget revenues in the regions; determine the scale of the territories' budget revenues heterogeneity, and give its quantitative assessment; identify the directions of the federal center's transfer policy; find out the nature of gratuitous transfers impact on the regional budgets. The novelty of the presented work is the creation of an economic and statistical apparatus for the study of the impact of federal budget policy on the region's public finance. This allowed us to characterize gratuitous transfers from the federal budget to the regions and determine whether there is a motivation to increase tax revenues in the Russian Federation's subjects or not. It is concluded that improving inter-budgetary relations should include measures to strengthen the Russian regions' tax potential, which is impossible if the stability of securing tax revenues is not ensured. Authorities need measures to prevent a direct correlation between actual and projected budget revenues and expenditures and the volume of transfers received from the federal budget to equalize budget security. The results of the research can be used to study the possibilities of improving budget policy in the direction of equalizing and stimulating the regions to strengthen their own revenue base.
Transfers, income received, disposable income, heterogeneity, empirical analysis, regional budget, interbudgetary relations
Short address: https://sciup.org/147225456
IDR: 147225456 | UDC: 332.14+336.14 | DOI: 10.15838/esc.2020.2.68.6
Text of the scientific article Assessing federal transfers' role in the subnational budget system of the Russian Federation
All states with a federal form of government use vertical inter-budget redistributions and transfers to lower-level budgets. There are two main reasons for the fact that the accumulated funds of the central government exceed their direct expenditures. First, the shift of income in favor of the central government is supported by the very principles of revenue and expenditure powers distribution between the levels of government, which are considered in the theory of public finance [1–4]. A multi-level system of budget services allows taking into account the characteristics of various types of public goods. Public services should be provided by the central government if 1) public goods of federal importance are more effectively provided centrally; 2) public services create positive effects and spread to other territories, in this case the lower level of government underestimates their effectiveness and provides less than socially optimal amounts; 3) the mobility of important production factors makes it possible for lower-level governments to export local problems or import the advantages of other territories; 4) there is a need to ensure universal equality in the provision of public income, heterogeneity, empirical analysis, regional services. There are three arguments in favor of decentralized public service delivery. The first is related to the population’s heterogeneity and the difference in preferences regarding the number and ratio of benefits provided [5; 6]. The second argument is the proximity of local governments to the population, as a result, lower information barriers and a better understanding of the preferences and needs of the population of a particular territory [7]. The third argument is that it is possible to reduce the costs of political experimentation; individual territories are considered as laboratories for adapting new methods or approaches to state regulation [8].
The distribution of tax instruments of state regulation between the levels of government is based on the fact that the tax policy of lower-level governments can create external effects including three main categories: export of taxes, unhealthy tax competition for a mobile tax base, and excessive or insufficient taxation of activities that generate external effects. To prevent the taxes export, local taxes should be linked to the territory, i.e. the place of residence or production activity [9; 10]. Tax competition between territories does not develop if the tax base of the lower level of government is not mobile [11; 12]. Finally, local taxes should not be applied to the areas where the costs are spatially localized, while the benefits extend beyond the territory, or, on the contrary, the costs are geographically distributed, and the benefits are concentrated in a single territory.
Thus, spatial diversity, reduced management and experimentation costs shift spending authority to the lower management level. At the same time, increasing mobility of factors and development results leads to an expansion of the sphere of external effects and increased spatial competition, which contributes to the reduction of the lower level tax powers and their increase in case of the central government. The resulting gap between the expenditure commitments and revenue sources is financed through a system of transfers, mandates, and grants from the central government.
The second main reason for vertical transfers is the budgetary inequality of the constituent entities of the Federation and the need to finance state-guaranteed budget goods and services. In federations, the problem of inter-regional differences due to the threat of separatism is more acute than in unitary states, the quality and quantity of budget services to the population cannot differ significantly by territory. But with comparable spending commitments, the regions have very different revenue potentials. These gaps are partially offset by the central government transfers. Russia’s heterogeneity in all parameters of economic and social status is noted in many studies on the spatial aspects of the country’s development. The need to reduce inter-regional differentiation, along with the examples of subfederal authorities’ failed experiments at the beginning of market reforms, is the main argument used to justify the high centralization of public finances and large-scale inter-budgetary redistributions in the country.
The topic of policy in relation to subfederal budgets and horizontal transfers is constantly present in foreign and domestic scientific discussions. The issue of the validity of the revenue powers, expenditure obligations and transfers distribution has no formal solution, since it is influenced not only by economic, but also the political priorities [13]. Federal states differ significantly in the level of centralization of budget revenues and expenditures, as well as in the mechanisms and principles of transfer distribution [14–16]. Young federations, developing countries and transition economies demonstrate a relatively high level of budget revenues centralization and increased use of vertical transfers.
In the Russian literature, the discussion of various aspects of the problem of inter-budgetary redistributions has been going on since the beginning of political and economic reforms in the country. The issues of the theory of federal relations and their implementation in Russia has been considered [17–22]. Some of the proposals made by the authors have found application in the practice of horizontal financial relations, the principle of combining the levelling and stimulating functions of transfers to regions, the allocation of a target and non-target component in them is fixed in the Budget code of the Russian Federation. But the discussions focused on tax and spending powers of different levels [23–25], the distribution of obligations between the levels of government in the Russian Federation [26–28], types and sizes of inter-budget redistributions [29], legal and methodological problems of transfers allocation [30–34] continue. The reform of inter-budgetary relations is considered through the prism of efficiency [35–38], structural regional policy and stimulating economic growth [39–40]. The impact of financial support mechanisms on management decisions and institutional reforms in the regions is analyzed [41]. However, publications rarely provide detailed empirical analysis of budget statistics as a justification. The present paper shows various methods for analyzing subfederal budget security and the contribution of transfers, demonstrating the dependence of the obtained conclusions on the methods of working with the sample at the same time.
We offer a detailed empirical analysis of the subfederal budgets’ security before and after transfers from the Federal center, while evaluating the result of horizontal redistributions. The resulting conclusions may depend on the methods of analysis. The applied approach was used in the analysis of the municipal budgets [42]. The research was based on the reports on the execution of budgets of the constituent entities of the Russian Federation, presented on the website of the Treasury of Russia for the period of 2012– 2018. The specified seven-year period is taken for analysis, since it is interesting to consider the dynamics of budget provision in the regions of the Russian Federation, to trace the changes related to the crisis and the sanctions imposed in 2014–2015.
The role of inter-budget transfers in the regional budget system
The main revenue items of subfederal budgets are tax revenues, non-tax revenues and gratuitous receipts, most of which are the transfers from the Federal budget. The level of independence of subfederal budgets can be characterized by the share of tax and nontax revenues in the total budget income of the constituent entities of the Federation. They are commonly referred to as earned income. The distribution of the regions of the Russian Federation by the share of tax and non-tax revenues in the total revenues of their budgets is shown in table 1 .
In most regions, the share of income received is in the range of 60-90%, with a modal range of 80–90%. As a positive change in the period under review, we can note, first, a reduction in the number of regions with a share of revenue received less than 60% of the total budget: in 2012, there were 23 regions, in 2018 there were 19. Secondly, the number of Federal subjects with a level of budget independence greater than 80% is increasing, from 29 in 2012 to 40 in 2016–2017, with a decrease (to 34) in 2018. Finally, there is a slight reduction in inter-regional differences, the range of variation in 2012–2016 was over 80%, and in 2018 the difference between the maximum and minimum values decreased to 77%.
Table 1. Distribution of the regions by the share of the incomes received
|
Interval of the incomes share, % |
Number of the regions in groups |
||||||
|
2012 |
2013 |
2014 |
2015 |
2016 |
2017 |
2018 |
|
|
10–20 |
2 |
2 |
3 |
2 |
1 |
2 |
0 |
|
20–30 |
4 |
2 |
4 |
2 |
3 |
1 |
3 |
|
30–40 |
1 |
4 |
2 |
5 |
3 |
6 |
8 |
|
40–50 |
6 |
5 |
4 |
2 |
4 |
3 |
2 |
|
50–60 |
10 |
10 |
11 |
10 |
7 |
5 |
6 |
|
60–70 |
13 |
9 |
11 |
14 |
12 |
16 |
16 |
|
70–80 |
18 |
19 |
17 |
14 |
15 |
12 |
16 |
|
80–90 |
26 |
29 |
28 |
26 |
29 |
29 |
23 |
|
90–100 |
3 |
3 |
5 |
10 |
11 |
11 |
11 |
|
Source: authors’ calculations. |
|||||||
Negative phenomena include the absence of Federal subjects whose budgets do not depend on gratuitous transfers, and the preservation of a large number of regions that do not have a stable revenue budget base of their own. As a result, any long-term plans for socio-economic development presented by the regional governments are not provided with guaranteed resources in a large part of the country.
In these conditions, the transfers from the Federal budget are an important resource for the subfederal finance. The regions’ dependence on gratuitous transfers differs significantly. The distribution of the share of transfers in the total budget revenues of the Federal subjects is shown in table 2.
The share of gratuitous transfers from the Federal budget for most regions is in the range from 10 to 40%, the modal range for the entire period under review is 10-20%. It should be noted that every year there is an increase in the number of regions with a decreasing share of transfers in their budgets. If in 2012 the share of transfers in total budget revenues in thirty regions of the Federation was less than 20%, in 2017 the number of such regions was 42 already.
But there are territories where budget revenues from the Federal center play a significant role. Thus, in 2014, the share of transfers from the Federal center in 13 regions was more than 50%, while in the remaining years of the period under review, there were 11 such regions.
The situation when central government transfers play a crucial role in the budget of the Federal subjects cannot be called normal for a state declaring the principle of budget federalism. This indicates an overestimated centralization degree of financial resources in Russia. They try to justify this situation by solving important national and geopolitical problems that require the concentration of resources. The arguments about the need to smooth out significant inter-regional differences in order to preserve the state’s unity are made. However, even taking into account the really large internal heterogeneity of the country, it is difficult to find an explanation for the fact that all the constituent entities of the Russian Federation receive support from the Federal center, while the formation of the Federal budget is carried out at the expense of the same regions’ economic activities.
Estimation methods of the results of the Federal center’s transfer policy in the Russian Federation
The concentration of financial resources in the center and large-scale horizontal transfers are explained by the need to equalize the budget security and socio-economic development
Table 2. Distribution of the regions by the share of gratuitous transfers from the Federal budget
|
Interval of the transfers share, % |
Number of the regions in groups |
||||||
|
2012 |
2013 |
2014 |
2015 |
2016 |
2017 |
2018 |
|
|
0–10 |
5 |
6 |
7 |
11 |
14 |
13 |
11 |
|
10–20 |
25 |
26 |
26 |
25 |
29 |
29 |
23 |
|
20–30 |
18 |
20 |
18 |
17 |
14 |
13 |
18 |
|
30–40 |
15 |
8 |
12 |
12 |
13 |
13 |
15 |
|
40–50 |
9 |
12 |
9 |
9 |
4 |
6 |
6 |
|
50–60 |
5 |
4 |
4 |
2 |
4 |
3 |
3 |
|
60–70 |
2 |
2 |
2 |
5 |
4 |
5 |
6 |
|
70–80 |
3 |
3 |
4 |
2 |
2 |
1 |
2 |
|
80–90 |
2 |
2 |
3 |
2 |
1 |
2 |
1 |
|
Source: authors’ calculations. |
|||||||
of the constituent entities of the Russian
Federation. In order to assess the degree of this goal implementation, it is interesting to compare the characteristics of dispersion and heterogeneity before and after the receipt of gratuitous transfers from the Federal budget.
A number of statistical characteristics are used to identify the scale of heterogeneity, including the extent of asymmetry, standard deviation, and coefficient of variation. The properties of these indicators differ, so to confirm the stability of conclusions several indicators are used.
The extent of the asymmetry ( W ) evaluates the inequality in terms of the ratio of the maximum to the minimum value of the indicator, i.e.
w =
Xmax X-min
The standard deviation ( M ) is one of the most popular characteristics of the variation. it is calculated using the formula:
M = ^=1№ - X) 2 , (2)
where ^ — value of the indicator of the i -th region,
X — average value of the indicator for all regions.
The value of the standard deviation depends on absolute levels of the indicators, and the switching to other units of measurement or to a different level of values (for example, as a result of inflation) affects quantitative estimates of heterogeneity. The coefficient of variation ( V ) is calculated by dividing the standard deviation by the average value, and the result is multiplied by 100%. It allows to compare heterogeneity in samples with different metrics and scales of indicators:
M
V = — • 100%. (3)
The indicators of variation should decrease with the increase of homogeneity in the sample.
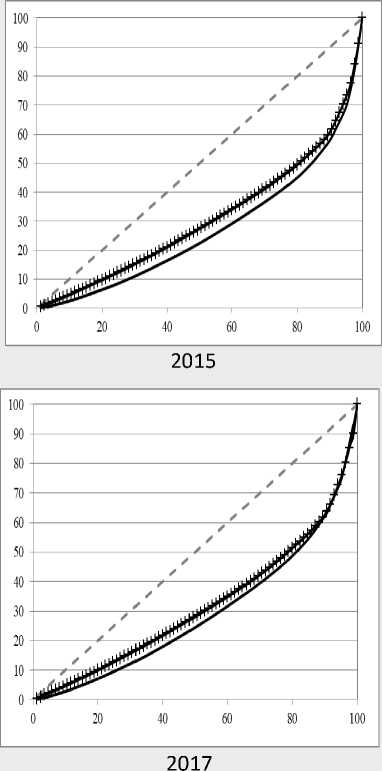
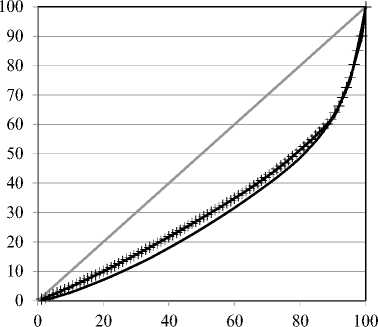
The indicators of variation provide an aggregated estimate of the degree of heterogeneity. To answer the question which groups of regions were recipients of gratuitous transfers, it is necessary to compare the distribution of the regions’ budget revenues before and after receiving transfers from the Federal budget. If transfers are received by the majority of Russian regions, then it makes sense to calculate a similar distribution of centered values of the received and available budget revenues. It is advisable to use Lorentz curves to visualize changes (increase or decrease) in the interterritorial differentiation by the indicators under consideration.
A quantitative assessment of the differentiation level by income is given by the Gini index and the coefficient of funds. The Gini index measures the area between the line of absolute equality and the Lorentz curve and characterizes the distribution of income across all groups of regions. It shows the direction of the mechanism for distributing Federal financial assistance: either the distribution of budget revenues is somewhat uniform among the constituent entities of the Russian Federation, or a small number of regions receive more transfers from the Federal budget. The higher the Gini index value, the greater the differentiation between regions. The coefficient of funds is used to study the inequality between polar groups of regions. It is calculated by the ratio of total revenues received by 10% of the Federal subjects with the highest budget revenues to the revenues of 10% of the regions with the lowest budget revenues.
In order to understand how the current system of inter-budgetary relations is justified and effective, the methods of correlation and regression analysis are also used. It is obvious that a normal system of inter-budgetary regulation should not allow abrupt changes in the territories’ comparative positions, and such a policy cannot arouse support in society. The Spearman or Kendall rank correlation coefficients are calculated to test the reasonableness of the size and flow of interbudget redistributions. The regions are ranked first by the level of income received, then by the level of disposable budget income, and then the correlation of the obtained series of ranks is estimated. If the ordered positions of the regions remain unchanged, the correlation coefficient between the ranks in terms of income received and the ranks in terms of disposable income should be equal to 1.
To calculate Spearman’s rank correlation coefficient , each value of the two studied data series is assigned a rank, then the rank differences d are determined. The Spearman coefficient is calculated as follows:
р = 1
6 Ed2 n(n2 — 1) ,
where Ed2 is the value of the sum of squares of rank differences, n is number of paired observations.
The Kendall rank correlation coefficient is recommended when there are outlying observations. The values of the first indicator (X) are sorted in ascending order, then each value is assigned a certain rank. Then the values of the second indicator (Y) are ordered and numbered in the same way. As a result, the correlation coefficient is calculated as follows:
2S
T n(n - 1) , (5)
where S = P – Q, P is the total number of observations that are behind the current observations with a higher rank value Y;
Q is the total number of observations that are behind the current observations with a lower Y rank.
The role of the goals of smoothing interregional differentiation by budget security in transfer policy can be estimated by means of regression analysis. To verify this statement, it is interesting to assess the dependence of the average per capita gratuitous transfers sent to the regional budgets from the Federal budget on the tax and non-tax revenues of the budgets of the subjects of the Federation per capita. If the policy of Federal transfers distribution is aimed at equalizing the regional budget revenues per capita, then there must be a statistically significant negative relationship. If the transfers do not depend on the current value of the regional budget revenues per capita, the relationship will be statistically insignificant. If the relatively well-off regions receive the transfers, the link should be positive. In this aspect, it is proposed to evaluate the following equation :
InT t = a + p • In R i + £ t , (6)
where Ti is the transfers from the Federal budget to the ith subject of the Federation per capita, adjusted for the coefficient of regional price increases 1 ;
Ri is the amount of tax and non-tax income per capita of the ith subject of the Federation, adjusted for the coefficient of regional price increases.
The issue of the disincentive effect of large-scale interregional redistributions has been repeatedly raised in the literature. It was suggested that significant Federal intervention creates dependency attitudes in recipient regions, while donor regions are less motivated to develop the territory’s tax base. The presence and direction of incentives for the development of the region’s economic potential can be estimated by the marginal effect of increasing the revenues of the subject of the Federation. Moreover, it makes sense to be limited to considering only tax revenues to the regional budgets, since they reflect economic activity in a greater degree. Thus, it is interesting to assess the dependence of changes in disposable income including transfers on changes in tax revenues to the regional budget:
(X it - Ytt-1 ) = Y + ^ (X it - X tt—1) + Ett , (7)
where Yit is the disposable income of the ith Federal subject in year t ;
Xit is tax income of the ith Federal subject in year t 2 .
Assessment of changes characterizes the work of the institutional mechanism and the incentives being formed. If changes in budget revenues are mainly determined by transfers, tax revenues are not a significant factor in the regional policy, and the incentives to develop economic activity in the territory are not formed. Thus, in the absence of the above incentives, the angular coefficient – in the regression equation should be insignificant. The statistical significance and positivity of this coefficient will indicate that the regions of the Russian Federation do not lose incentives to develop the economic potential of the territory and, as a result, to increase the tax revenues accumulated on the territory of the region.
The regression equation estimated marginal effect of not all taxes payable to the budgets of constituent entities of the Federation, only the basic ones such as tax on profit of organizations, tax on individual income and property taxes were taken into account. On average, these tax revenues provide about 80% of total revenues to the regional budgets from all types of taxes.
Efficiency of inter-budget transfers is a complex concept. This includes, first, the focus of transfers on equalizing the budget security of the Russian Federation’s subjects. Second, the transfer policy should not deprive the regions of the incentives to increase their own tax potential. And, third, the system of inter-budgetary regulation should not allow abrupt changes in the comparative positions of territories before and after transfers.
Assessment of achievement the goals for reducing interregional differences
To study the success of inter-budget redistributions from the point of view of equalizing the regions’ budget security, we compared the indicators of variation for the received and disposable incomes of the subjects of the Russian Federation per capita, i.e. for the regions’ budget revenues before and after receiving transfers ( Table 3 ).
Table 3. Indicators of heterogeneity in the level of budget income per capita
|
Indicator |
Received income |
||||||
|
2012 |
2013 |
2014 |
2015 |
2016 |
2017 |
2018 |
|
|
Asymmetry scope |
45.3 |
44.3 |
48.1 |
56.4 |
40.0 |
47.5 |
47.9 |
|
Standard deviation |
46.5 |
48.7 |
57.1 |
73.5 |
62.3 |
66.1 |
76.5 |
|
Coefficient of variation, % |
104.6 |
105.4 |
113.8 |
131.3 |
108.3 |
108.6 |
110.0 |
|
Disposable income |
|||||||
|
2012 |
2013 |
2014 |
2015 |
2016 |
2017 |
2018 |
|
|
Asymmetry scope |
13.3 |
13.1 |
14.8 |
18.7 |
20.5 |
18.1 |
18.8 |
|
Standard deviation |
59.1 |
62.6 |
75.2 |
75.6 |
87.0 |
89.1 |
106.8 |
|
Coefficient of variation, % |
93.2 |
95.4 |
104.5 |
116.6 |
110.9 |
106.6 |
109.1 |
|
Source: authors’ calculations. |
|||||||
2 The transition to the logarithms of variables and to the interpretation of coefficients in terms of elasticity was impossible due to the fact that there are negative values of variables.
From the above data, it can be seen that the asymmetry scope between the subjects of the Russian Federation after the transfer of funds from the Federal budget is reduced 2–3.4 times. The most significant reduction in the scope of asymmetry was observed in 2012–2014. Consequently, thanks to the transfers, the gaps between the poorest and wealthiest regions are significantly reduced.
The standard deviation of the regions’ budget provision by the disposable income exceeds the same indicator for the received income. However, this is largely due to the growth of absolute budget revenues due to the transfers. The most significant increase in the standard deviation occurred in 2016 and 2018 (by 40%). The standard deviation increased the least in 2015 (by only 3%). The standard deviation increases as the values of all the sample elements increase.
The coefficient of variation partly solves the problem of the influence of different levels of values in the sample; it is calculated as the ratio of the standard deviation to the average value. This allows to exclude the impact of different absolute levels of budget revenue before and after transfers. Calculations show that in 2012–2015, 2017 and 2018 the heterogeneity of revenues of subfederal budgets in the Russian Federation after transfers from the Federal budget has decreased, as evidenced by the lower value of the coefficient of variation for the indicator of total (disposable) income compared to the value of this coefficient for the received (tax and nontax) income. However, in 2016, the coefficient of variation in budget security increased after transfers to the regions, as a consequence, they didn’t manage to achieve even relative alignment that year. We should also note a very slight decrease in the coefficient of variation in the last two years of the period under review.
To identify the groups of regions that were the main recipients of gratuitous transfers, it seems appropriate to compare the territories’ budget revenues before and after receiving transfers from the Federal budget. The distribution of the subjects of the Russian Federation by the amount of tax and non-tax (received) income, as well as by the amount of total (disposable) income is shown in table 4.
Table 4. Distribution of the regions by the amount of the received and disposable income
|
Per capita income, thousand rubles |
Number of the regions included in the group |
|||||||||||||
|
2012 |
2013 |
2014 |
2015 |
2016 |
2017 |
2018 |
||||||||
|
RI |
DI |
RI |
DI |
RI |
DI |
RI |
DI |
RI |
DI |
RI |
DI |
RI |
DI |
|
|
0–10 |
3 |
0 |
3 |
0 |
3 |
0 |
3 |
0 |
1 |
0 |
1 |
0 |
0 |
0 |
|
10–20 |
9 |
0 |
7 |
0 |
6 |
0 |
7 |
0 |
7 |
0 |
4 |
0 |
5 |
0 |
|
20–30 |
29 |
2 |
23 |
1 |
24 |
0 |
18 |
0 |
15 |
0 |
14 |
0 |
9 |
0 |
|
30–40 |
18 |
32 |
22 |
27 |
22 |
22 |
24 |
16 |
21 |
10 |
19 |
4 |
16 |
1 |
|
40–50 |
8 |
19 |
12 |
28 |
12 |
27 |
13 |
28 |
18 |
27 |
20 |
26 |
16 |
10 |
|
50–60 |
4 |
11 |
3 |
6 |
3 |
11 |
4 |
17 |
5 |
19 |
9 |
20 |
13 |
28 |
|
60–70 |
3 |
7 |
3 |
4 |
4 |
9 |
3 |
7 |
3 |
8 |
3 |
10 |
7 |
12 |
|
70–80 |
0 |
2 |
1 |
4 |
2 |
4 |
2 |
5 |
3 |
7 |
2 |
6 |
3 |
6 |
|
80–90 |
1 |
0 |
2 |
2 |
0 |
1 |
2 |
2 |
2 |
2 |
1 |
5 |
3 |
8 |
|
90–100 |
1 |
0 |
1 |
2 |
0 |
1 |
1 |
0 |
2 |
3 |
3 |
3 |
1 |
6 |
|
100–150 |
4 |
4 |
2 |
2 |
5 |
2 |
3 |
2 |
3 |
1 |
3 |
3 |
4 |
4 |
|
150–200 |
0 |
3 |
1 |
4 |
0 |
4 |
1 |
3 |
1 |
1 |
2 |
1 |
4 |
3 |
|
More than 200 |
3 |
3 |
3 |
3 |
4 |
4 |
4 |
5 |
4 |
7 |
4 |
7 |
4 |
7 |
|
RI – received income; DI – disposable income. Source: authors’ calculations. |
||||||||||||||
The table shows that gratuitous receipts from the Federal budget significantly increase the budget security of low-income subjects of the Russian Federation. Thus, after transfers in 2012 and 2013, the number of the regions with per capita budget revenues less than 30 thousand rubles decreased significantly, and in 2014–2018 there were none of them. Before the receipt of funds from the Federal budget to the subjects of the Federation, the modal interval for per capita income was from 20 to 30 thousand rubles in 2012–2014, from 30 to 40 thousand rubles in 2015–2016, and from 40 to 50 thousand rubles in 2017 and 2018. After transfers from the Federal budget to the regions, the modal interval for 2012 was from 30 to 40 thousand rubles, in 2013–2017 from 40 to 50 thousand rubles, in 2018 from 50 to 60 thousand rubles. In 2017, the modal interval did not change after the receipt of gratuitous transfers to the regional budgets, but the number of regions where the disposable income per capita exceeded 50 thousand rubles significantly increased.
In general, during the period under review, for most regions, per capita income was in the range of 20–50 thousand rubles before the gratuitous transfers, and in the range of 30–70 thousand rubles after receiving the transfers to the regional budgets. Thus, we can talk about a significant increase in the absolute and relative amount of funds in the regional revenues received as a result of budget regulation.
In order to exclude the impact of an increase in the average value of the regional budgets’ revenues after transfers from the Federal budget, it is useful to assess the distribution of tax and non-tax (received) revenues and total (disposable) revenues of the budgets of the subjects of the Russian Federation, normalized relative to their average level (RIN and DIN) ( Table 5 ).
Table 5. Distribution of the regions by the value of indicators of the received and disposable income normalized relative to the average value
|
Per capita income, thousand rubles |
Number of the regions included in the group |
|||||||||||||
|
2012 |
2013 |
2014 |
2015 |
2016 |
2017 |
2018 |
||||||||
|
ОС |
2 о |
2 ОС |
2 о |
2 ОС |
2 о |
2 ОС |
2 о |
г ОС |
о |
ОС |
о |
ОС |
о |
|
|
Less than -30 |
7 |
10 |
7 |
9 |
9 |
29 |
21 |
31 |
18 |
33 |
22 |
37 |
30 |
49 |
|
-30 – -20 |
17 |
28 |
18 |
37 |
24 |
25 |
22 |
28 |
22 |
21 |
18 |
18 |
16 |
8 |
|
-20 – -10 |
24 |
21 |
27 |
16 |
22 |
6 |
20 |
6 |
20 |
9 |
18 |
7 |
13 |
5 |
|
-10 – 0 |
17 |
6 |
13 |
3 |
12 |
9 |
6 |
6 |
7 |
7 |
9 |
7 |
7 |
9 |
|
0–10 |
5 |
6 |
4 |
4 |
3 |
4 |
2 |
2 |
2 |
3 |
3 |
2 |
3 |
0 |
|
10–20 |
2 |
2 |
4 |
3 |
4 |
1 |
2 |
2 |
4 |
3 |
2 |
3 |
3 |
3 |
|
20–30 |
2 |
0 |
1 |
2 |
2 |
1 |
3 |
1 |
2 |
0 |
2 |
2 |
1 |
1 |
|
30–40 |
0 |
0 |
2 |
0 |
0 |
0 |
0 |
0 |
2 |
0 |
2 |
0 |
3 |
0 |
|
40–50 |
1 |
0 |
0 |
0 |
0 |
1 |
1 |
0 |
0 |
0 |
1 |
0 |
0 |
0 |
|
50–60 |
1 |
0 |
1 |
2 |
3 |
1 |
0 |
0 |
0 |
0 |
0 |
1 |
0 |
1 |
|
60–70 |
4 |
3 |
0 |
0 |
0 |
0 |
1 |
1 |
0 |
0 |
0 |
0 |
0 |
0 |
|
70–80 |
1 |
0 |
2 |
0 |
1 |
0 |
2 |
0 |
1 |
2 |
1 |
0 |
1 |
0 |
|
80–90 |
1 |
1 |
0 |
0 |
0 |
1 |
0 |
0 |
2 |
0 |
1 |
1 |
0 |
0 |
|
90–100 |
1 |
1 |
0 |
1 |
1 |
0 |
0 |
1 |
0 |
0 |
1 |
0 |
0 |
2 |
|
100–150 |
0 |
2 |
1 |
3 |
0 |
3 |
1 |
3 |
1 |
2 |
1 |
1 |
4 |
0 |
|
150–200 |
2 |
1 |
1 |
1 |
2 |
0 |
1 |
1 |
0 |
1 |
1 |
3 |
0 |
3 |
|
More than 200 |
1 |
2 |
2 |
2 |
2 |
4 |
3 |
3 |
4 |
4 |
3 |
3 |
4 |
4 |
RIN – received income normalized relative to the average value; DIN - disposable income normalized relative to the average value. Source: authors ‘ calculations.
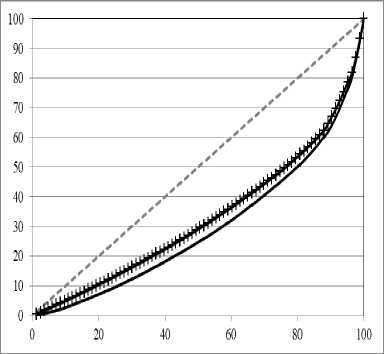
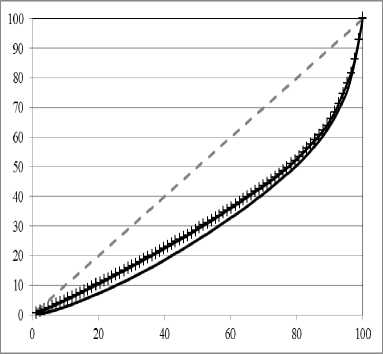
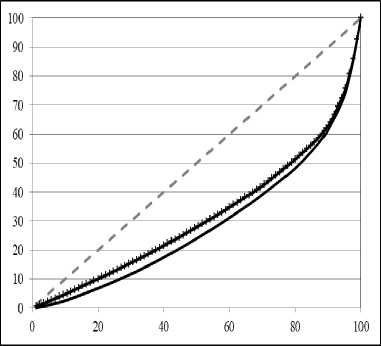
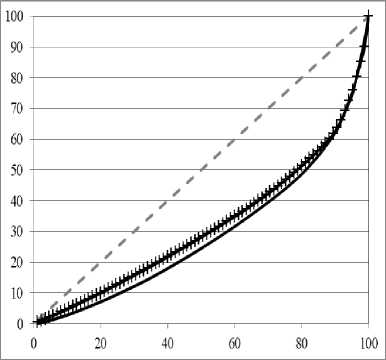
Lorentz curves for interregional distribution of budget revenues per capita before (-) and after gratuitous transfers (+).
Source: authors’ calculations.
Taking into account the fact that transfers from the Federal budget are sent to almost all constituent entities of the Federation, which leads to an increase in the regions’ budget security, the results of transfers from the center seem less appropriate. As follows from the data in the table, both the number of regions with incomes significantly higher than the average value and the number of regions with the lowest budget incomes increases during the entire period under review. Special attention should be paid to the distribution of the disposable income values normalized relative to the average level, i.e., the income of the subjects of the Federation after the transfer of funds from the Federal budget. The group of the regions with a normalized disposable income from 20 to 70 thousand rubles per capita was the smallest, compared to the high-income and low-income groups.
Changes in the distribution of budget revenues as a result of horizontal transfers can be shown using Lorentz curves, comparing the graphs of the received and disposable budget revenues (Figure). The pre-transfer budget revenue distribution curve is further from the absolute equality line than the post-transfer revenue distribution curve. Consequently, interregional differentiation was decreasing throughout the years of the period under review as a result of gratuitous transfers. However, if we take into account the scale of inter-budgetary redistributions in the country, the achieved differentiation decrease can be estimated as very modest.
To quantify the level of differentiation by the regional budget revenues, the Gini index and the coefficient of funds were calculated. The values of these indicators are calculated for tax and non-tax (received) and total (disposable) revenues of the budgets of the constituent entities of the Russian Federation ( Table 6 ).
Both coefficients decrease after the distribution of transfers indicating the interregional differences’ reducing. However, the equalizing effect decreased over the period on the whole, and the difference between the coefficient values for the received and disposable income decreased significantly. The emphasis on smoothing differentiation was strengthened in 2015, then there was its significant reduction.
Evaluating the objectivity and effectiveness of transfer policy
The results of calculating the Spearman and Kendall rank correlation coefficients
Table 6. The coefficient of funds and Gini index for budget revenues of the constituent entities of the Russian Federation
|
Year |
Coefficient of funds |
Gini index |
||||
|
ш го S |
го с О |
О |
ш го S |
го с О |
||
|
2012 |
14.37 |
6.99 |
7.38 |
40.85 |
34.31 |
6.54 |
|
2013 |
13.73 |
7.11 |
6.62 |
40.23 |
34.74 |
5.49 |
|
2014 |
14.38 |
7.55 |
6.83 |
42.70 |
36.88 |
5.82 |
|
2015 |
16.12 |
8.31 |
7.81 |
45.98 |
38.53 |
7.45 |
|
2016 |
12.90 |
7.68 |
5.22 |
41.75 |
36.81 |
4.94 |
|
2017 |
12.74 |
7.56 |
5.18 |
41.34 |
36.64 |
4.70 |
|
2018 |
13.31 |
7.90 |
5.41 |
42.31 |
37.78 |
4.53 |
|
Source: authors ‘ calculations. |
||||||
Table 7. Spearman and Kendall rank correlation coefficients for the series of received and disposable per capita incomes of the regional budgets
|
Indicator |
2012 |
2013 |
2014 |
2015 |
2016 |
2017 |
2018 |
|
Spearman rank correlation coefficient |
0.74 |
0.77 |
0.71 |
0.75 |
0.77 |
0.79 |
0.79 |
|
Kendall rank correlation coefficient |
0.61 |
0.64 |
0.62 |
0.63 |
0.66 |
0.67 |
0.67 |
|
Source: authors ‘ calculations. |
|||||||
for tax and non-tax (received) and total (disposable) revenues of regional budgets per capita are presented in table 7 . After the regions receive gratuitous transfers, their relative positions (ranks) often change. The correlation coefficients of ranks are rather far from unity, although the positive correlation of ranks was dominant, the regions possessing higher disposable incomes had higher levels of budget revenues received.
To answer the question, if the funds transferred from the Federal budget to the constituent entities of the Russian Federation serve the purposes of balancing their budget sufficiency, ley us estimate the dependence of per capita gratuitous transfers allocated to the regional budgets from the Federal one, from tax and non-tax revenues of the regional budgets per capita.
It should be noted that taking into account the impact of regional rise in price is very important, as it radically changes the regression estimates and conclusions. Without adjusting for higher costs for the individual territories’ sustainment, the angular coefficient (β) turns out to be positive and statistically significant for all years, which leads to the conclusion that more affluent regions receive the funds. The positive correlation of unadjusted values is explained by the fact that the Northern and Eastern regions have higher absolute levels of budget security and are the recipients of large volumes of transfers. This fact largely reflects the high cost of providing budget services and the high unit costs of creating and maintaining social infrastructure in the North and East of the country. The regression estimates results for the adjusted data are shown in table 8.
Estimates of the equation indicate that there is a statistically significant negative relationship between the transfers and the revenues received by the regional budgets. Gratuitous transfers depend on budget security, and there is a tendency to send them to the regions of the Federation with the lowest per capita income received. What stands out however is the low coefficient of determination, the highest value of which reaches 0.19. This suggests that the factors that are not related to the smoothing of the interregional differences in the budget services and functions play a more significant role in the transfer policy.
Table 8. Estimation of the gratuitous transfers’ dependence on the revenues received by the constituent entities of the Federation
|
Coefficient |
2012 |
2013 |
2014 |
2015 |
2016 |
2017 |
2018 |
|
A |
3.596 |
3.822 |
3.870 |
4.049 |
4.076 |
4.576 |
4.284 |
|
(0.419) |
(0.472) |
(0.444) |
(0.399) |
(0.494) |
(0.496) |
(0.476) |
|
|
B |
-0.349 |
-0.424 |
-0.417 |
-0.468 |
-0.470 |
-0.579 |
-0.420 |
|
(0.123) |
(0.136) |
(0.126) |
(0.112) |
(0.135) |
(0.133) |
(0.124) |
|
|
R2 |
0.09 |
0.11 |
0.12 |
0.17 |
0.13 |
0.19 |
0.12 |
Source: authors’ calculations.
Standard coefficient errors are shown in parentheses.
Table 9. Estimation of the disposable income changes dependence on the changes in tax revenues of the constituent entities of the Federation
|
Coefficient |
2013 |
2014 |
2015 |
2016 |
2017 |
2018 |
|
Г |
-1543 (799) |
-2541 (550) |
-3317 (610) |
-184 (542) |
1522 (595) |
3605 (653) |
|
Λ |
1,043 (0,159) |
1,102 (0,063) |
1,218 (0,089) |
1,016 (0,051) |
0,959 (0,062) |
1,028 (0,059) |
|
R2 |
0,35 |
0,79 |
0,70 |
0,83 |
0,75 |
0,79 |
Source: own calculations.
Standard errors of coefficients are given in brackets.
Let us consider the marginal effect of increasing tax revenues received by the budgets of the Russian Federation’s constituent entities in order to identify the regions’ incentives to increase tax revenues accumulated in the respective territories. Since budget revenues have monetary measures, it is necessary to exclude the impact of price changes, otherwise the regression results will reflect the correlation of trends and price indices, rather than the variables being studied. Regional consumer price indices were used to make the data comparable. The obtained estimates3 2 ( Table 9 ) confirm the hypothesis that incentives for the development of the region’s tax base remain, despite large-scale interregional redistributions. The dependence of changes in the total budget revenues on the region’s tax revenues appeared to be positive and statistically significant at a 99% confidence level for all the considered periods. Moreover, the coefficient of regression determination is quite high, and the tax potential of the regions of the Russian Federation plays a decisive role in shaping the territory’s public finances.
-
3 Analysis of the observation cloud revealed a number of outliers, they were related to Moscow for the entire period of observations, to the Tyumen Oblast in 2013 and 2018, to the Sakhalin Oblast and the Republic of Crimea in 2015, to the Khanty-Mansi Autonomous Okrug in 2018. These observations were excluded from the sample.
Conclusion
The existing system of public administration in the Russian Federation is characterized by unequal relations between the center and the regions, and there is a strict dominance of the power vertical. One of the elements of high centralization is the concentration of financial resources and intense transfer activity.
The paper proposes an approach that uses statistical and econometric tools to study the impact of the Federal budget policy on public finance at the subfederal level. Based on it, the authors characterize the direction of gratuitous transfers and test the preservation of motivation in the regions of the Russian Federation to increase revenue collection in the territories.
The conducted empirical analysis of the results of the budget subfederal policy has shown that large-scale vertical redistributions lead to a certain reduction in the budget security differentiation, but the resulting effect does not correspond to the amount of the involved resources. Dynamics estimates confirm that the subfederal budget policy has not solved the problem of significant interregional inequality in Russia, the differences remain quite considerable and there is no tendency to reduce them. Financial resources are returned to the regions through the transfers with a contribution from negotiations with the Federal center.
The structure of regional budget revenue sources varies greatly; there is a large number of Federal subjects whose revenue base is unstable and depends on the transfers from the Federal center. This makes it difficult for the regional authorities to develop longterm development programs, since the budget resources for their implementation are undefined. As a result, the distribution of transfers serves not so much to equalize the regions’ budget security, but to a large extent is used to return the financial resources to constituent entities of the Federation, which is influenced by negotiations with the Federal authorities and the priorities of the Central government.
Despite the active inter-budget redistributions, the Federal subjects still have incentives to expand the tax base of their territories. However, the acceleration of economic growth and development on a new technological basis require creating conditions for the active generation of innovations and their rapid spread. Excessive centralization of public administration, narrow powers of regional authorities and, as a result, the lack of a basis for competition in institutional design between the subfederal governments hinder the development of the initiative. The regional finances’ large dependence on the Federal center limits the horizons of the territory’s long-term plans, calling into question their resource endowment and feasibility.
References Assessing federal transfers' role in the subnational budget system of the Russian Federation
- Musgrave R.A., Musgrave P.B. Gosudarstvennye finansy: teoriya i praktika [Public Finance in Theory and Practice]. Moscow: Biznes Atlas, 2009. 708 p.
- Oates W. An essay on fiscal federalism. Journal of Economic Literature, 1999, vol. 37, no. 3, pp. 1120–1149.
- Oates W.E. On the evolution of fiscal federalism: Theory and institutions. National Tax Journal, 2008, vol. LXI, no. 2, pp. 313–334.
- Shah A., Boadway R. Fiscal Federalism: Principles and Practices of Multi-Order Governance. Cambridge: Cambridge University Press, 2009. 628 p.
- Tiebout C.M. A pure theory of local expenditures. Journal of Political Economy, 1956, vol. 64, no. 5, pp. 416–424.
- Kollman K., Miller J.H., Page S.E. Political institutions and sorting in a Tiebout model. The American Economic Review, 1997, vol. 87, no. 5, pp. 977–992.
- Levaggi R. Decentralized budgeting procedures for public expenditure. Public Finance Review, 2002, vol. 30, no. 4, pp. 273–295.
- McLure C.E. Administrative considerations in the design of regional tax incentives. National Tax Journal, 1980, vol. 33, no. 2, pp. 248–256.
- Bahl R., Puryear D. Regional tax base sharing: Possibilities and implications. National Tax Journal, 1976, vol. 29, no. 3, pp. 328–335.
- Oates W., Schwab M. The allocative and distributive implications of local fiscal competition. Competition Among States and Local Governments. Ed. Kenyon D.A., Kincaid J. Washington: The Urban Institute Press, 1991, pp. 127–145.
- Wilson J. D. A Theory of interregional tax competition. Journal of Urban Economics, 1986, vol. 19, pp. 296–345.
- Wildasin D. Interjurisdictional capital mobility: Fiscal externalities and a corrective subsidy. Journal of Urban Economics, 1989, vol. 25, pp. 193–212.
- Peterson P.E. The Price of Federalism. Washington, D.C.: The Brooking Institution, 1995. 239 p.
- Wallack J., Spinivasan T.N. Federalism and Economic Reform. International Perspectives. Cambridge: Cambridge University Press, 2006. 516 p.
- Hueglin T., Fenna A. Comparative Federalism: A Systematic Inquiry. Quebec City: Broadview press, 2006. 390 p.
- Nemec J., Wright G. Public Finance. Theory and Practice in Central European Transition. Bratislava: NISPAcee, 1997. 458 p.
- Zhuravskaya E. Federalism in Russia. In: Russia after the Global Economic Crisis. Washington, D.C.: Peterson Institute for International Economics, 2010, pp. 59–77.
- Klimanov V.V., Korotkikh A.M. The allocation of intergovernmental transfers: Theoretical background and the Russian practice. Finansovyi zhurnal=Financial Journal, 2016, no. 5, pp. 7–15. (in Russian)
- Klimanov V.V., Lavrov A.M. Intergovernmental fiscal relations in Russia in the present time. Voprosy ekonomiki=Voprosy Ekonomiki, 2004, no. 11, pp. 111–125. (in Russian)
- Lavrov A.M. Byudzhetnaya reforma v Rossii. Ot upravleniya zatratami k upravleniyu rezul’tatami [Budget Reform in Russia. From Cost management to Result-Based Management]. Moscow: KomKniga, 2005. 555 p.
- Pchelintsev O.S. Regional’naya ekonomika v sisteme ustoichivogo razvitiya [Regional Economy in the Sustainable Development System]. Moscow: Nauka, 2004. 258 p.
- Khristenko V.B. Mezhbyudzhetnye otnosheniya i upravlenie regional’nymi finansami: opyt, problemy, perspektivy [Intergovernmental Fiscal Relations and Regional Finance Management: Experience, Problems, Prospects]. Moscow: Delo, 2002. 606 p.
- Golovanova N.V., Dombrovskii E.A. Federal center and regions: Assignment of powers changes in 2005–2015. Finansovyi zhurnal=Financial Journal, 2016, no. 2, pp. 41–51. (in Russian)
- Gorlova O.S. Fiscal policy of the Russian Federation in the sphere of budget income: improvement of the implementation mechanism. Ekonomika i predprinimatel’stvo=Journal of Economy and Entrepreneurship, 2015, no. 10-2 (63), pp. 431–435. (in Russian)
- Chernyavskii A. Problems of balancing regional budgets. Finansy=Finance, 2015, no. 8, pp. 15–21. (in Russian)
- Akindinova N., Chernyavskii A., Chepel A. Analysis of regional fiscal balance. Voprosy ekonomiki=Voprosy Ekonomiki, 2016, no. 10, pp. 31–48. (in Russian)
- Arlashkin I.Yu., Deryugin A.N., Proka K.A. Separation of jurisdiction between governmental tiers in Russia: Budgetary issues. Finansovyi zhurnal=Financial Journal, 2015, no. 4, pp. 85–93. (in Russian)
- Dombrovskii E.A. Ten steps towards the budget balance of the subjects of the Russian Federation. Finansy i kredit=Finance and Credit, 2015, no. 37, pp. 52–64. (in Russian)
- Eroshkina L.A. Development of inter-budgetary relations and forms of intergovernmental transfers in the Russian Federation. Kazanskii ekonomicheskii vestnik=Kazan Economic Vestnik, 2015, no. 4, pp. 79–86. (in Russian)
- Deryugin A.N., Nazarov V.S., Mamedov A.A. Development of consolidated budgets of Russian regions in the medium term: Problems and solutions Finansovyi zhurnal=Financial Journal, 2014, no. 3, pp. 5–19. (in Russian)
- Eroshkina L.A. Strategic directions of development of interbudgetary relations in the Russia Federation. Finansy=Finance, 2016, no. 7, pp. 7–15. (in Russian)
- Klimanov V. V., Mikhailova A. A. Intergovernmental fiscal relations: recent trends and prospects. Gosudarstvennyi audit. Pravo. Ekonomika=State Audit. Law. Economics, 2016, no. 4, pp. 31–34. (in Russian)
- Khugaeva M. Improvement of inter-budgetary relations in Russia. Ekonomicheskaya politika=Economic Policy, 2014, no. 4, pp. 146–152. (in Russian)
- Chernyshova N. A. Trends and regional priorities in providing intergovernmental fiscal transfers last decade. Obshchestvennye finansy=Public Finance, 2016, no. 2, pp. 48–72. (in Russian)
- Bukharsky V. V., Lavrov A. M. Impact evaluation of the equalizing and stimulating effects of intergovernmental transfers to the subjects of the Russian Federation. Finansovyi zhurnal=Financial Journal, 2017, no. 1, pp. 9–21. (in Russian)
- Mamedov A.A., Nazarov V.S., Siluanov A.G., Alaev A.A., Zarubin A.V. Problemy mezhbyudzhetnykh otnoshenii v Rossii [Issues of Interbudgetary Relations in Russia]. Moscow: Institut Gaidara, 2012. 188 p.
- Siluanov A.G. Mezhbyudzhetnye otnosheniya v usloviyakh razvitiya federalizma v Rossii [Interbudgetary Relations in the Conditions of the Development of Federalism in Russia]. Moscow: Delo, 2011. 296 p.
- Siluanov A.G., Starodubrovskaya I.V., Nazarov V.S. Methodological approach to evaluating intergovernmental relations in the Russian Federation. Ekonomicheskaya politika=Economic Policy, 2011, no. 1, pp. 5–22. (in Russian)
- Valieva D.G., Bogoviz A.V. Regional disparities in the Russian Federation and the mechanisms of its smoothing. Izvestiya Altaiskogo gosudarstvennogo universiteta=Izvestiya of Altai State University, 2011, no. 2-2 (70), pp. 350–354. (in Russian)
- Mikhailova A.A., Klimanov V.V., Safina A.I. The impact of intergovernmental fiscal transfers on economic growth and the structure of the regional economy. Voprosy ekonomiki=Voprosy Ekonomiki, 2018, no. 1, pp. 91–103. (in Russian)
- Barakhovskii A.C., Busarova A.B., Vaksova E.E., Efimov I.L. Monitoring kachestva upravleniya subnatsional’nymi obshchestvennymi finansami [Monitoring the Quality of Subnational Public Finance Management]. Moscow.: Lenand, 2005. 112 p.
- Sumskaya T.V. Main trends of subfederal fiscal policy. Region: ekonomika i sotsiologiya=Region: Economics and Sociology, 2014, no. 3, pp. 58–74. (in Russian)
