Assessing the Importance of Attributes for Diagnosis of Diabetes Disease

Author: Kemal Akyol
Journal: International Journal of Information Engineering and Electronic Business(IJIEEB) @ijieeb
Article in issue: 5 vol.9, 2017.
Free access
Diabetes is a chronic, metabolic disease related to the rise of levels of blood glucose. According to the current data from the World Health Organization, 422 million adults have diabetes in the world and prevalence of diabetes is 13.2%. Disregarding the diagnosis and treatment of the disease leads to some major problems on kidneys, heart and blood vessels, eyes, nerves, pregnancy and wound healing. The most common type of diabetes and usually in adults, Type 2 diabetes occurs when the body becomes resistant to insulin or does not make enough insulin. The main objective of this study is to make more successful this disease by investigating the important attributes based on assessing the importance of attributes using the Stability Selection method. The proposed method might be a powerful tool for the importance of attributes, and effective diagnosis of this disease with the classification accuracy is 78.57% and ROC value is 0.75.
Classification, diabetes diagnosis, stability selection
Short address: https://sciup.org/15013518
IDR: 15013518
Text of the scientific article Assessing the Importance of Attributes for Diagnosis of Diabetes Disease
Published Online September 2017 in MECS DOI: 10.5815/ijieeb.2017.05.01
Diabetes is a chronic, metabolic disease related to the rise of levels of blood glucose [1, 2], which leads over time to serious damage to the heart, blood vessels, eyes, kidneys, and nerves. According to the current data from the World Health Organization, 422 million adults have diabetes and prevalence of diabetes is 13.2% of males: 12.2% and females: 14.2%. 1.5 million death are directly attributed to diabetes each year. 1 in 3 adults aged over 18 years is overweight and 1 in 10 is obese [1]. The factors such as genes, obesity, metabolic syndrome, too much glucose, bad communication between cells, broken beta cells cause diabetes disease.
Table 1.Prevalence of diabetes and related risk factors [1].
|
Males |
Females |
Total |
|
|
Diabetes |
12.2% |
14.2% |
13.2% |
|
Overweight |
63.5% |
68.7% |
66.1% |
|
Obesity |
22.6% |
35.9% |
29.4% |
|
Physical inactivity |
27.1% |
37.1% |
32.3% |
Disregarding the diagnosis and treatment of the disease leads to some major problems on kidneys, heart and blood vessels, eyes, nerves, pregnancy and wound healing [3]. Diabetes profile of Turkey (2016) was presented in Table 1 according to World Health Organization [1]. Diabetes is one of the most common diseases in the world. There are two main types of diabetes: Type 1 and Type 2. Once known as juvenile diabetes or insulin-dependent diabetes, Type 1 diabetes is a chronic condition in which the pancreas produces little or no insulin by itself [1]. Type 2 diabetes, the most common type of diabetes [1, 4] and usually in adults, occurs when the body becomes resistant to insulin or does not make enough insulin [1]. Many countries consume 5–10% of health budgets for Type 2 diabetes and its complications [5]. Type 2 diabetes displays a clear association with obesity [6]. The prevalence of this disease has risen dramatically in countries of all income levels in past three decades. Halt the rise in diabetes and obesity by 2025 is agreed globally [1]. Using various knowledge discovery and machine learning techniques, studies are performed in the field of medical decision support systems.
The main purpose of this method is to investigate the importance of attributes for the disease and realize the machine learning. The determination of importance of the attributes is an important process. There are many studies on this subject in the literature. For example, Chittineni and Bhogapathi applied the Exhaustive search and Heuristic search techniques in order to determine features that contribute to cluster data [7]. Parimala and Nallaswamy proposed swarm optimization technique, binary particle swarm optimization technique and its variants in order to select the optimal feature subset [8]. Kalpana and Mani compared the two methods Median Based Discretization and ChiMerge discretization. In their studies, the original features were ranked by both methods and the top ranked attributes were selected as the more relevant ones by using the feature relevance [9]. In another study, Alia and Taweel developed a new algorithm for Feature Selection based on hybrid Binary Cuckoo Search and rough set theory for classification on nominal datasets [10]. In this direction, it was focused on diagnosing of type 2 diabetes based on the importance of attributes and realized machine learnings in this study. A new approach based on the hybrid combination of Stability Selection (SS) and classifier algorithms was proposed. Important attributes among all attributes were selected by utilizing the SS method, which was performed on sub-datasets, which were obtained with 5 fold cross-validation technique. By sending the new datasets include these attributes to the Random Forest (RF) and Logistic Regression (LR) classifier algorithms, the learning performance of the system was evaluated according to these combinations. In addition, Receiver Operating Characteristic (ROC) analysis was also realized.
The rest of this paper was organized as follows. In Section 2, related studies were examined. In Section 3, our proposed methodology was given. In Section 4, data and experimental process were given in a detailed way. Finally, in Section 5, the conclusion was given and some future works for this disease were suggested.
-
II. Literature Review
There are numerous investigations using different classifier algorithms and data mining techniques for diagnosing of type 2 diabetes so far. Some of these studies are as follows: In [11], Lekkas et al. performed the diagnosis of Pima Indian diabetes and dermatological diseases using the fuzzy rule-based systems named eClass model. An accuracy of 79.35% was achieved in their study. In [12], Temurtas et al. used a multilayer neural network, which was trained by Levenberg–Marquardt algorithm, and a Probabilistic Neural Network. In [13], Kayaer and Yildirim examined the performances of the General Regression Neural Network, the Standard Multilayer Perceptron and the Radial Basis Function Feed Forward Neural Networks algorithms. In [14], Sadri et.al. used Naive Bayes, Radial Basis Function Network, and J48 data mining techniques for diagnosing type 2 diabetes. The highest accuracy was achieved with Naive Bayes having an accuracy rate of 76.95%. In [15], Ebenezer and Khashman used Back-Propagation Multi-Layer Artificial Neural Networks for diagnosing of type2 diabetes. In order to train Back-propagation, the authors were used sigmoid function. An accuracy of 82.0% was achieved. In [16], Carpenter and Markuzon introduced the ARTMAP-IC Neural Network system which investigates the inconsistent cases for medical diagnosis. The classification accuracy of 81.0% was achieved for diabetes dataset with this system. In [17] Huang et al. identified the significant factors influencing diabetes control, by applying feature selection, classification and knowledge discovery by using diabetic patients’ information was collected by Ulster Community and Hospitals Trust from the year 2000 to 2004 as part of clinical management. In [18], Bozkurt et al. categorized the Pima Indian Diabetes dataset by utilizing Neural Networks which include 6 different model, the Artificial Immune System, and the Gini algorithm. The best accuracy value was achieved with the Distributed Time Delay Networks among these algorithms. Seera and Lim [19] introduced a hybrid intelligent system that consists of the Fuzzy Min–Max Neural Network, Classification and Regression Tree, and the Random Forest algorithms. The methodology was implemented on Breast Cancer
Wisconsin, Pima Indian Diabetes, and Liver Disorders datasets. Esin Dogantekin et al. [20] presented an intelligent diagnosis system which composed by two phases: The Linear Discriminant Analysis and classification by using ANFIS classifier phases, for diabetes. The classification accuracy of this system was obtained about 84.61%. In [21], Lukka introduced a feature selection method based on fuzzy entropy measures. This model was tested on dermatology, Pima-Indian diabetes, breast cancer and Parkinsons datasets. Muhammad Waqar Aslam et al. [22] introduced Genetic Programming system based method which consists of features selection using the t-test, Kolmogorov–Smirnov test, Kullback–Leibler divergence test, F-score selection and GP, and classification of the sub datasets which were obtained from the original dataset. In [23], Selvakuberan et al. proposed a feature selection approach using a combination of Ranker Search method for the detection of diabetes in Pima Indian Diabetes Dataset. The classification accuracy of 81% was achieved. Barakat et al. [24] introduced an additional explanation module, which turns the “black box” model of an SVM into an intelligible representation of the SVMs for the diagnosis, prognosis, and management of diabetes.
-
III. Dataset
Widely used in diabetic studies, Pima Indian Diabetes Data was taken from the University of California Irvine Machine Learning Repository’s website. All patients are Pima-Indian women at least 21 years old and who lived in Arizona [25]. The Pima Indians have the highest prevalence of diabetes [26-27] and incidence of noninsulin-dependent diabetes mellitus also referred to Type II Diabetes in the world [26, 28]. Also, increasing high rates among children, the disease is a common disease in American Indian children aged 10 or more years and has increased dramatically over time, along with increasing weight [29].The binary response variable takes ‘0 or ‘1’ values, where ‘0’ is a non-disease and ‘1’ is a disease for the disease. Table 2 shows the structure of the dataset, which have 9 attributes as 8 input and 1 output.
Table 2. Pima Indian Diabetes dataset attributes [25].
|
Attribute no. |
Attribute |
|
1 |
Number or times pregnant (NTP) |
|
2 |
Plasma glucose concentration (PGC) |
|
3 |
Diastolic blood pressure (mmHg) (DBP) |
|
4 |
Triceps skin-fold thickness (mm) (TSFT) |
|
5 |
2-h serum insulin (mu U/mL) (H2SI) |
|
6 |
Body mass index (kg/m2) (BMI) |
|
7 |
Diabetes pedigree function (DPF) |
|
8 |
Age |
|
9 |
Class 0 and 1 (Diagnosis of type 2 diabetes disease) |
-
IV. Methodology
In this section, a detail information about the data normalization, the importance of attributes, prediction algorithms, and performance evaluation were presented.
-
A. Data Normalization
The pre-processing of the data is an important step for knowledge discovery and meaningful information process. Because inappropriate, unnecessary or noise-containing data difficult the machine learning. It can be said that normalization is a pre-process which was applied to realize the learning process more efficiently.
-
B. Assessing of the importance of attributes
The analysis of datasets, which have many attributes, can be less efficient because of the sample data space could not well. Therefore, some of these attributes, which decrease the model accuracy, must be removed from the dataset. In this study, the performance of SS method was investigated in order to find the important attributes. This method eliminates some of the original input features and retain the dataset that yields best classification performance. Therefore, new feature sets, which have the least variable in the most compatible way, are obtained. This method is useful for both pure attribute selection and data interpretation. Mordelet et al. who examining the SS method, proposed a regression scheme that combines Support Vector Regression (SVR) and the SS method based on Least Absolute Shrinkage and Selection Operator (LASSO). This scheme consists in randomly perturbing the dataset many times. SVR often has good generalization error properties and LASSO regression includes an L1 constraint that selects a small subset of features in X to explain the outcome (y) variable and is preferred for interpretability purposes. In particular, the output y is modeled as a linear function of the input features X. The LASSO regression can be written as the following optimization problem (Equation 1) [30]:
min ii н + | ( y . - w T x - ) 2 (1)
where λ reflects the trade-off between fit and sparsity, or the proportion of features removed. The penalty term means that a solution w becomes sparser as λ increases. Thus, a smaller set of features is used to model y [30].
-
C. Learning and Prediction Algorithms
Sending optimal features as the input data to the classifier algorithms, it is targeted to find the best success algorithm. Best performance is achieved with the best sampling of data space in these processes. In this study, it is aimed to achieve high prediction performance using RF and LR classification algorithms which being used commonly.
-
1) Random Forest
The success of randomly selected attributes in each node is investigated and the best of them is selected with RF algorithm, which obtained by combining the decision trees and introduced by Breiman [31]. With this algorithm, the tree structure is constituted by determining the number of trees and the samples will be used in each node. Electing the trees, which have the most votes in these trees, the classification of the new dataset is performed [32].
-
2) Logistic Regression
It is a regression method that helps to classify and assign the binary or dichotomous outcome variable [33]. It is the most popular model in statistical modeling of binary response Y and quantitative explanatory variables Xs [34]. For example, a relationship between age and the presence or absence of any disease is investigated by utilizing this method [33].
-
D. Performance Evaluation
By evaluating the experimental and the exact results, the success of any model is researched. The sensitivity (Sen), the specificity (Spe) and the Accuracy (Acc) metrics, which were given in Equation 2, 3 and 4
respectively, are used for evaluating the performance of a system. The Sen metric is the ratio of the number of actual positives to the number of total positives found as disease. The Spe metric is the ratio of the number of actual negatives to the number of total negatives found as non-disease. The Acc value is the ratio of the number of correctly diagnosed samples to the total number of samples [35].
Sen = TP /(TP + FN)
Spe=TN/ (TN+FP)
Acc=(TP+TN) / (TP+FP+TN+FN)
where TP is the number of diabetes found as the disease, TN is the number of non-diabetes as normal, FP is the number of not disease found as diabetes disease, and FN is the number of diabetes found as normal for this study.
The k- fold cross-validation technique is used in order to perform the test results much more reliable and determinative in many classification studies. After by dividing the dataset into sub-datasets equally, training and test data are replaced crossly by this method, in which the mistakes associated with the random sampling of training are minimized and the machine memorized does not. A test data is one of the folds each iterate, and training data is formed with the remaining folds. So, the classifier algorithm is trained and tested k times with different train and test datasets. The average of these results gives the accuracy of the algorithm with the reference of the study [36].
-
V. Design Process and Experimental Results
Figure 1 describes the flow chart of the proposed method. As shown in the block diagram, firstly, the dataset was normalized into a range from 0 to 1 values. After this step, the SS algorithm was used for find the most effective attributes for outcome variable. Therefore, the dataset, which contains these attributes, was obtained according to this method. Afterward, this dataset was divided into 80-20% split of training and test set in order to achieve a high level of efficiency for the proposed method in the framework of 5-fold cross validation which was mentioned in Section 3.4. In other words, the subdatasets were selected randomly to avoid favoritism. Hence, there are 614 training records and 154 test records. These sub datasets as the input data send to the classifier algorithms and machine learning was realized in order to predict diabetes or not. Thus, these classifier algorithms’ performances were evaluated on each sub-dataset comparatively. The analysis results and the performance evaluations were presented in confusion matrix structure in Table 3.
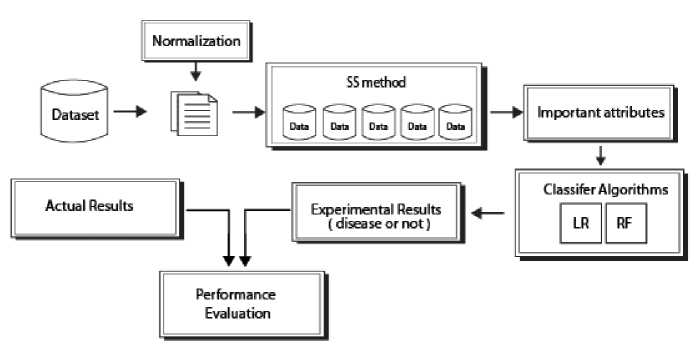
Fig.1. The block diagram of the proposed method.
Table 3. Obtained results for all models (5 fold cross-validation). Best results are bolded.
|
Classifier Algorithms |
||||||||||
|
LR |
RF |
|||||||||
|
Datasets |
||||||||||
|
Fold 1 (sub-dataset 1) |
0 |
1 |
0 |
1 |
||||||
|
0 |
91 |
8 |
0 |
94 |
5 |
|||||
|
1 |
27 |
28 |
1 |
19 |
36 |
|||||
|
Sen:50.91% |
Sen: 65.45% |
|||||||||
|
Spe: 91.92% |
Spe: 94.95% |
|||||||||
|
Acc:77.27% |
Acc: 84.42% |
|||||||||
|
Fold 2 (sub-dataset 2) |
0 |
1 |
0 |
1 |
||||||
|
0 |
98 |
13 |
0 |
93 |
18 |
|||||
|
1 |
16 |
27 |
1 |
15 |
28 |
|||||
|
Sen:62.79% |
Sen:65.12% |
|||||||||
|
Spe:88.29% |
Spe:83.78% |
|||||||||
|
Acc: 81.17% |
Acc: 78.57% |
|||||||||
|
Fold 3 (sub-dataset 3) |
0 |
1 |
0 |
1 |
||||||
|
0 |
87 |
10 |
0 |
79 |
18 |
|||||
|
1 |
27 |
30 |
1 |
20 |
37 |
|||||
|
Sen: 52.63% |
Sen:64.91% |
|||||||||
|
Spe: 89.69% |
Spe: 81.44% |
|||||||||
|
Acc: 75.97% |
Acc: 75.32% |
|||||||||
|
Fold 4 (sub-dataset 4) |
0 |
1 |
0 |
1 |
||||||
|
0 |
90 |
10 |
0 |
80 |
20 |
|||||
|
1 |
25 |
29 |
1 |
19 |
35 |
|||||
|
Sen: 53.70% |
Sen:64.81% |
|||||||||
|
Spe: 90.0% |
Spe: 80.0% |
|||||||||
|
Acc: 77.27% |
Acc:74.68% |
|||||||||
|
Fold 5 (sub-dataset 5) |
0 |
1 |
0 |
1 |
||||||
|
0 |
90 |
12 |
0 |
89 |
13 |
|||||
|
1 |
29 |
23 |
1 |
18 |
34 |
|||||
|
Sen: 44.23% |
Sen:65.58% |
|||||||||
|
Spe: 88.24% |
Spe: 87.25% |
|||||||||
|
Acc: 73.38% |
Acc:79.87% |
|||||||||
|
Average |
Sen: 52.85% Spe:89.63% Acc: 77.01% |
Sen:65.17% Spe:85.48% Acc:78.57% |
||||||||
For example, the results of the classification analysis which was performed with the LR on the data set id:1 were given in the 3-column and 4-row confusion matrix. Accordingly, out of 55 data which was considered as positive, the RF found that 36 were positive for them. Also, out of 99 data which was considered as negative, the RF found that 94 were negative of them. Therefore, the RF gave values of 84.42% Acc, 65.45% Sen, and 94.95% Spe on this dataset. In this direction, the average of the experimental results, which were obtained from each model, was given at the bottom of the relevant tables. When all of the hybrid models were compared in terms of Average Acc, Sen and Spe, the best average Acc and Sen values were achieved with the hybrid combination of SS and RF methods with a value of 78.57% and 65.17% respectively. The best Spe value was achieved with the hybrid combination of SS and LR, with a value of
89.63%. Actually, the success of both models is about the same approximately. Also, the results of receiver operating characteristic (ROC) curve of each model were given in Figure 2. The true positive rate is plotted in function of the false positive rate for different cut-off points in the ROC curve. Each point on this curve represents a sensitivity/specificity pair corresponding to a particular decision threshold [37]. The significance levels of the important attributes were presented in Figure 3 and averages of these values were given in Table 4. Accordingly, we can say that BMI, PGC and NTP attributes are the most important factors for this disease. The performance of this study was compared with existing studies as shown in Table 5. From the table, it can be concluded that the Acc values of all studies are quite close to each other generally.
Table 4. Ranking of importance of attributes.
|
Attribute |
Abbreviati on |
Average significance levels of the important attributes |
|
Number or times pregnant |
NTP |
0.96 |
|
Plasma glucose concentration |
PGC |
1.0 |
|
Diastolic blood pressure (mmHg) |
DBP |
0.2 |
|
Triceps skin-fold thickness (mm) |
TSFT |
0.01 |
|
2-h serum insulin (mu U/mL) |
H2SI |
0.02 |
|
Body mass index (kg/m2) |
BMI |
1.0 |
|
Diabetes pedigree function |
DPF |
0.75 |
|
Age |
AGE |
0.59 |
Table 5. The comparison of the studies for diagnosis of diabetes.
|
Study |
Approach |
Acc (%) |
|
Lekkas et al. [11] |
Fuzzy Rule-Based Systems named eClass Model |
79.35% |
|
Temurtas et al. [12] |
Multilayer Neural Network with Levenberg-Marquardt Algorithm |
82.37% |
|
Kayaer and Yildirim [13] |
Gradient Descent with Momentum AND Adaptive Learning Rate |
80.21% |
|
Sa’di et.al. [14] |
Naive Bayes |
76.95% |
|
Ebenezer and Khashman [15] |
Back-Propagation Multi-Layer Artificial Neural Networks |
82.0% |
|
Carpenter and Markuzon [16] |
ARTMAP-IC Neurol Networks |
81% |
|
Proposed approach |
SS and LR SS and RF |
77.01% 78.57% |
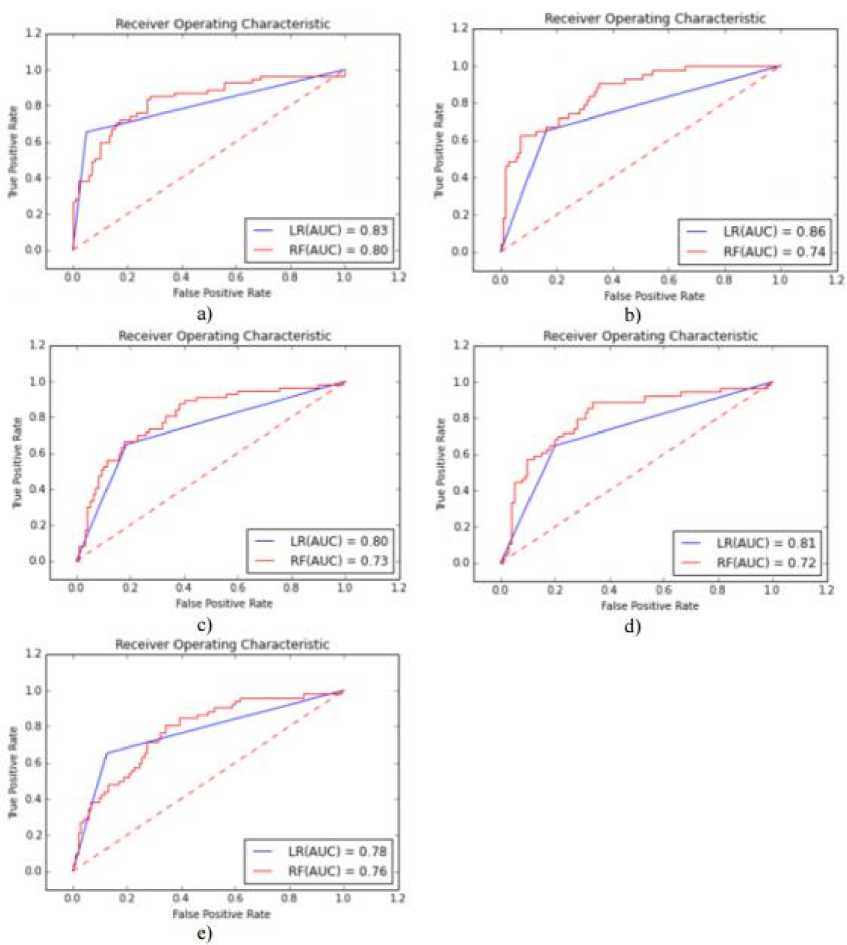
Fig.2. The results of ROC Curve: a) fold 1, b) fold 2, c) fold 3, d) fold 4, e) fold 5. (ROC obtained with SS and LR model: 0.82, ROC obtained with SS and RF model: 0.75)
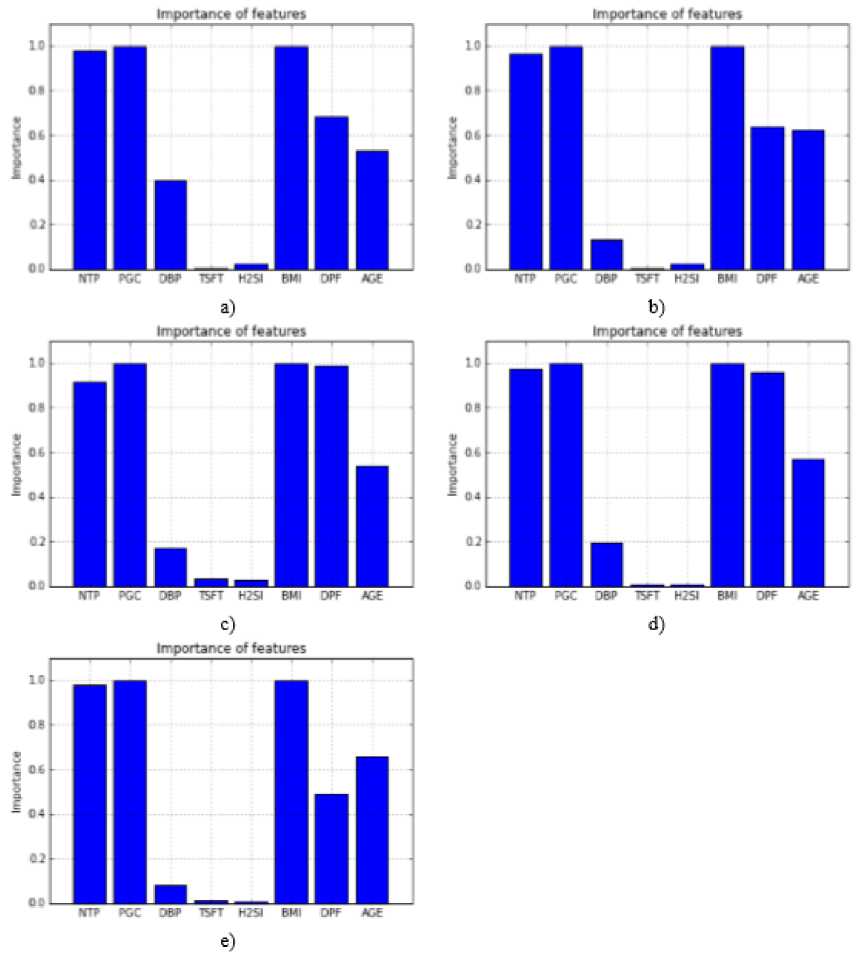
Fig.3. Importance of the attributes: a) fold 1, b) fold 2, c) fold 3, d) fold 4, e) fold 5.
-
VI. Conclusion
Diabetes is a chronic, metabolic disease related to the rise of levels of blood glucose. Progressive stages of this disease lead to some major problems on kidneys, heart and blood vessels, eyes, nerves, pregnancy and wound healing. The main objective of this study is to investigate the important features of this disease and realize the machine learning more successful. For this, SS method based on assessing the importance of attributes was preferred. This method was carried out on sub-datasets obtained with 5 fold cross-validation. New datasets include important attributes, send to the RF and LR algorithms as the input data, and so the best model was researched. The best accuracy was achieved with the hybrid combination of LR and SS model in the experimental process. The proposed method might be a powerful tool for effective diagnosis of this disease. It is aimed to increase the success by working with other attribute selection methods in subsequent studies.
Acknowledgments
The author is thankful to the National Institutes of Diabetes and Digestive and Kidney Diseases.
References Assessing the Importance of Attributes for Diagnosis of Diabetes Disease
- Internet: WHO, World Diabetes Statistics, Geneva, Switzerland, WHO. http://www.who.int/diabetes/en/index.html, 2017.
- National Research Council (US) Committee on Population; Sandefur GD, Rindfuss RR, Cohen B, editors. Changing numbers, changing needs: American Indian demography and public health. Washington DC, USA: National Academy of Sciences, 1996.
- Internet: Type 2 Diabetes: the basics. http://www.webmd.com/diabetes/type-2-diabetes-guide/type-2-diabetes, 2017.
- M. McCarthy and S. Menzel, “The genetics of type 2 diabetes,” Brit J Clin Pharmaco, vol. 51, no. 3, pp. 195-199, 2001.
- L. Marks, British Diabetic Association, and King's Fund Policy Institute, “Counting the cost: The real impact of non-insulin-dependent diabetes,” London: British Diabetic Association, 1996.
- G. Reaven, “Role of insulin resistance in human disease,” Diabetes, vol. 37, no. 12, pp. 1595-1607, 1988.
- S. Chittineni and R.B. Bhogapathi, “Determining Contribution of Features in Clustering Multidimensional Data Using Neural Network,” I.J. Information Technology and Computer Science, vol. 10, pp. 29-36, 2012.
- R. Parimala and R. Nallaswamy, “Feature Selection using a Novel Particle Swarm Optimization and It’s Variants,” I.J. Information Technology and Computer Science, vol. 5, pp. 16-24, 2012.
- P. Kalpana and K. Mani, “An Exploratory Analysis between the Feature Selection Algorithms IGMBD and IGChiMerge,” I.J. Information Technology and Computer Science, vol. 7, pp. 61-68, 2017.
- A.F. Alia and A. Taweel, “Feature Selection based on Hybrid Binary Cuckoo Search and Rough Set Theory in Classification for Nominal Datasets,” I.J. Information Technology and Computer Science, vol. 4, pp. 63-72, 2017.
- S. Lekkas, L. Mikhailov, “Evolving fuzzy medical diagnosis of Pima Indians diabetes and of dermatological diseases,” Artif Intell Med, vol.50, no.2, pp. 117-126, 2010.
- H. Temurtas, N. Yumusak, F. Temurtas, “A comparative study on diabetes disease diagnosis using neural networks,” Expert Syst Appl, vol. 36, no. 4, pp. 8610-8615, 2009.
- K. Kayaer, T. Yildirim, “Medical diagnosis on Pima Indian diabetes using general regression neural networks,” In: Proceedings of the International Conference on Artificial Neural Networks and Neural Information, pp. 181-184, 2003.
- S. Sadri, A. Maleki, R. Hashemi, Z. Panbechi, K. Chalabi, “Comparison of data mining algorithms in the diagnosis of type II diabetes,” International Journal on Computational Science & Applications, vol. 5, no. 5, pp. 1-12, 2015.
- O.O. Ebenezer, A. Khashman, “Onset diabetes diagnosis using artificial neural network,” International Journal of Scientific & Engineering Research, vol. 5, no. 10, pp. 754-759, 2014.
- G.A. Carpenter, N. Markuzon, “ARTMAP-IC and medical diagnosis: Instance counting and inconsistent cases,” Neural Networks, vol. 11, no. 2, pp. 323-336, 1998.
- Y. Huang, P. McCullagh, N. Black, R. Harper, “Feature selection and classification model construction on type 2 diabetic patients data,” Artif Intell Med, vol. 41, no. 3, pp. 251-262, 2007.
- M.R. Bozkurt, N. Yurtay, Z. Yılmaz, C. Sertkaya, “Comparison of different methods for determining diabetes,” Turk J Elec Eng & Comp Sci, vol. 22, pp. 1044-1055, 2014.
- M. Seera, C.P. Lim, “A Hybrid intelligent system for medical data classification,” Expert Syst Appl, vol. 41, no. 5, pp. 2239-2249, 2014.
- E. Dogantekin, A. Dogantekin, D. Avci, L. Avci, “An intelligent diagnosis system for diabetes on linear discriminant analysis and adaptive network based fuzzy inference system: LDA– ANFIS,” Digit Signal Process, vol. 20, no. 4, pp. 1248-1255, 2010.
- P. Lukka, “Feature selection using fuzzy entropy measures with similarity classifier,” Expert Syst Appl, vol. 38, no. 4, pp. 4600-4607, 2011.
- M.W. Aslam, Z. Zhu, A.K. Nandi, “Feature generation using genetic programming with comparative partner selection for diabetes classification,” Expert Syst Appl, vol. 40, no. 13, pp. 5402-5412, 2013.
- K. Selvakuberan, D. Kayathiri, B. Harini, M.I. Devi, “An efficient feature selection method for classification in health care systems using machine learning techniques,” 3rd International Conference on Electronics Computer Technology; 8-10 Apr 2011.
- N. Barakat, A.P. Bradley and M.N.H. Barakat, “Intelligible support vector machines for diagnosis of diabetes mellitus,” IEEE Transactions on Information Technology in Biomedicine; vol. 4, pp. 1114-1120, 12 Jan 2010.
- Internet: UCI machine learning, Pima Indians diabetes dataset, University of California Irvine,, CA, USA, http://archive.ics.uci.edu/ml/machine-learning-databases/pima-indians-diabetes, 2017.
- W.C. Knowler, P.H. Bennett, R.F. Hammam and M. Miller, “Diabetes incidence and prevalence in Pima Indians: a 19-fold greater incidence than in Rochester, Minnesota,” Am J Epidemiol, vol. 108, no.6, pp. 497-504, 1978.
- A. Krosnick, “The diabetes and obesity epidemic among the Pima Indians,” N J Med, vol. 97, no. 8, pp. 31-37, 2000.
- L.J. Baier, R.L. Hanson, “Genetic studies of the etiology of type 2 diabetes in Pima Indians: hunting for pieces to a complicated puzzle,” Diabetes, vol. 53, no. 5, pp. 1181-1186, 2004.
- D. Dabelea, R.L. Hanson, P.H. Bennett, J. Roumain, W.C. Knowler and D.J. Pettitt, “Increasing prevalence of type II diabetes in American Indian children,” Diabetologia, vol. 41, no. 8, pp. 904-910, 1998.
- F. Mordelet, J. Horton, A.J. Hartemink, B.E. Engelhardt and R. Gordan, “Stability selection for regression-based models of transcription factor–DNA binding specificity,” Bioinformatics, vol. 29, no. 13, pp. 117-125, 2013.
- L. Breiman, “Random forests,” Mach Learn, vol. 45, pp. 5-32, 2001.
- O. Akar and O. Gungor, “Classification of multispectral images using Random Forest algorithm,” Journal of Geodesy and Geoinformation, vol. 1, no. 2, pp. 139-146, 2012.
- S. Lemeshow and D. Hosmer, Applied logistic regression, 2nd ed. New York, USA: Wiley, 2000.
- A. Agresti, An introduction to categorical data analysis, 2nd ed. New Jersey, USA: Wiley, 2007.
- A. Baratloo, M. Hosseini, A. Negida and G.E. Ashal, “Part 1: Simple Definition and Calculation of Accuracy. Sensitivity and Specificity,” Emerg (Tehran), vol. 3, no. 2, pp. 48-49, 2015.
- R. Kohavi, “A study of cross-validation and bootstrap for accuracy estimation and model selection,” Proceedings of the 14th international joint conference on Artificial intelligence, vol. 2, pp. 1137-1143, 1995.
- Internet: ROC Curves, https://www.medcalc.org/manual/roc-curves.php, 2017.
