Assessing the level of social development in Russia’s regions: methodological and applied aspects

Author: Ataeva A.G., Oreshnikov V.V.
Journal: Economic and Social Changes: Facts, Trends, Forecast @volnc-esc-en
Section: Theoretical and methodological issues
Article in issue: 5 т.16, 2023.
Free access
Modern research works contain a large number of different approaches to assessing the level of socio-economic development of territories; as for the techniques that assess economic development of territories, they are not so numerous; and the techniques for assessing social development of territories are encountered even less often. We put forward our own approach to assessing the level of social development in Russia’s regions and consider population (consumer of social services) and the social sphere (subsystem of services provision) as the object of managing social development of the territory. The article proposes a technique for assessing the level of development of the territorial socio-economic system using Amartya Sen’s modified social welfare function, taking into account adjustments for the characteristics of management object components: quality of life, social infrastructure and social services. We determine adjustment factors and carry out the testing on the data for 2014-2021 in the context of Russia’s constituent entities; we form a rating of regions according to the level and specifics of social development and identify four groups of regions: “social development leaders”, “socially developing”, “socially slowing down” and “socially undeveloped” regions.
Social development, social welfare, standard of living, quality of life, population income, gross regional product, social services, social infrastructure, social sphere
Short address: https://sciup.org/147242459
IDR: 147242459 | UDC: 332.145 | DOI: 10.15838/esc.2023.5.89.4
Text of the scientific article Assessing the level of social development in Russia’s regions: methodological and applied aspects
Article 7 of the Constitution the Russian Federation states: “The Russian Federation is a social State whose policy is aimed at creating conditions for a worthy life and free development of man”1. At the same time, there is no official definition of the terms “social state”, “social development”, “social sphere”, “social infrastructure” in the Russian legislation.
The basic ideas about the formation of the social state as a result of historical progress emerged in the 18th–19th centuries (I. Kant, O. Comte, H. Spencer, etc.). The process, as a result of which the mind of man subdued the forces of nature and improved society on the way to justice and freedom, was characterized as social development. It was believed that the progress of individuals conditioned social progress, and the level of public (social) development depended on the realization of human potential (Spencer, 2013).
In K. Marx’s works, social development was determined by the constant contradiction between productive forces and production relations (Arkhangel’skii, 1985), and the social development result was determined primarily by economic factors.
Later works trace humanistic motives of social development. In the works of V.O. Klyuchevskii, P.N. Milyukov, N.A. Rozhkov, etc. (Andreeva, 1995; Belous, 2010; Mitina, 1997; Shcherban, 1996) it is not so much the process of society development itself due to economic and political reasons that is important, but its orientation toward achieving harmony of man with nature and society as a certain development ideal.
With the beginning of industrial revolutions, globalization, development of consumer society, technocratic concepts of social development appear. On the one hand, the growth of material production, facilitation of labor lead to objective improvement of the quality of life, on the other hand, new factors affecting it emerge: social security, the need for dialogue, protection of minorities, search for compromises, etc. (Parsons, 2004).
Currently, the concept of sustainable development, as articulated in the report Our Common Future2, is now a globally accepted concept. It noted that “certain aspects of social development (population issues, human rights, their relationship to poverty, environmental quality, health and economic development) proved to be the most difficult of those encountered in the preparation of the report, due to differences in approaches and cultural, religious and regional barriers”.
Social development is narrowly defined in the Human Development Report 2010: “It is the process of expanding people’s freedom to live long, healthy and creative lives, the freedom to pursue other goals that they believe have value; to participate actively in achieving justice and sustainable development on our common planet3. Development is seen as a process, not of increasing well-being, but of “expanding freedom” to pursue goals of individual value for each person. From this position, it is more common to speak about the level of social well-being – a complex and multifaceted phenomenon associated with a whole range of related categories: standard of living, quality of life, social well-being, values, social capital, social policy, public safety and others. The content of the concept “may vary depending on the disciplinary field and the theoretical approach preferred by specific researchers” (Maksimov et al., 2020).
In the considered definitions and approaches it is difficult to identify the structural components of social development in relation to territorial socioeconomic systems (country, regions, municipalities) for its further assessment and adoption of appropriate management decisions. Therefore, we propose to consider the concept of social development from the position of management theory.
Management approach to assessing the level of social development of territorial socio-economic system
Social development management, based on the classical concept of “management”, is the impact of subjects (public authorities of different levels, economic entities, organizations, institutions providing services to the population, other public organizations and institutions) on the management object with a certain purpose. From the point of view of the structural component, the objects
-
3 Human Development Report 2010. The real wealth of nations: Pathways to human development. Moscow: Ves’ Mir, 2010. P. 22.
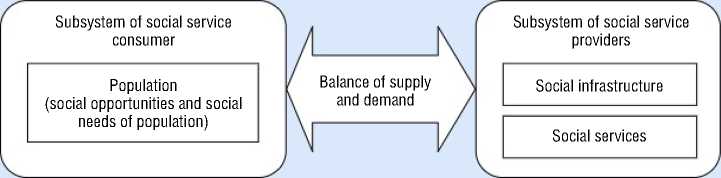
of management of social development of the territory are the population itself as a consumer of social services and the subsystem of social service providers, i.e. the social sphere ( Fig. 1 ).
At the same time, the population is not just a total mass of service recipients, but a set of individual consumers who differ both in the nature of their needs (depending on their place of residence, sex, age, category, etc.) and in the opportunities to meet them (the ability to pay for social services based on their financial capacity, territorial or other access to services, etc.).
In addition to the population, the object of management of social development of the territory is the social sphere. In our understanding, the social sphere includes a set of social services (actions to provide assistance to a citizen in order to improve his/her living conditions) and the infrastructure that ensures their provision. The services themselves can be divided into services that provide sociocultural (health care, education, culture, culture, sports, leisure, social protection, ritual support) and socio-economic (housing and communal services, consumer services, passenger transport, communications, retail trade, catering, etc.) needs.
The main goal of social sphere management is to ensure the population’s access to social services in accordance with individual needs and demands in a particular territory. The goals of subsystems can be distinguished separately. For the population, the goal, in addition to meeting the need for social services, is the growth of social opportunities (income growth, unemployment reduction, increasing the availability of social services, etc.). The goals of the social sphere subsystem (they can be conditionally called also the goals of social policy) are to improve the quality and expand the variety of social services provided in the territory; to support the necessary level and quality of life, reproduction of the labor force; to create conditions for the self-realization of citizens, including the economic opportunity to realize their skills and
Figure 1. Object, subject and assessment indicators of social development of territorial socio-economic system
Subject of social development management
Government authorities (federal, regional, local)
Institutions providing social services
Economic entity
Other organizations
Object of social development management
Management mechanism
Population well-being assessment (material well-being)
Assessment of quality of life (non-material aspects of social well-being)
Assessment of social infrastructure development of the territory
Assessment of availability and quality of social services in a particular territory
Parameter of external (objective) assessment of social development of the territory
Parameters of internal (subjective) assessment of social development of the territory
Subjective assessment of income sufficiency satisfaction of needs
Subjective assessment of opportunities for self-development of a person in a particular territory
Assessment of accessibility, openness, quality of social infrastructure by population
Satisfaction of population with the process and result of the provision of social services
Source: own compilation.
abilities; to use the potential of the social sector for the development of the economy.
In accordance with this approach, the assessment of the social development rate of the territorial socio-economic system consists of four components: material well-being / population income; quality of life; social infrastructure; availability and quality of social services. All these parameters can be assessed both from an objective point of view (on the basis of formalized quantitative indicators, for example, regional statistics) and with the help of subjective assessment of specific individuals living in the territory. In this study, we will consider the external (objective) assessment of the level of social development of territorial socio-economic systems on the example of Russian regions.
Methodological aspects of assessing the level of social development in a region
In general, when assessing the level of social development / well-being, the income approach prevails (Graham, 2016), since it is material wellbeing that is the key factor in the development of the social sphere and positive social well-being
In addition to the obvious indicators of poverty level, average per capita population income, subsistence minimum, other indicators of social vulnerability of the population are used as indicators of material well-being, welfare, such as the amount of income sufficient to feed the household (Christakopoulou et al., 2001), financing unexpected expenses due to illness, death, natural disasters (Terraneo, 2016) or even buying a second home (Popova, Pishniak, 2017), the number of children dependent on unemployment benefits (Leskosek, 2012), wearing holey shoes (Salmond et al., 2006) and others.
A. Sen (Sen, 1976) was one of the first to estimate population welfare of a certain territory taking into account the purchasing power in the form of a multiplicative function, where the amount of income per capita was adjusted by the Gini coefficient (income inequality coefficient). In the work of C.I. Jones, P.J. Klenow this function takes into account consumption, inequality, free time and life expectancy (Jones, 2015). In Russian studies, this model was adapted by M.Yu. Malkina for regional economies (formula 1) (Malkina, 2017).
Yt DtCI
St = 17 x F x-xn-Gt),(1)
lxli Y
Yt where – GRP per capita in the i-th region;
D-”‘
-
-7 — share of personal income in GRP in the i-th Yi . cl . , ,,
region; c— index that takes into account the price level in the i -th region (ratio of the cost of a fixed set of consumer goods and services in the country to the cost of a similar set in the region);
(1 – G i ) – indicator that takes into account the level of income differentiation in the i -th region ( G i – intra-regional Gini coefficient).
In a number of works, this multiplicative function was adjusted by a composite environmental index (Zabelina, 2022) and a coefficient to take into account the level of income of legally working citizens calculated by personal income tax (Glazyrina et al., 2020). Some elements of the function were replaced by other indicators, such as the Gini coefficient by the Atkinson index, which takes into account the diminishing marginal utility of income (Atkinson, 1970).
Within the framework of the study, we will use the model of A. Sen, adapted by M.Yu. Malkina for regional economies (Malkina, 2017). However, from our point of view, the social development of the region cannot be assessed only by the level of material income of the population. According to VCIOM surveys, a good material condition is only in sixth place in the rating of what determines human happiness (after having a family; health and life of one’s own and close ones; general life satisfaction; a good job; having children)4.
In this regard, to assess the level of social development of the region, we propose to adjust the modified welfare function of A. Sen taking into account other components of the object of social management: quality of life, social infrastructure and social services (formula 2).
SD i = S i x I q L x I S1 x I ss , (2)
where SDi – level of social development of a region; Si – indicator of material well-being of a region according to the modified function A. Sen; IQL – adjustment coefficient that takes into account the difference in the quality of life of regions; ISI – coefficient taking into account the level of social infrastructure development; ISS – adjustment coefficient that takes into account the difference in accessibility of social services.
Adjustment coefficient for differences in the quality of life of regions
The topic of assessing the quality of life is a separate independent layer of research both from the position of internal content and its impact on the social and economic development of territories (Woodhouse, 2006), the level of poverty, etc. (Mubangizi, 2003).
It is obvious that the indicators determining the quality of life include, first of all, indicators related to the results of the development of certain social spheres: health care, education, housing and utilities, etc. For example, health care is the following: life expectancy (Murgas, Klobucnik, 2016; Nissi, Sarra, 2018), life expectancy (Mata, Clara Costa, 2020), mortality rate (Deas et al, 2003), etc.; education: enrollment – average number of students per class (Lee, Huang, 2007), illiteracy (Sirgy, 2011), duration of education (Marchante et al., 2006), quality of schools (Christakopoulou et al., 2001), etc. In poor countries, access to quality health and education can also be income-dependent (Capmourteres et al., 2019).
The same category includes indicators of basic livelihoods: access to clean, hot and safe water, toilet and sanitation facilities, improved sewerage and waste management systems, availability of electricity, etc. (Mulenga et al., 2018). (Mulenga et al., 2018), as well as indicators reflecting the degree of security of life activities: crime rate, environmental security, etc. From the point of view of assessing the quality of life in Russian regions, some of the above indicators are not suitable. For example, the assessment of the educational potential of the population of the regions using literacy indicators at the current stage of development is quite controversial.
In our study we selected five indicators, taking into account the availability in official statistics that allow reflecting to a certain extent the quality of life of regions:
-
1) life expectancy, years (an indicator whose value is influenced by natural increase, morbidity, and access to health care and other social services);
-
2) migration growth rate per 10,000 people, which takes into account the attractiveness of the territory for able-bodied population forming its future human capital (indirectly reflects a set of characteristics of social attractiveness of the region);
-
3) crime rate – number of crimes registered in the reporting period, units per 1,000 people (an indicator that determines the safety of life of the population);
-
4) share of the Russian population provided with quality drinking water from centralized water supply systems, %;
-
5) number of students enrolled in bachelor’s, specialist and master’s degree programs per 10,000 people. The indicator characterizes the formation of future labor potential in the region, accumulated both inside and outside the region .
Coefficient that takes into account the level of social infrastructure development
Traditional publicly available indicators of socio-economic development individually do not reflect the qualitative characteristics of social infrastructure development. For example, in a region with a high level of provision of children with places in preschool educational institutions, there may be a situation when the buildings themselves are in a state of disrepair, or there is a lack of personnel with appropriate qualifications, or there is a strong differentiation in the availability of kindergartens by municipalities. Indicators of provision of the population with retail space of modern formats, doctors of all specialties may be limited by the factors of territorial accessibility. Therefore, the “non-social” indicator density of public roads with hard surface was included among the indicators of social infrastructure development, which indirectly reflects the infrastructure component of territorial accessibility. It is necessary to take into account in the aggregate several indicators that characterize social infrastructure from different sides. Composition of indicators:
-
1) number of doctors of all specialties per 10,000 people (characterizes in general the level of infrastructure development and accessibility of health care services);
-
2) provision of preschool children with places in organizations engaged in educational activities under preschool education programs, supervision and care of children, places per 1,000 children;
-
3) provision of the population with trade areas of modern formats per 1,000 people (an indicator characterizing the development of the sphere of trade and services of the population);
-
4) density of public roads with hard surface, km of tracks per 1,000 km2 of territory (an indicator not directly related to social infrastructure, but indirectly characterizing the infrastructure affecting the availability of social services and the quality of life);
-
5) the share of the housing stock area provided with all types of improvement in the total area of the housing stock of the constitute entities of the Russian Federation (as one of the factors of development of the housing and communal services system in the region, affecting the quality of life)5.
Coefficient that takes into account the difference in accessibility of social services
A number of foreign studies prove the existence of the influence of the availability of social services on the social development of the territory. The results show that residents of suburban and rural areas are more affected by social services, especially the elderly and people with low incomes (Tang et al., 2023).
In terms of selection of indicators, there are problems with the availability of statistical base. Indicators for assessing the quality and satisfaction with the provision of services are not assessed every year, information on the availability of services in electronic form is available only for the last three years. Therefore, the availability of social services was indirectly assessed using the following indicators:
-
1) share of population aged 15–72 who interacted with state and local government bodies, as a percentage of the total population of that age in the corresponding constituent entity of the Russian Federation (an indicator characterizing the level of development of interaction with the state to receive services, including social services);
-
2) level of satisfaction of the population aged 15–72 with the quality of provided state and
-
5 Housing conditions: statistical information. Available at: https://rosstat.gov.ru/statistics/zhilishhnye_usloviya (accessed: June 15, 2023).
municipal services in electronic form by constituent entities of the Russian Federation, as a percentage of the total population aged 15–72 who used the Internet to receive state and municipal services – options “fully satisfied” and “satisfied”;
3) share of households with access to the Internet as a percentage of the total number of households in the region (as a factor of accessibility of receiving services electronically).
Since the selected indicators on the basis of which they are calculated I QL , I SI , I SS are multidimensional, they have been normalized separately for “positively directed” (life expectancy, etc.) and “negatively directed” (crime rate):
P i =
Xi Xmin Xmax-Xmin
P i =
Xmax Xi
Xmax Xmin
, (3)
where Xi , Xmax , Xmin – actual, maximum and minimum values by regions for a certain period.
I QL , I SI , I SS were determined as the arithmetic mean between the individual indicators. This fact made it possible to level zero values for a number of regions, which inevitably arise during normalization.
Source data for calculations for indicators of the first and second groups are obtained from reports of the Federal State Statistics Service6. Indicators of the third group are based on the data of the sample federal statistical observation on the use of information technologies and information and telecommunication networks by the population7. The time period of the analysis is from 2014 to 2021 – the period of availability of the data of selective federal statistical observation on the use of information technologies and information and telecommunication networks by the population.
-
6 Socio-economic situation of the constituent entities of the Russian Federation. Available at: https://rosstat.gov.ru/ regional_statistics (accessed: June 15, 2023).
-
7 Selective federal statistical observation on the use of information technologies and information and telecommunication networks by the population. Available at: https://gks.ru/free_doc/new_site/business/it/ikt22/index . html (accessed: June 15, 2023).
-
We excluded the Republic of Crimea and Sevastopol from the calculations due to the lack of comparable information for a number of regions. The Arkhangelsk and Tyumen oblasts were considered without autonomous okrugs.
Research results
A. Sen’s modified multiplicative welfare function is based on the average per capita gross regional product adjusted for the standard of living (Tab. 1) .
The leaders in the multiplicative welfare function (the first 10) are the Arctic regions: Yamalo-Nenets, Nenets, Chukotka autonomous okrugs, the Republic of Sakha (Yakutia), the Tyumen Oblast was added to them; as well as the Sakhalin Oblast, the federal cities of Moscow and Saint Petersburg. The Moscow Oblast and the Republic of Tatarstan were also included in the list.
However, the results of calculations do not fully reflect the welfare of the population of these regions. In the Northern and Far Eastern regions, wages are strongly influenced by regional coefficients and northern allowances. At the same time, high values of average per capita income and wages are not an automatic “insurance against poverty”. For instance, in the regions of the Russian Arctic that were on the list of leaders (the Republic of Sakha, Nenets and Chukotka Autonomous Okrugs), the poverty rate exceeds the maximum critical value (9.9, 9.7, 8.8%, respectively, in 2018, with the range of the maximum critical value of the indicator from 2 to 7%) (Korchak, 2020). Only in Yamalo-Nenets Autonomous Okrug the poverty rate is at the upper limit of the acceptable range (6.2%). The share of poor households in these regions is more than 45.0% (in Nenets Autonomous Okrug – 63.3%). Provision
Table 1. Values of the components of the A. Sen’s modified function by groups of regions in 2021
|
Yi / Ni |
Di / Yi |
CI / CIi |
1-Gi |
Si |
|
|
GROUP 1. 10 leading regions |
|||||
|
Yamalo-Nenets АО |
1050.8 |
0.31 |
0.83 |
0.56 |
153.5 |
|
Nenets АО |
1242.2 |
0.17 |
0.83 |
0.58 |
100.0 |
|
Moscow |
287.5 |
0.60 |
0.72 |
0.58 |
72.1 |
|
Saint Petersburg |
135.5 |
0.71 |
0.94 |
0.59 |
53.7 |
|
Republic of Sakha (Yakutia) |
162.2 |
0.60 |
0.83 |
0.64 |
51.7 |
|
Chukotka АО |
206.1 |
0.68 |
0.62 |
0.59 |
51.5 |
|
Republic of Tatarstan |
118.6 |
0.60 |
1.16 |
0.61 |
50.6 |
|
Sakhalin Oblast |
161.6 |
0.57 |
0.87 |
0.60 |
47.7 |
|
Tyumen Oblast without АО |
136.9 |
0.51 |
1.09 |
0.62 |
46.8 |
|
Moscow Oblast |
82.8 |
1.09 |
0.93 |
0.62 |
51.4 |
|
Average in group 1 |
358.4 |
0.58 |
0.88 |
0.60 |
67.9 |
|
GROUP 2. 10 regions with the worst welfare function indicators |
|||||
|
Kirov Oblast |
35.3 |
0.94 |
1.11 |
0.67 |
24.5 |
|
Smolensk Oblast |
49.9 |
0.73 |
1.09 |
0.62 |
24.3 |
|
Republic of Mordovia |
52.2 |
0.59 |
1.20 |
0.64 |
23.6 |
|
Ivanovo Oblast |
21.4 |
1.54 |
1.09 |
0.65 |
23.1 |
|
Altai Krai |
37.4 |
0.90 |
1.08 |
0.63 |
23.0 |
|
Chechen Republic |
17.6 |
1.78 |
1.09 |
0.63 |
21.3 |
|
Ulyanovsk Oblast |
38.6 |
0.76 |
1.11 |
0.65 |
21.1 |
|
Jewish Autonomous Oblast |
40.8 |
0.81 |
0.90 |
0.67 |
20.0 |
|
Kurgan Oblast |
28.3 |
0.91 |
1.11 |
0.65 |
18.6 |
|
Republic of Kalmykia |
31.4 |
0.83 |
1.06 |
0.66 |
18.5 |
|
Average in group 2 |
35.3 |
0.98 |
1.08 |
0.65 |
21.8 |
|
Source: own compilation. |
|||||
Figure 2. Change in the average value of A. Sen’s modified function by groups of Russian regions in 2000–2021
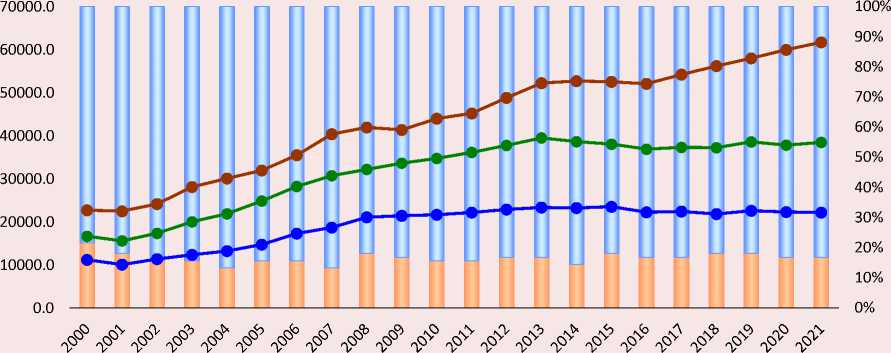
■ ■ Share of regions not exceeding the average level, % (right scale)
■ ■ Share of regions exceeding the average level, % (right scale)
• Average value of the function for 10 leading regions, rubles
• Average value for 10 regions with the worst indicators of the welfare function, rubles
—•—Average value for all regions of Russia, rubles
Source: own compilation.
of the population with good-quality drinking water (meeting mandatory safety requirements) in the Arctic regions did not exceed 68% as of 2018 (in Chukotka Autonomous Okrug – 49.8%) (Korchak, 2020).
The list of lagging regions includes the Ivanovo, Smolensk, Kirov, Ulyanovsk, Kurgan oblasts, Chechnya, Kalmykia and Mordovia, Altai Krai and the Jewish Autonomous Oblast.
The interregional gap between the indicators draws attention. Over the 20-year period, more than 80% of regions have a level of welfare according to the multiplicative function of A. Sen below average. The leading regions are developing faster than the lagging regions (Fig. 2) .
In addition, for the Russian Federation as a whole, the growth of the level of material wellbeing has actually stopped since 2013, in 2021 this indicator is 3.5% below the level of 2013. In the Kurgan Oblast, the level of social well-being decreased by 20.3%, in Altai Krai – by 13.7%, in the Ulyanovsk Oblast – by 9.8%.
In general, the welfare function does not reflect the social development of the region, as it does not take into account other components of the population’s quality of life (life expectancy, health, education, etc.), the state of the region’s social infrastructure and the population’s access to it; to a greater extent, it shows only the average population income due to economic development, partially adjusted for purchasing power and the degree of social stratification.
Adjustment for the quality of life
Table 2 presents the values of normalized structural components of the corrective indicator of the quality of life.
Table 2. Adjustment for selected indicators of the quality of life, 2021
|
Federal District |
Si |
LE |
MG |
CR |
WA |
NS |
I QL |
Si QL |
|
Central |
105.4 |
0.28 |
0.39 |
0.61 |
0.87 |
0.43 |
0.52 |
54.5 |
|
Northwestern |
126.4 |
0.28 |
0.40 |
0.46 |
0.75 |
0.29 |
0.44 |
55.0 |
|
South |
93.3 |
0.36 |
0.33 |
0.59 |
0.69 |
0.45 |
0.48 |
45.1 |
|
North Caucasian |
78.0 |
0.62 |
0.28 |
0.79 |
0.79 |
0.34 |
0.56 |
44.0 |
|
Volga |
92.7 |
0.30 |
0.31 |
0.59 |
0.91 |
0.45 |
0.51 |
47.2 |
|
Ural |
199.1 |
0.33 |
0.36 |
0.50 |
0.80 |
0.31 |
0.46 |
92.0 |
|
Siberian |
101.8 |
0.22 |
0.30 |
0.38 |
0.81 |
0.43 |
0.43 |
43.7 |
|
Far Eastern |
104.5 |
0.17 |
0.32 |
0.32 |
0.72 |
0.29 |
0.37 |
38.3 |
|
Position of the region among 83 constituent entities of the Russian Federation by individual components |
||||||||
|
Yamalo-Nenets АО |
1 |
10 |
24 |
30 |
41 |
82 |
53 |
2 |
|
Moscow |
2 |
3 |
34 |
17 |
1 |
1 |
1 |
1 |
|
Nenets АО |
3 |
36 |
23 |
74 |
78 |
83 |
78 |
9 |
|
Tyumen Oblast |
4 |
21 |
8 |
52 |
60 |
14 |
25 |
3 |
|
Khanty-Mansi MАО |
5 |
9 |
10 |
25 |
39 |
75 |
30 |
5 |
|
Republic of Dagestan |
79 |
2 |
62 |
3 |
71 |
65 |
9 |
58 |
|
Pskov Oblast |
80 |
73 |
31 |
41 |
54 |
56 |
57 |
75 |
|
Republic of Mari El |
81 |
35 |
37 |
18 |
3 |
30 |
20 |
68 |
|
Ivanovo Oblast |
82 |
33 |
26 |
26 |
31 |
32 |
38 |
71 |
|
Republic of Kalmykia |
83 |
12 |
79 |
14 |
83 |
10 |
75 |
80 |
|
Designations: LE – life expectancy, years; MG – migration growth rate per 10,000 inhabitants; CR – number of crimes registered in the reporting period, units per 1,000 people of the population; WA – share of population provided with quality drinking water from centralized water supply systems, %; NS – number of students enrolled in bachelor’s, specialist, and master’s degree programs per 10,000 inhabitants; I QL adjusting coefficient of the quality of life (arithmetic mean of LE, MG, CR, WA, NS), Si QL – indicator of material well-being of the population of the region according to the modified function of A. Sen, adjusted for the quality of life coefficient. Source: own compilation. |
||||||||
The results of a number of studies on Russian regions, including time lag, indicate an extremely strong positive impact of the population’s monetary income on the life expectancy indicator, as well as a negative impact of unemployment and living standards (Fedotov, 2021). In our case, the situation is not so unambiguous: the normalized life expectancy indicator in the regions of the North Caucasian Federal District is more than 2.2 times higher than in the Central and Northwestern federal districts. Perhaps, the situation is partly distorted by the fact that Table 2 shows data for 2021 – the year of coronavirus infection spread and sharp increase in morbidity, which affected the value of the life expectancy indicator. However, in the Republic of Dagestan the average life expectancy value remains at 74.5 years during 2000–2021, which is higher than in Moscow. In general, in the regions of the Russian Arctic leading in terms of average per capita cash income, life expectancy is below the Russian average.
The subjects of the North Caucasian Federal District are also characterized by low crime rates, especially the Chechen Republic. Since 2010, the region has recorded the lowest value of this indicator – on average for 2010–2021 it is 5.7 times lower than in Russia, and the crime rate has decreased by 42.8% since 2010. The highest crime rate is observed in the regions of the Far Eastern Federal District, especially in Zabaikalsky Krai (more than 2.0 times higher than the average for
Russia, with the crime rate increasing by 8.1% since 2010). In the financially prosperous regions of the Russian Arctic, the crime rate is also higher than the Russian average, especially in Nenets Autonomous Okrug.
Comparison of the indicators of migration growth and the level of average per capita income of the population also reflects the lack of a clear correlation. In 2021, Moscow was in 34th place, while the Ivanovo Oblast (the penultimate place according to A. Sen’s welfare function) was in 26th place. Perhaps, the situation is distorted by the year of assessment. Nevertheless, the analysis of the average value of the migration growth rate in 2000–2021 clearly reflects the influence of “centerperiphery” relations on migration indicators. The highest migration growth is observed in the Moscow (1st place) and Leningrad (2nd place) oblasts. Migration attractiveness of these regions is associated with territorial proximity to economic, educational and cultural centers of Russia, relatively low cost of housing, developed road and transport infrastructure.
The assessment methodology included an indicator of the share of the population provided with quality drinking water from centralized water supply systems, reflecting the basic living needs of the population. According to Rosstat data, only 56.3% of residents of Nenets Autonomous Okrug have access to centralized water supply, while Yamalo-Nenets, Khanty-Mansi autonomous okrugs and the Tyumen Oblast occupy positions below 39th place (although they are considered “socially developed”).
To assess the development rate of the education system in the Russian regions, which forms the future labor potential, the indicator of the number of students enrolled in bachelor’s, specialist and master’s degree programs per 10,000 people was included in the group of corrective indicators. Obviously, the leaders in this indicator are the educational centers of Russia: Moscow, Saint Petersburg and the Tomsk Oblast. “Rich” regions, as a rule, act as recipients of labor resources: in Yamalo-Nenets, Nenets and Khanty-Mansi autonomous okrugs there are practically no institutions of higher education, they occupy 82, 83 and 75 places among Russian regions, respectively.
After adjusting the initial indicator of the welfare level by the multiplicative function of A. Sen to the indicators of the quality of life, the ranking of regions changed insignificantly. The high base of average per capita income of the subjects of the Russian Arctic allowed them to remain in the top ten. However, there are exceptions: Nenets Autonomous Okrug, which ranks 3rd according to A. Sen’s multiplicative function of well-being, ranked 78th according to the quality of life indicator. The Republic of Dagestan, on the contrary, entered the top 10 regions in terms of quality of life.
Adjustment for the state of social infrastructure
The values of normalized structural components of the corrective indicator of the level of social infrastructure development are presented in Table 3 .
In general, by the highlighted indicators, the situation differs from the previous adjustment for the quality of life. There are individual deviations caused by objective factors. For example, the low rating of Moscow in the provision of preschool children with places in kindergartens is determined by the population of the city of one million people. Low density of public roads with hard surface in the Arctic regions is associated with natural and climatic conditions, terrain and low density of settlement of residents. Nenets Autonomous Okrug is characterized by low values of indicators of provision of the population with retail space of modern formats and a low share of the housing stock provided with all types of amenities. According to the aggregate of all five indicators, Nenets Autonomous Okrug ranks 66th among 83 Russian regions under consideration.
Table 3. Adjustment for certain indicators of social infrastructure development, 2021
|
Federal District |
Si |
ND |
PC |
PRS |
DPR |
HS |
I Si |
Si SI |
|
Central |
105.4 |
0.29 |
0.61 |
0.46 |
0.20 |
0.60 |
0.43 |
45.4 |
|
Northwestern |
126.4 |
0.34 |
0.74 |
0.43 |
0.14 |
0.53 |
0.44 |
55.4 |
|
South |
93.3 |
0.28 |
0.49 |
0.29 |
0.10 |
0.55 |
0.34 |
32.0 |
|
North Caucasian |
78.0 |
0.28 |
0.27 |
0.16 |
0.22 |
0.70 |
0.32 |
25.3 |
|
Volga |
92.7 |
0.30 |
0.62 |
0.52 |
0.10 |
0.58 |
0.43 |
39.5 |
|
Ural |
199.1 |
0.32 |
0.62 |
0.55 |
0.04 |
0.64 |
0.44 |
86.7 |
|
Siberian |
101.8 |
0.32 |
0.52 |
0.47 |
0.03 |
0.39 |
0.35 |
35.2 |
|
Far Eastern |
104.5 |
0.43 |
0.63 |
0.25 |
0.01 |
0.42 |
0.35 |
36.2 |
|
Position of the region among 83 constitute entities of the Russian Federation by individual components |
||||||||
|
Yamalo-Nenets АО |
1 |
7 |
18 |
49 |
81–83* |
4 |
11 |
2 |
|
Moscow |
2 |
3 |
78 |
16 |
1 |
6 |
2 |
1 |
|
Nenets АО |
3 |
23 |
11 |
76 |
81-83 |
60 |
66 |
6 |
|
Tyumen Oblast |
4 |
12 |
62 |
7 |
59 |
39 |
9 |
5 |
|
Khanty-Mansi АО |
5 |
11 |
34 |
4 |
77 |
10 |
3 |
4 |
|
Republic of Dagestan |
79 |
71 |
83 |
83 |
15 |
75 |
83 |
83 |
|
Pskov Oblast |
80 |
81 |
29 |
15 |
28 |
79 |
60 |
72 |
|
Republic of Mary El |
81 |
78 |
17 |
73 |
41 |
40 |
68 |
77 |
|
Ivanovo Oblast |
82 |
56 |
9 |
39 |
24 |
43 |
25 |
68 |
|
Republic of Kalmykia |
83 |
38 |
33 |
77 |
62 |
72 |
78 |
81 |
|
* Last position together with Nenets and Chukotka AOs Designations: ND – number of doctors of all specialties per 10,000 people in the population; PC – provision of preschool children with places in organizations engaged in educational activities under preschool education programs, supervision and care of children, places per 1,000 children; PRS – provision with retail space of modern formats (ratio of retail space of modern formats to the average annual population multiplied by 1,000 people); DPR – density of public roads with hard surface, km of tracks per 1,000 square kilometers of territory; HS – share of the area of the housing stock provided with all types of improvement in the total area of the housing stock of the constituent entity of the Russian Federation, %; Si SI – indicator of material well-being of the population of the region according to the modified function of A. Sen. Source: own compilation. |
||||||||
Of the regions in the last five according to A. Sen’s multiplicative welfare function, only the Ivanovo Oblast has a sufficiently high level of social infrastructure development (25th place in 2021). All other regions are in positions no higher than 60th place.
However, given the difference in the initial base of average per capita cash income and purchasing power of population, the final result of adjusting the value of the welfare function does not change significantly.
Adjustment for availability and quality of social services
Table 4 presents the values of the normalized structural components of the corrective indicator of availability and quality of social services.
The choice of publicly available indicators characterizing the quality and accessibility of social services was even more complicated. One of the parameters chosen was the very presence of interaction between population and authorities, indirectly reflecting the readiness and effectiveness of relations, including in the format of receiving state and municipal services. In the Central Federal District 88.0% of the population aged 15–72 years interact with state and local authorities, including 100% in Moscow. Whereas in the Far Eastern Federal District this indicator is 68.7%, including only 28.2% in the Magadan Oblast.
Approximate proportions are maintained by federal districts and by the indicator of satisfaction with the quality of services. However, there are
Table 4. Adjustment for certain indicators of availability and quality of social services, 2021
|
Federal District |
Si |
I |
S |
Int |
I SS |
SiSS |
|
Central |
105.4 |
0.70 |
0.80 |
0.33 |
0.61 |
64.5 |
|
Northwestern |
126.4 |
0.65 |
0.77 |
0.37 |
0.60 |
75.4 |
|
South |
93.3 |
0.75 |
0.83 |
0.61 |
0.73 |
67.8 |
|
North Caucasian |
78.0 |
0.57 |
0.65 |
0.59 |
0.61 |
47.3 |
|
Volga |
92.7 |
0.73 |
0.79 |
0.29 |
0.60 |
56.1 |
|
Ural |
199.1 |
0.85 |
0.66 |
0.51 |
0.67 |
134.2 |
|
Siberian |
101.8 |
0.69 |
0.75 |
0.39 |
0.61 |
62.1 |
|
Far Eastern |
104.5 |
0.51 |
0.67 |
0.59 |
0.59 |
61.4 |
|
Position of the region among 83 constituent entities of the Russian Federation by individual components |
||||||
|
Yamalo-Nenets АО |
1 |
3 |
5 |
1 |
1 |
1 |
|
Moscow |
2 |
1 |
35 |
4 |
2 |
2 |
|
Nenets АО |
3 |
34 |
79 |
35 |
61 |
4 |
|
Tyumen Oblast |
4 |
30 |
72 |
72 |
69 |
7 |
|
Khanty-Mansi АО |
5 |
8 |
54 |
5 |
4 |
3 |
|
Republic of Dagestan |
79 |
52 |
58-59 |
25 |
36 |
69 |
|
Pskov Oblast |
80 |
21 |
57 |
43 |
37 |
70 |
|
Republic of Mari El |
81 |
71 |
83 |
83 |
83 |
83 |
|
Ivanovo Oblast |
82 |
10 |
58-59 |
70 |
40 |
74 |
|
Republic of Kalmykia |
83 |
42 |
27 |
9 |
11 |
59 |
Designation: I – share of population aged 15–72 who interacted with state and local authorities, %; S – level of satisfaction of the population aged 15–72 with the quality of state and municipal services provided in electronic form by constituent entities of the Russian Federation, %; Int – Internet access, % of total number of households in the region; Si SS – indicator of material well-being of the population of the region according to the modified function of A. Sen, adjusted for the quality of life coefficient of the population. Source: own compilation.
exceptions. If in the Tyumen Oblast, Khanty-Mansi and Nenets Autonomous Okrugs low values of satisfaction can be explained by really low quality of service provision, then in Moscow the low rating is most likely due to higher requirements of local residents and more stringent reporting system for this indicator.
Nenets Autonomous Okrug and the Tyumen Oblast also rank low in the rating in terms of the share of households with Internet access. This indicator indirectly reflects one of the formats of service accessibility – the ability of the population to receive state and municipal services in electronic form.
In general, the selected indicators do not relate directly to social services, only indirectly reflecting their availability and quality. Adjustment of the value of the basic multiplicative function of A. Sen does not significantly affect the final dispersion of regions by the level of social development.
Thus, having adjusted the initial indicator of material well-being of the region’s population according to the multiplicative function of A. Sen by the integral indicators of the quality of life, social infrastructure, quality and accessibility of services, we obtain the final indicator of the level of social development of Russian regions (Tab. 5) .
Inter-territorial differences in the final indicator of social development are decreasing: if when assessing the level of material well-being of the population according to the modified function of A. Sen, the share of regions with a value below the average was 80%, while with the adjustments this value decreased to 70%.
Table 5. Final adjustment for quality of life, social infrastructure and social services, 2021
|
Federal District |
Si |
I QL |
I SI |
I SS |
SDi |
|
Central |
105.4 |
0.52 |
0.43 |
0.61 |
14.38 |
|
Northwestern |
126.4 |
0.44 |
0.44 |
0.60 |
14.68 |
|
South |
93.3 |
0.48 |
0.34 |
0.73 |
11.12 |
|
North Caucasian |
78.0 |
0.56 |
0.32 |
0.61 |
8.53 |
|
Volga |
92.7 |
0.51 |
0.43 |
0.60 |
12.20 |
|
Ural |
199.1 |
0.46 |
0.44 |
0.67 |
27.00 |
|
Siberian |
101.8 |
0.43 |
0.35 |
0.61 |
9.35 |
|
Far Eastern |
104.5 |
0.37 |
0.35 |
0.59 |
7.98 |
|
Yamalo-Nenets АО |
1 |
53 |
11 |
1 |
2 |
|
Moscow |
2 |
1 |
2 |
2 |
1 |
|
Nenets АО |
3 |
78 |
66 |
61 |
21 |
|
Tyumen Oblast |
4 |
25 |
9 |
69 |
6 |
|
Khanty-Mansi АО |
5 |
30 |
3 |
4 |
4 |
|
Republic of Dagestan |
79 |
9 |
83 |
36 |
79 |
|
Pskov Oblast |
80 |
57 |
60 |
37 |
66 |
|
Republic of Mari El |
81 |
20 |
68 |
83 |
82 |
|
Ivanovo Oblast |
82 |
38 |
25 |
40 |
60 |
|
Republic of Kalmykia |
83 |
75 |
78 |
11 |
77 |
Designation: SDi – final indicator of the level of social development of the region, based on the assessment of the material well-being of the population of the region, taking into account the quality of life, the development of social infrastructure and social services.
Source: own compilation.
Final results
The disadvantage of the normalization procedure is that the indicators, after bringing them into a comparable form, do not reflect the dynamics of change over the years. We can only see the annual change in the rating of the territory in the general list of regions. This characterizes only the annual statics of the level of social development.
In order to see the dynamics, we can compare the average annual values of the indicator of the level of social development for each of Russia’s regions for the analyzed period and the change in this indicator in 2021 compared to 2014. Based on the results of the comparison, we can distinguish four groups of regions.
-
1. Leading regions of social development, which have an average annual value of the final indicator of the level of social development (taking into account the quality of life, social infrastructure, quality and accessibility of social services) in 2014–
2021 of more than 20 thousand rubles/person and the growth of the indicator for the period under review from 150.1% and above. This group includes Moscow, Saint Petersburg, the Moscow Oblast, Yamalo-Nenets and Khanty-Mansi autonomous okrugs, the Tyumen Oblast, and the Republic of Tatarstan. Their leading positions are ensured primarily by their resource potential and level of economic development.
-
2. Socially developing regions include a group of subjects with rather low average annual values of the final level of social development (below 10 thousand rubles/person), but high growth rates (from 150.1% and above): the Vologda, Novgorod oblasts, the republics of Kalmykia, Dagestan, Chechnya, Tyva, Altai Krai, the Amur, Bryansk, Ivanovo, Kaluga oblasts, the Republic of Adygea, Krasnodar Krai, the republics of Kabardino-Balkaria, Karachay-Cherkessia, the Orenburg, Saratov oblasts, and Chukotka Autonomous Okrug.
-
3. Krasnoyarsk Krai, the Kemerovo and Lipetsk oblasts, which have quite high levels of social well-being, but a low level of its growth compared to 2014–2021, can be attributed to the socially slowing regions (average annual values of the final level of social development are higher than 10 thousand rubles/person, but the growth of the indicator for 2014–2021 is below 20%).
-
4. The group of socially underdeveloped regions with a low level and dynamics of social development includes the Republic of Mari El, Zabaikalsky Krai, the Magadan, Kostroma, Kurgan oblasts, and the Jewish Autonomous Oblast.
Conclusions
In modern Russian research there is a large number of different ratings, methodologies, approaches to the assessment of socio-economic development of territories. To choose a certain set of indicators, to normalize and converge them into an integral indicator, and to obtain a certain rating as an output is a simple, clear, and, as a consequence, speculative way of assessing the spatial development of Russian regions. It is much more difficult to separate these two areas of assessment, select indicators and separately assess the level of social and economic development of territorial systems.
As the research results show, the level of social development of the territory is mostly determined through economic indicators of development (gross regional product per capita), adjusted for interregional differences in purchasing power. An example is the welfare function of population of A. Sen, which in one or another variation is widely used to analyze the social development of territories. Based on the calculations for 83 constitute entities of the Russian Federation for 2000– 2021, we found that the function does not reflect other important factors of social development of regions. For example, in the Arctic territories with a high level of well-being, many social problems remain unresolved: poverty, unemployment, social stratification, difficult access to quality social services and basic resources to ensure the necessities of life (drinking water, etc.). All this creates significant risks both for distorting the overall picture of “socially developed” and “rich” territories, and for making strategic decisions to ensure long-term socio-economic stability of the country as a whole.
In this regard, it is necessary to take a more thorough approach to the formation of methodology, selection of indicators and methods for assessing the level of social development of territories. The authors proposed to adjust the modified welfare function of A. Sen taking into account other components of the object of social management: quality of life, social infrastructure, quality and availability of social services. The final calculations with adjustments for 83 regions of Russia more adequately reflect the actual inter-territorial differences in the level of social development. For example, Nenets Autonomous Okrug, which ranks 3rd according to A. Sen’s welfare function, after adjustments went down to 21st place, as it occupies low positions in the rating of the RF constitute entities according to the integral indicators for assessing the quality of life, social infrastructure, quality and accessibility of social services.
This approach allows assessing the development level of the territory not only from the point of view of the population’s income, but also from the point of view of other objectives of social policy: improving the quality and expanding the diversity of social services; increasing the quality of life; developing social infrastructure; using the potential of the social sector for economic development, etc.
Further analysis of the obtained results and their interpretation will help to formulate recommendations to take into account the features of each of the selected groups of regions when building a model of the social component of the integrated development of the regional system and measures for its development.
References Assessing the level of social development in Russia’s regions: methodological and applied aspects
- Andreeva I.A. (1995). Istoricheskaya kontseptsiya N.A. Rozhkova [Historical Concept of N.A. Rozhkov]. Yekaterinburg: In-t istor. i arkheol. Ural, otd-e RAN.
- Arkhangel’skii L.M. (1985). Marksistskaya etika: predmet, struktura, osnovnye napravleniya [Marxist Ethics: Subject, Structure, Main Directions]. Moscow: Mysl’.
- Atkinson A.B. (1970). On the measurement of inequality. Journal of Economic Theory, 2(3), 244–263.
- Belous A.O. (2010). The philosophical concept of K.D. Kavelin. Filosofiya sotsial’nykh kommunikatsii, 1(10), 96–102 (in Russian).
- Capmourteres V., Shaw S., Miedema L. et al. (2019). A complex systems framework for the sustainability doughnut. People Nat., 1(4), 497–506. DOI: https://doi.org/10.1002/pan3.10048
- Christakopoulou S., Dawson J., Gari A. (2001). The community well-being questionnaire: Theoretical context and initial assessment of its reliability and validity. Soc. Indic. Res., 56(3), 321–351. DOI: https://doi.org/10.1023/A: 1012478207457
- Deas I., Robson B., Wong C., Bradford M. (2003). Measuring neighbourhood deprivation: A critique of the index of multiple deprivation. Environ. Plann. Govern. Policy, 21(6), 883–903. DOI: https://doi.org/10.1068/c0240
- Fedotov A.A. (2021). Life expectancy: Analyzing the state and looking for influencing factors. Mezhdunarodnyi zhurnal gumanitarnykh i estestvennykh nauk=International Journal of Humanities and Natural Sciences, 7(58), 131–137. DOI: 10.24412/2500-1000-2021-7-131-137 (in Russian).
- Glazyrina I.P., Zabelina I.A., Faleichik A.A., Faleichik L.M. (2020). Application of simulation modeling in assessing the levels of social well-being in the Eastern regions of the Russian Federation. Vestnik Zabaikal’skogo gosudarstvennogo universiteta=Bulletin of ZabGU, 26(6), 125–136. DOI: 10.21209/2227-9245-2020-26-6-125-136 (in Russian).
- Graham C. (2016). Subjective well-being in economics. In: The Oxford Handbook of Well-being and Public Policy. New York: Oxford University Press. DOI: 10.1093/oxfordhb/9780199325818.013.14
- Korchak E.A. (2020). Threats to the sustainable development of the Russian Arctic: Poverty. Arktika i Sever=Arctic and North, 40, 47–65. DOI: 10.37482/issn2221-2698.2020.40.47 (in Russian).
- Lee Y.-J., Huang C.-M. (2007). Sustainability index for Taipei. Environ. Impact Assess. Rev., 27(6), 505–521. DOI: https://doi.org/10.1016/j.eiar.2006.12.005
- Leskosek V. (2012). Social determinants of health: The indicators for measuring the impact of poverty on health. Zdravstveno Varstvo., 51(1), 21–32. DOI: https://doi.org/ 10.2478/v10152-012-0004-1
- Maksimov A.M., Tutygin A.G., Malinina K.O. et al. (2022). Issues of the methodology for assessing social well-being in contemporary Russia. Ekonomicheskie i sotsial’nye peremeny: fakty, tendentsii, prognoz=Economic and Social Changes: Facts, Trends, Forecast, 15(2), 138–155. DOI: 10.15838/esc.2022.2.80.9 (in Russian).
- Malkina M.Yu. (2017). Social well-being of the Russian Federation regions. Ekonomika regiona=Economy of Regions, 13(1), 49–62. DOI: doi.org/10.17059/2017–1-5 (in Russian).
- Marchante A.J., Ortega B., Sanchez J. (2006). The evolution of well-being in Spain (1980–2001): A regional analysis. Soc. Indic. Res., 76(2), 283–316. DOI: https://doi.org/ 10.1007/s11205-005-1097-6
- Mata M., Clara Costa I.D.C. (2020). Composition of the health inequality index analyzed from the inequalities in mortality and socioeconomic conditions in a Brazilian state capital. Ciencia Saude Coletiva, 25(5), 1629–1640. DOI: https://doi.org/10.1590/1413- 81232020255.33312019
- Mitina I.D. (1997). Filosofsko-kul’turologicheskaya kontseptsiya P.N. Milyukova [Philosophical and Cultural Concept of P.N. Milyukov]. Moscow: Izd-vo MPGU.
- Mubangizi B.C. (2003). Drawing on social capital for community economic development: Insights from a South African rural community. Community Development Journal, 38(2), 140–150.
- Mulenga B.P., Tembo S.T., Richardson R.B. (2018). Electricity access and charcoal consumption among urban households in Zambia. Dev. South. Afr., 36(5), 585–599. DOI: https://doi.org/10.1080/0376835x.2018.1517036
- Murgaš F., Klobučník M. (2016). Does the quality of a place affect well-being? Ekologia Bratislava, 35(3), 224–239. DOI: https://doi.org/10.1515/eko-2016-0018
- Nissi E., Sarra A. (2018). A measure of well-being across the Italian urban areas: An integrated DEA-entropy approach. Soc. Indic. Res., 136(3), 1183–1209. DOI: https://doi. org/10.1007/s11205-016-1535-7
- Parsons T. (2004). Sistema sovremennykh obshchestv [The System of Modern Societies]. Moscow: Aspekt Press.
- Popova D., Pishniak A. (2017). Measuring individual material well-being using multidimensional indices: An application using the gender and generation survey for Russia. Soc. Indic. Res., 130(3), 883–910. DOI: https://doi.org/10.1007/s11205-016- 1231-7
- Salmond C., Crampton P., King P., Waldegrave C. (2006). NZiDep: A New Zealand index of socioeconomic deprivation for individuals. Soc. Sci. Med., 62(6), 1474–1485. DOI: https://doi.org/10.1016/j.socscimed.2005.08.008
- Sen A. (1976). Real national income. Review of Economic Studies, 43(1), 19–39. DOI: doi.org/10.2307/2296597
- Shcherban’ N.V. (1996). Civilization approach to history in the works of V.O. Klyuchevsky. In: Rossiya v XX veke: Sud’by istoricheskoi nauki [Russia in the 20th Century: The Fates of Historical Science]. Moscow: Nauka (in Russian).
- Sirgy J.M. (2011). Theoretical perspectives guiding QOL Indicator projects. Soc. Indic. Res., 103(1), 1–22. DOI: https://doi.org/10.1007/s11205-010-9692-6
- Spencer H. (2013). Osnovaniya sotsiologii. Dannye sotsiologii. Induktsiya sotsiologii [Principles of Sociology. The Data of Sociology. Inductions of Sociology]. Moscow: URSS.
- Tang Zh., Xie M., Chen B. et al. (2023). Do social and ecological indicators have the same effect on the subjective well-being of residents? Applied Geography, 157, 1–14. DOI: https://doi.org/10.1016/j.apgeog.2023.102994
- Terraneo M. (2016). A longitudinal study of deprivation in European countries. Int. J. Sociol. Soc. Policy., 36(5/6), 379–409. DOI: https://doi.org/10.1108/IJSSP-05-2015- 0058
- Woodhouse A. (2006). Social capital and economic development in regional Australia: A case study. Journal of Rural Studies, 22, 83–94.
- Zabelina I.A. (2022). Assessment of the socio-ecological and economic welfare of the Russian Eastern regions using Sen’s expanded function. Ekonomika regiona=Economy of Regions, 18(2), 398–412. DOI: 10.17059/ekon.reg.2022-2-7 (in Russian).
