Assessing the professional structure of the employed population in Russian regions on the basis of economic complexity concept

Author: Afanasiev M.Yu., Gusev A.A., Nanavyan A.M.
Journal: Economic and Social Changes: Facts, Trends, Forecast @volnc-esc-en
Section: Regional economy
Article in issue: 6 т.16, 2023.
Free access
The skill level of an employee has a significant impact on the formation of employment indicators and economic development. Current scientific discussions are devoted to assessing the prospects for development of the labor market, identifying professions that will be in demand in the future and that will determine the possibilities for the development of human capital. The aim of the work is to assess the economic complexity of professional employment structure and the economic complexity of professional groups of the employed population in Russia’s regions, and to identify trends in the development of regional labor markets on this basis. The assessment of the economic complexity of the regional structure of professional employment can be considered as a characteristic of the level of human capital development, since the region’s ability to bring the develop of professional groups with high estimates of economic complexity to the level of strong ones depends on the knowledge accumulated by employees. Estimates of the economic complexity of professional employment structure in Russia’s regions and the economic complexity of professional groups were obtained according to the data for 2018, 2020 and 2021. For five professional groups, the grades of economic complexity assessments do not change over time, including those for doctors of sciences, candidates of sciences and specialists of the highest skill level. For four professional groups, the ranks change slightly - no more than by a unit. The ranks of complexity assessments change significantly for two professional groups: “managers” (the position of this professional group is improving) and “employees of the service and trade sector and protection of citizens and property” (their position is deteriorating). The ranking of the professional group “unskilled workers” is higher than the rankings of the three groups of skilled workers. The rankings of assessments of the complexity of professional groups correspond to existing opinions about the average level of human capital development among representatives of these groups of the employed population. Estimates of the economic complexity of the structure of professional employment and professional groups can be used to develop a methodology for choosing priority areas for diversifying the region’s economy.
Professional structure, complexity of the economy, human capital, region, assessment
Short address: https://sciup.org/147242475
IDR: 147242475 | UDC: 332.133 | DOI: 10.15838/esc.2023.6.90.5
Text of the scientific article Assessing the professional structure of the employed population in Russian regions on the basis of economic complexity concept
Professional training, employee’s skill level, and a set of production functions, which a specialist of different types activities performs, have a significant impact on the formation of employment indicators. The dependence of economic results strengthens from the degree of implementing workers’ abilities, knowledge, skills and competencies; occupational and skilled structure of employed population is one of the most important characteristics of human capital. The International Labour Organization identifies skill as “…the ability to carry out the tasks and duties of a given job”, and skill level as “a function of the complexity and range of tasks and duties to be performed in an occupation”1.
The literature notes significant shifts in occupational employment structure; the focus is on the analysis of groups with high skill level – professionals “as a special social group occupying a relatively high position in the stratification hierarchy of society due to the possession of such specific assets as knowledge and skills, the formation of which requires not only long-term training and experience, but also direct (money) or indirect (salary lost during the period of training) investments” (Tikhonova, 2020).
It is worth noting formally the skill serves as a guarantee for an employer that an employee has certain competencies, further improvement of which is aimed at professional training and retraining (Abuzyarova et al., 2019). The article
(Toksanbayeva, Popova, 2021) also emphasizes that to perform the work of a particular skill it is necessary to have education not lower than officially required, but not all the employed work in accordance with the educational status. The authors further point out that the mismatch between workers’ educational and qualification status is observed in all occupational groups, but mainly in favor of the level of education higher than the required one, which does not contradict the relevant professional standards. At the same time, it is most typical for the group of highly qualified specialists, leading in terms of average earnings (without the group of managers).
However, “the majority of professional jobs do not require updating knowledge and upgrading skills, as well as previous education and practical experience – at least in the opinion of people who occupy them. These jobs in more than 60% of cases do not involve professional development” (Tikhonova, 2020). Nevertheless, “...relatively high incomes, social security and the resource of influence allow speaking of most of them as the best quality jobs” (Tikhonova, 2020). At the same time, the researcher notes that the educational structure of the Russian labor force has changed faster than its professional or sectoral structure. There is a close relationship between levels of occupational skills and levels of education, but there is no strict mutually unambiguous correspondence (Gimpelson, Kapeliushnikov, 2022).
Changes in the structural characteristics of employment are manifested in the labor market after a certain period of time. Any type of activity requires training and formation of appropriate skills, including for low- or unskilled labor. As a rule, unskilled labor is usually defined as work involving a high expenditure of physical strength, while skilled labor is defined as predominantly mental work requiring significant intellectual input. It seems that this approach is limited, since intellectual work also results in physical expenditure, and physical effort is not realized without mental effort. In modern conditions, the active introduction of digital technologies requires new approaches to determining the role and importance of physical and mental labor, although it is recognized that new technologies will primarily replace physical labor.
The literature naturally discusses the question of whether there will be a gradual increase in the share of skilled labor and, at the same time, an erosion of low-skilled workers from the labor market, or whether a U-shaped scenario will be the determining factor, when the growth in the number of jobs for skilled labor is accompanied by a “subsidence in demand for middle-skilled workers” (Vishnevskaya, Zudina, 2017) and an increase in demand for occupations with relatively low skills, most of which are trade workers and unskilled workers, as well as equipment operators whose work is likely to be computerized in the coming years (Chernenko et al., 2017).
We should note that the main feature of unskilled work is considered to be its accessibility. Necessary knowledge, skills and abilities can be quickly mastered in the process of work, no special professional education is required. In the classifier of occupations, which is intended for conducting statistical surveys of population distribution by types of occupations, the group “unskilled workers” is singled out: cleaners and servants in houses, hotels and various institutions, as well as unskilled workers in agriculture, forestry, mining, construction, manufacturing and transportation (packers, loaders, laborers, garbage collectors and recyclers, etc.)2. These activities are assessed as non-prestigious, employers save on labor costs and wage levels are often low, although unskilled labor is in demand and, having gained professional experience and good skills, a worker can move to a better-paid job and a corresponding new position that does not require special professional education (e.g., managing a group of unskilled workers), which can serve as an incentive to improve education.
However, unskilled labor also has a negative impact on the economy: workers are more likely to make mistakes, allow defects, which leads to an increase in costs. In addition, employee’s skill competence affects the productivity and safety of labor, reducing the level of various risks and injuries at work. This is important not only for enterprises and organizations, but also characterizes the balance of the labor market at the level of the national economy and regions (Nanavyan, 2020). The use of new technologies and equipment, automation of production processes can improve the situation. These processes are closely related to sectoral and regional differences, which largely determine the opportunities for the development of regional economies, the creation of decent jobs, increasing the level of enterprises’ innovation activity and the human potential development.
Therefore, the economy’s development, including regional economy, involves the identification of promising areas of specialization and the formation of appropriate human resources. At the same time, as it is rightly noted in the article (Rumyantsev et al., 2022), “determination of promising economic specialization is a more complex procedure, which is difficult to carry out using only mathematical methods.... In order for the restructuring of the economy to lead to the activation of its dynamics, it is necessary to take into account the existing economic specialization of the region, to detect and eliminate “bottlenecks” of value chains (VC), to act through the formation of highly productive sectors with export orientation, but it is worth to balance the ratio of domestic and foreign markets”. We should also say that it can be done on the basis of comparative analysis, which allows not only identifying and determining trends, but also assessing the prospects for the development of the occupational employment structure, which is especially important for the labor market research.
In this regard, the aim of our work is to assess the economic complexity of the occupational employment structure and the economic complexity of occupational groups of the employed population in Russia’s regions, to identify on this basis the trends in the development of the regional labor markets.
The information base is the data of the sample survey of organizations (except small businesses) “On the number and needs of organizations in employees by occupational groups” of the Federal State Statistics Service, the results of which allow analyzing occupational and qualification structure of the number of employees, including the constitute entities of the Russian Federation, as well as data on the number of doctors and candidates of sciences in the RF regions3.
According to the Classificatory of Occupations OK 010-2014 (MSKZ-08) (OKZ), the survey presents the following occupational groups.
-
1. Managers.
-
2. Specialists of the highest skill level.
-
3. Specialists of the middle skill level.
-
4. Employees involved in the preparing and processing of documentation, accounting and servicing.
-
5. Employees of service and trade, protection of citizens and property.
-
6. Skilled agricultural, forestry and fishery workers.
-
7. Skilled workers in industry, construction, transportation and related occupations.
-
8. Operators of production plants and machines, assemblers and drivers.
-
9. Elementary occupations.
The objects of classification in OKZ are occupations. An occupation is understood as a type of labor activity carried out at a workplace with a relatively stable composition of labor functions (works, duties), generating earnings or income. Occupation includes any type of labor activity, both requiring and not requiring special training4.
Assessment methodology
To analyze the occupational employment structure in the region, we used the data on the number of employees of the organizations of the RF constituent entities by occupational groups, and revealed their comparative advantages on the basis of the indicator RCAk j .
Let us determine the RCAk j of identified comparative advantage (Balassa, 1965):
RCAk j = ( Zk j [ T. jzkj ) I CL kZkj I Tj< j zk j ) , (1)
where zk j — number of employees of occupational group j in region k;
RCAk j — ratio of share of occupational group j in total number of occupational groups of region k to the share of occupational group j in all regions of the total number of all occupational groups in the regions.
In accordance with the works (Balassa, 1965; Hausmann, Klinger, 2006), the indicator RCAkj can be used to identify comparative advantages of occupational groups in regions, for which the condition of the bottom constraint type is checked. If the value of RCAkj exceeds one, we will assume that occupational group j in region k has revealed comparative advantages in terms of the number of employees of organizations. Otherwise, there are no identified comparative advantages::
( 1, if RCAkj > 1;
akj = I 0, if RCAkj < 1. (2)
The matrix A = ( a k ^ contains data on occupational groups, which in different regions have comparative advantages in terms of the number of employees of organizations. The rows of this matrix correspond to regions, the columns – to occupational groups. An occupational group with the identified comparative advantages in the region will be called a strong occupational group of the region, the feature of which is that its share in the total number of employed population of the region is higher than the share of this group in the national labor market.
The vector ^ak j 1 , —, ak j m ) will be called the structure of strong occupational groups of region k. Further the matrix A = (a k;- ) will be considered as a formal description of regional structures of professional employment.
In the work, we consider the economic complexity of the skilled/occupational employment structure (for short, the economic complexity of the employment structure ) as a characteristic reflecting the development rate of the region’s human capital, which is determined by estimates of the economic complexity of strong occupational groups in the structure of its economy. Similarly, the “economic complexity of an occupational group” is a feature of the average level of human capital development of the representatives of this group and depends on the economic complexity of the occupational employment structures of those regions in which this occupational group is strong.
Let us denote the estimate of economic complexity of the occupational employment structure in region к by PSCIk ; the estimate of economic complexity of occupational group j by PGCI j . According to the economic complexity concept (Hausmann et al., 2006; Hidalgo, Hausmann, 2009; Hartmann et al., 2017; Afanasiev, Kudrov, 2021), these complexity estimates have the following properties. The economic complexity of a region’s employment structure is proportional to the average level of economic complexity of strong occupational groups in that region:
PSCIk = a^ryPGCI j , (3)
where qk0 = S j a k j — number of strong professionals in a region, r kj = — — weighting factor, Q uo a 1 — positive constant.
The economic complexity of an occupational group is proportional to the average level of economic complexity of occupational employment structures in the regions, in which the occupational group is strong:
PGCI j = a2^k^kPSCIk, (4)
where q j 0 = ^,k ak j — number of regions, in which the occupational group is strong, r^ = —— — weighting coefficient, a2 — positive constant. ^/0
The PSCI index measures the economic complexity of occupational employment structures in regions by combining information on the diversity of occupational employment structures (the number qk0 of strong occupational groups in a region) and the prevalence of occupational groups (the number q j 0 of regions in which an occupational group is strong). The idea behind the PSCI index is that the occupational employment structures of regions with high complexity scores are diversified, containing strong occupational groups with low prevalence and relatively high economic complexity scores, and therefore only a few regions have developed these occupational groups to the level of strong ones.
Regional occupational employment structures with relatively low estimates of economic complexity include strong occupational groups with relatively high prevalence and low estimates of economic complexity.
Let 5 = QPSCIk i , PSCIk 2 , ^^T be a vectorcolumn of assessments of the economic complexity of the region’s employment structure;
g = ^PGCl j 1 , PGC! j 2 , — )T is a vector-column of assessments of the economic complexity of occupational groups;
R 1 = ^rk j^ , R2 = ^ rj*k ) are weight matrices.
From relations (3) and (4) it follows that s = cii a2R i R2s , g = а 1 а 2Т?2 Д 1 у .
Thus, the assessments of economic complexity of employment structure in regions are components of the eigenvector of the matrix R 1 R 2, and the assessments of economic complexity of occupational groups are components of the eigenvector of the matrix R 2 R 1.
The matrices R 1 R 2 and R 2 R 1 are stochastic: their elements are non-negative and their sum over the rows is 1. Due to stochasticity, the matrix R 1 R 2 has an eigenvalue equal to 1 and an eigenvector corresponding to it, which consists of the same coordinates. In accordance with the approach to estimating economic complexity presented in the works (Hausmann and Rodrik, 2003; Sciarra et al., 2020), we will use the eigenvector of the matrix R 1 R 2, which corresponds to the second maximum eigenvalue, as estimates of the economic complexity of the regional employment structure. As estimates of the economic complexity of occupational groups we will use the eigenvector of the matrix R 2 R 1, which corresponds to the second maximum eigenvalue. It is worth noting that the estimates of economic complexity of the regional employment structure and occupational groups are relative. They do not depend on the scale of the regional economy, and they can take both positive and negative real values (Afanasiev, Kudrov, 2021).
Input data and results
Data structure. To assess the economic complexity of the occupational employment structure and the economic complexity of occupational groups of the employed population in Russia’s regions, we used Rosstat data on the list number of employees of organizations by occupational groups in the RF constituent entities for 2018, 2020 and 2021, which reflect the number of employed people in the regions by nine occupational groups in accordance with the All-Russian Classificatory of Occupations OK 010-2014. In addition, we took into account the data on the number of doctors and candidates of sciences in the RF constituent entities.
We considered each employee of an organization only in one of the occupational groups, so the number of the occupational group “specialists of the highest skill level” in each region was reduced by the total number of doctors and candidates of sciences. As a result, we used the data on 11 “occupational groups”, including the group of doctors of sciences and the group of candidates of sciences, for calculations (column (4) of Table P2 of the Appendix).
Calculation results. In accordance with the methodology described above, we obtained assessments of the economic complexity of regional employment structures and the economic complexity of occupational groups using data for
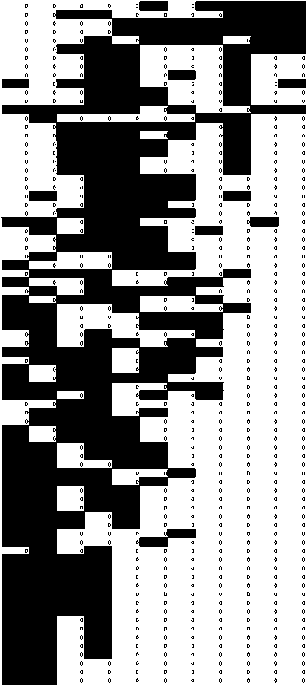
Source: own compilation.
Figure 1. Matrix 0-1 region – occupational group with rows ordered by PSCI and columns ordered by PGCI
2018, 2020 and 2021. Table P1 of the Appendix shows estimates of the economic complexity of occupational employment structures of 79 regions. The regions are grouped by federal districts and arranged in the order used by Rosstat. Table P2 of the Appendi x provides estimates of the economic complexity of occupational groups. The occupational groups are arranged in descending order of their complexity estimates for 2021, presented in column (5) of this table.
Figure 1 presents the 0-1 matrix describing the employment structure in Russia’s regions according to the data for 2021. The matrix rows correspond to regions, columns – to occupational groups. A dark cell means that the corresponding element ak j of the matrix is equal to 1, i.e. the occupational group is strong in the region. Otherwise, the matrix element is zero and the occupational group is not strong in the region. The rows of the matrix are ordered from bottom to top by increasing estimates of the economic complexity of the employment structure in PSCIk regions. The columns are ordered from left to right by increasing estimates of economic complexity of PGCI j occupational groups. The upper rows of the matrix contain significantly more units than the lower rows. Accordingly, regions with higher estimates of the economic complexity of occupational employment structures contain more strong occupational groups than regions with low estimates. The employment structures of these regions are more diverse.
Occupational groups with relatively high estimates of economic complexity PGCIj are strong predominantly in regions with relatively high estimates of economic complexity of employment structure. These occupational groups have relatively low prevalence estimates (columns (1–3) of Table P2 in the Appendix). Accordingly, the bottom right corner of the matrix is weakly filled with units. Occupational groups with relatively low estimates of economic complexity are strong predominantly in regions with relatively low estimates of economic complexity of employment structure, the upper left corner of the matrix is weakly filled with units. We can conclude that the structure of the matrix correctly reflects the idea of the approach to assessing economic complexity based on the concept of identified comparative advantages, which is represented in this study by formulas (1), (2), and the conditions of interrelation of estimates, represented by formulas (3), (4). We should note one important advantage of this approach: the possibility of obtaining interrelated assessments of the economic complexity of the regional employment structure and estimates of the economic complexity of occupational groups is provided5.
According to 2021 data, the calculations allow identifying the following five regions with the highest PSCIk assessments of the economic complexity of the employment structure (in decreasing order): the Tomsk Region, the Novosibirsk Region, Moscow, Saint Petersburg, and the Moscow Region. High scores are explained by the fact that the following occupational groups are strong in these regions: doctors of sciences, candidates of sciences, specialists of the highest skill level. These occupational groups have relatively low prevalence (column 3 of Table P2) and high estimates of economic complexity (column 5 of Table P2). The position of these regions in the ranking is stable. The standard deviation of the difference between the ranks of economic complexity estimates for 2018 and 2021 is 14.3. The mathematical expectation is close to zero. The modulus change in the ranks of estimates within the standard deviation will be assessed as insignificant. For the above five regions, the ranks of their estimates in the time period under consideration change insignificantly (Tab. P1).
We note three regions with the lowest scores in 2021: the Arkhangelsk Region, the Perm Territory, and the Tyumen Region. In each of them, there are only two strong occupational groups: skilled workers in industry, construction, transportation and workers in related occupations; operators of production plants and machines, assemblers and drivers. These occupational groups have high prevalence (column 3 of Table P2) and relatively low estimates of economic complexity (column 5 of Table P2). For the Arkhangelsk Region, the change in the ranking of PSCIk assessments is significant. The position in the rating of the Perm Territory and the Tyumen Region is stable over time.
Over the period under review, 8 regions marked with (**) in the first column of Table P1 significantly improved their positions in the PSCIk score ranking. According to the results of the clustering of regions by GRP structure presented in (Afanasiev et al., 2018), most of these regions have developed manufacturing sectors. At the same time, 10 regions marked with (*) significantly worsened their positions in the ranking. Most of them have developed extractive industry sectors. A significant change in the assessment of economic complexity of the region’s occupational employment structure is the result of a change in the structure of strong occupational groups. The change in this assessment may be influenced, although to a lesser extent, by the change in the assessments of economic complexity of occupational groups presented in columns 5–7 of Table P2.
Table 1 shows the correlation coefficients of assessments of economic complexity of the occupational employment structure in the regions, calculated on the basis of three-year data. These estimates are highly stable over time.
Table 2 shows the correlation coefficients of the assessments of economic sophistication of the 11 occupational groups based on three years of data. The estimates of occupational groups are also stable over time.
On the left, using data for 2020, Figure 2 shows the relationship between assessments of the economic complexity of occupational groups (column (6) of Table P2 of the Appendix) and their prevalence rates (column (2) of Table P2). On the right, using data for 2021, Figure 2 presents the relationship between the estimates of occupational groups from column (5) of Table P2 of the Appendix (on the ordinate axis) and their prevalence rates from column (3) of the same table.
Table 1. Correlation coefficients of assessments of economic complexity of the occupational employment structure
|
PSCI 2018 |
PSCI 2020 |
PSCI 2021 |
|
|
PSCI 2018 |
1 |
0.836 |
0.799 |
|
PSCI 2020 |
0.866 |
1 |
0.837 |
|
PSCI 2021 |
0.838 |
0,886 |
1 |
|
Below the main diagonal are Pearson correlation coefficients. Above the main diagonal are Spearman rank correlation coefficients. Source: own compilation. |
|||
Table 2. Correlation coefficients of assessments of economic complexity of occupational groups
|
PGCI 2018 |
PGCI 2020 |
PGCI 2021 |
|
|
PGCI 2018 |
1 |
0.936 |
0.927 |
|
PGCI 2020 |
0.976 |
1 |
0.973 |
|
PGCI 2021 |
0.974 |
0.979 |
1 |
|
Below the main diagonal are Pearson correlation coefficients. Above the main diagonal are Spearman rank correlation coefficients. Source: own compilation. |
|||
Figure 2. Dependence of assessments of economic complexity of occupational groups on their prevalence (abscissa axis – prevalence of occupational group, ordinate axis – estimate of economic complexity of occupational group)
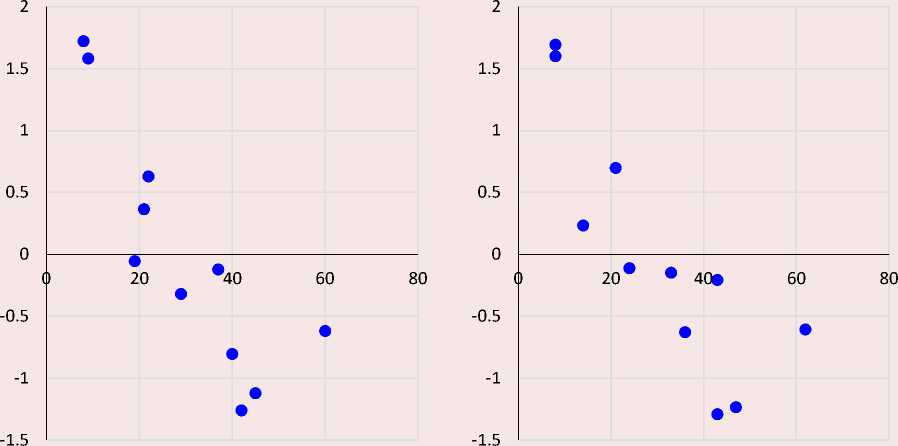
Source: own compilation.
An increase in the prevalence of an occupational group is accompanied by a downward trend in the estimate of its economic complexity. The exception is the group of unskilled workers, which has the highest prevalence and a higher estimate of economic complexity than the three groups of skilled workers. These features are also characteristic of the results obtained from the 2018 data (see columns (7) and (1) of Table P2 of the Appendix, respectively).
Of particular interest is the analysis of changes in the ranks of professional groups’ assessments over time. For the three years under consideration, the ranks are shown in columns (8–10) of Table P2 of the Appendix. We can note that for five professional groups the ranks do not change over time, including for doctors and candidates of sciences, as well as specialists of the highest skill level. For four occupational groups the ranks do not change by more than one unit, i.e. insignificantly. The ranks of economic complexity estimates change significantly
(by more than one unit) for two professional groups: “managers” (the position of the occupational group improves against the background of its decreasing prevalence) and “employees in the service and trade, protection of citizens and property” (the position worsens against the background of its increasing prevalence). Changes in the occupational employment structures in the regions and the characteristics of the prevalence of occupational groups may be caused by long-term trends in the structure of the labor market. The impact of the coronavirus pandemic is also possible, since the greatest impact of the restrictions was on the employment of workers in the market services sector, where “the key risk factors for job loss were the need for direct contact with the consumer in carrying out a particular type of activity and the presence of obstacles to the transition to a remote mode of work” (Soboleva, Sobolev, 2021).
The assessments of economic complexity of PGClj occupational groups and the ranks of these estimates correspond to the existing opinions about the average level of human capital development of representatives of these groups. A similar interpretation of occupational complexity estimates was used in the analysis of occupational employment structures in the UK municipalities and US states (Mealy et al., 2019). The PSCIk economic complexity estimates of the occupational employment structures of regions and their ranks can be considered as relative characteristics of the level of human capital development, since the ability of a region to develop to the level of strong occupational groups with high economic complexity estimates depends on the accumulated knowledge. The possibility of interpreting estimates of economic complexity of production structures as estimates of the level of human capital development of countries and regions was noted, for example, in the work (Hidalgo, 2015).
The assessment of the occupational group “unskilled workers” attracts attention. It is higher than the estimates of the three groups of skilled workers. However, this circumstance correctly reflects the current view of the assessment of human capital of unskilled workers. In the work (Vishnevskaya, Zudina, 2017), which analyzes the future state of the occupational structure of the labor force in European countries, it is noted that “the demand for the labor of unskilled workers is expected to increase, which will be observed against the background of a decrease in the number of skilled working professions”. Some researchers (see, for example, Crouch, 2010) consider the expansion of demand for unskilled labor “as a confirmation of the U-shaped scenario of the development of the occupational structure, when not only qualified specialists are in demand, but also workers with low levels of education and training”. The work (Walter, Lee, 2022) points out that the nature of digitalization is changing particularly dynamically in a number of occupations. First of all, these are jobs with a large share of non-standard manual tasks, the accelerated digitalization of which leads to the obsolescence of competencies. The authors indicate that a number of specialized skills are becoming obsolete faster than general competencies. At the same time, the contribution of education to productivity is most intensively depreciated in high-tech jobs characterized by a large share of nonstandard interactive and manual, as well as standard cognitive tasks.
The estimates of economic complexity of occupational groups we obtained do not contradict the hypothesis about the U-shaped character of human capital development of occupational groups (see Fig. 2). The unskilled labor force constitutes a significant part of the labor market, performing everyday production tasks that do not depend on technical abilities or skills. According to statistics published by the Bureau of Labor Statistics6, unskilled and low-skilled labor will account for the maximum increase in jobs between 2014 and 2024.
We have assessed the relationship between the economic complexity of the regional employment structure for 2020 and the increase in GRP per capita, which is calculated as the difference of GRP per capita for 2020 and 2018. Several regions with developed extractive industries, in which the change in GRP per capita over the period is more than 100 thousand rubles and is explained by the high share of natural rent in GRP, were excluded from the consideration (Afanasiev et al., 2018; Afanasiev, Kudrov, 2020). These are the Murmansk and Tyumen regions, the Republic of Sakha (Yakutia), the Kamchatka Territory, the Khabarovsk Territory, the Magadan and Sakhalin regions, and the Chukotka Autonomous Area. The Pearson correlation coefficient of assessments of economic complexity of employment structure and GRP per capita growth is 0.285. we can observe their significant interrelation.
The research assessed the relationship between the economic complexity of the regional employment structure and the per capita income. We excluded the Tyumen Region and the Chukotka Autonomous Area from consideration. The Pearson correlation coefficient of assessments of economic complexity of employment structure and per capita income is 0.332 according to 2020 data and 0.301 according to 2021 data. The obtained results do not contradict the possibility of interpreting the estimates of economic complexity of the regions’ occupational employment structures as characteristics of the level of human capital development, which affect the level of material wellbeing.
Estimates of the economic complexity of occupational employment structures can be used to develop a methodology for selecting priority directions of diversification of the regional economy (Afanasiev, Il’in, 2022). This methodology allows justifying the choice of a sector for the development to the level of a strong sector in the region using a number of criteria based on assessments of the economic complexity of the structures of strong sectors in the regions. The number of criteria can be expanded using assessments of the economic complexity of employment structures and occupational groups, considering them as characteristics of the level of human capital development, influencing the level of material well-being. The application of the methodology of selecting priority directions of diversification using digital technologies in regional situation centers can ensure the coordination of decisions made by regions in choosing the directions of diversification to improve the economic security of the country.
Conclusions
We obtained assessments of the economic complexity of the regional occupational employment structure and the economic complexity of occupational groups based on data for 2018, 2020 and 2021. The 0–1 region is occupational group matrix with rows and columns ordered by the values of these estimates correctly reflects the idea of the approach to assessing economic complexity based on the concept of identified comparative advantages.
The regions with the highest assessments of the economic complexity of the occupational employment structure are the regions in each of which the strongest occupational groups are: doctors of sciences, candidates of sciences, specialists of the highest skill level. These occupational groups have relatively low prevalence and high estimates of economic complexity. The regions with the lowest estimates are those with only two strong occupational groups in each: skilled industrial, construction, transportation, and related occupations; manufacturing plant and machine operators, assemblers, and drivers. These occupational groups have high prevalence and relatively low estimates of economic complexity.
For each year considered, an increase in the prevalence of an occupational group is accompanied by a downward trend in its complexity score. A characteristic exception is the group of unskilled workers, which has the highest prevalence and a higher assessment of complexity than the three groups of skilled workers.
For the majority of regions, the ranks of assessments of economic complexity of occupational employment structures did not change or changed insignificantly over the period under review. Eight regions, predominantly with developed sectors of manufacturing industry, significantly improved their positions in the ranking due to the diversification of occupational employment structures. Ten regions with developed extractive industries worsened their positions in the rating.
For five occupational groups, the ranks of complexity scores did not change over time, including for doctors of sciences, candidates of sciences and specialists of the highest level of qualification. For four professional groups the ranks change by no more than one unit, i.e. insignificantly. The ranks of complexity scores change significantly for two occupational groups: “managers” (the position of the occupational group improves against the background of a decrease in its prevalence) and “workers in the sphere of service and trade, protection of citizens and property” (the position worsens against the background of an increase in prevalence).
The obtained assessments of economic complexity of professional groups correspond to the existing opinions about the average level of human capital development of the representatives of these groups. The assessment of economic complexity of the region’s occupational employment structure can be considered as a characteristic of the development level of its human capital, since the region’s ability to develop to the level of strong occupational groups with high complexity assessments depends on the accumulated knowledge. The development level of the region’s human capital is directly related to occupational and skill differentiation, which is characterized by the diversity of the occupational employment structure. The spread of telecommunications and digital technologies at this stage contributes to the increase in the level of human capital development of unskilled workers, the growth of the number of jobs in this occupational group.
Assessments of the economic complexity of the occupational employment structure and occupational groups can be used to develop the methodology for choosing priority directions of diversification of the regional economy. The validity of decisions can be increased by using estimates of the economic complexity of the occupational employment structure and economic complexity of occupational groups as characteristics of the level of human capital development, which affect the level of material well-being.
References Assessing the professional structure of the employed population in Russian regions on the basis of economic complexity concept
- Abuzyarova D., Belousova V., Krayushkina Zh. et al. (2019). The role of human capital in science, technology and innovation. Forsait=Foresight and STI Governance, 13(S2), 107–119. DOI: 10.17323/2500-2597.2019.2.107.119 (in Russian).
- Afanas’ev M.Yu., Aivazyan S.A., Kudrov A.V. (2018). On accounting for natural rent in regional development indicators. Vestnik TsEMI, 1, 7 (in Russian).
- Afanasiev M.Yu., Ilin N.I. (2022). New guidelines for choosing priority areas of economic diversification based on a system of sustainable centers. Ekonomika i matematicheskie metody=Economics and Mathematical Methods, 58(4), 29–44. DOI: 10.31857/S042473880023017-7 (in Russian).
- Afanasiev M.Yu., Kudrov A.V. (2020). Methodology for assessing the socio-economic development of the constituent entities of the Russian Federation. In: Gracheva M.V. (Ed.). Aktual’nye napravleniya i metody analiza ekonomicheskikh system [Current Directions and Methods of Analyzing Economic Systems]. Moscow: Ekonomicheskii fakul’tet MGU imeni M.V. Lomonosova (in Russian).
- Afanasiev M.Yu., Kudrov A.V. (2021). Economic complexity and embedding of regional economies’ structure. Ekonomika i matematicheskie metody=Economics and Mathematical Methods, 57(3), 67–78. DOI: 10.31857/S042473880016410-0 (in Russian).
- Balassa B. (1965). Lafayrade liberalization and “revealed” comparative advantage. The Manchester School, 33, 99–123.
- Chernenko I.M, Kel’chevskaya N.R., Pelymskaya I.S., Almusaedi Kh.K.A. (2021). Opportunities and threats of digitalization for human capital development at the individual and regional levels. Ekonomika regiona=Economy of Regions, 17(4), 1239–1255. DOI: 10.17059/ekon.reg.2021-4-14 (in Russian).
- Crouch C. (2010). Occupational Structure and Social Models in European Societies: Working Paper. University of Warwick Business School.
- Gimpelson V.E., Kapeliushnikov R.I. (2022). Dinamika struktury rabochikh mest v Rossii: polyarizatsiya, uluchshenie, zastoi?: preprint WP3/2022/05/ [Dynamics of the Structure of Jobs in Russia: Polarization, Improvement, Stagnation?: Preprint WP3/2022/05/]. Moscow: Izd. dom Vysshei shkoly ekonomiki (in Russian).
- Gimpelson V.E., Zudina A.A., Kapeliushnikov R.I. et al. (2017). Professii na rossiiskom rynke truda: Analiticheskii doklad NIU VShE [Professions in the Russian Labor Market: Analytical Report of the National Research University Higher School of Economics]. Moscow: Natsional’nyi issledovatel’skii universitet “Vysshaya shkola ekonomiki”. ISBN 978-5-7598-1576-1
- Hartmann D., Guevara M.R., Jara-Figueroa C. et al. (2017). Linking economic complexity, institutions, and income inequality. World Development, 93, 75–93. DOI: 10.1016/j.worlddev.2016.12.020
- Hausmann R., Hwang J., Rodrik D. (2007). What you export matters. Journal of Economic Growth, 12(1), 1–25. DOI: 10.1007/s10887-006-9009-4
- Hausmann R., Klinger B. (2006). Structural Transformation and Patterns of Comparative Advantage in the Product Space. Available at: http://www.tinyurl.com/2bdm7aml (accessed: September 8, 2023).
- Hausmann R., Rodrik D. (2003). Economic development as self-discovery. Journal of Development Economics, 72(2), 603–633. DOI: 10.3386/w8952
- Hidalgo C. (2015). Why Information Grows: The Evolution of Order, from Atoms to Economies. CFA Institute.
- Hidalgo C.A., Hausmann R. (2009). The building blocks of economic complexity. Proceedings of the National Academy of Sciences, 106(26), 10570–10575. DOI: 10.1073/pnas.0900943106
- Mealy P., Farmer J.D., Teytelboym A. (2019). Interpreting economic complexity. Science Advances, 5(1). DOI: 10.1126/sciadv.aau1705
- Nanavyan A.M. (2020). Work experience and length of service of the population in various regions of Russia. Obshchestvo i ekonomika, 9, 49–58. DOI: 10.31857/S020736760011347-0 (in Russian).
- Rumyantsev N.M., Leonidova E.G., Gubanova E.S. (2022). Defining sectoral priorities of the region’s structural transformation by searching for promising economic specializations. Ekonomicheskie i sotsial’nye peremeny: fakty, tendentsii, prognoz=Economic and Social Changes: Facts, Trends, Forecast, 15(6), 94–109. DOI: 10.15838/esc.2022.6.84.5 (in Russian).
- Sciarra C., Chiarotti G., Ridolfi L., Laio F. (2020). Reconciling contrasting views on economic complexity. Nature Communications, 11, 3352. DOI: 10.1038/s41467-020-16992-1
- Soboleva I.V., Sobolev E.N. (2021). Open and latent unemployment in the context of the pandemic. Ekonomicheskie i sotsial’nye peremeny: fakty, tendentsii, prognoz=Economic and Social Changes: Facts, Trends, Forecast, 14(5), 186–201. DOI: 10.15838/ esc.2021.5.77.11 (in Russian).
- Tikhonova N.E. (2020). Russian professionals: Specifics of jobs and of human potential. Sotsiologicheskie issledovaniya=Sociological Studies, 10, 71–83. DOI: 10.31857/S013216250010300-3 (in Russian).
- Tkachenko A.A., Ginoyan A.B. (2021). Assessment of the occupational structure of employed in regions. Ekonomika regiona=Economy of Regions, 17(4), 1224–1238. DOI: 10.17059/ekon.reg.2021-4-13 (in Russian).
- Toksanbaeva M.S., Popova R.I. (2021). Characteristics of industries determining high differentiation of wages in Russia. Narodonaselenie=Population, 24(3), 162–174. DOI: 10.19181/population.2021.24.3.13 (in Russian).
- Vishnevskaya N.T., Zudina A.A. (2017). Occupational structure in European countries: What do forecasts predict? Vestnik mezhdunarodnykh organizatsii: obrazovanie, nauka, novaya ekonomika=International Organizations Research Journal, 12(4), 109–129. DOI: 10.17323/1996-7845-2017-04-109 (in Russian).
- Walter S., Lee J. (2022). How susceptible are skills to obsolescence? A task-based perspective of human capital depreciation. Forsait-T=Foresight and STI Governance, 16(2), 32–41. DOI: 10.17323/2500-2597.2022.2.32.41 (in Russian).
