Assessment and attainment of program educational objectives for post graduate courses

Author: Akash Rajak, Ajay Kumar Shrivastava, Shashank Bhardwaj, Arun Kumar Tripathi
Journal: International Journal of Modern Education and Computer Science @ijmecs
Article in issue: 2 vol.11, 2019.
Free access
As per the guidelines issued by NBA (National Board of Accreditation) of All India Council of Technical Education (AICTE) Outcome Based Education is implemented in engineering colleges of India. The outcome based evaluation model measures the performance of UG and PG programs. The performance is based on calculating attainments of Program Educational Objectives (PEOs) and Program Outcomes (PO).In this paper we will discuss the process for the attainments of POs and PEOs for Post Graduate program approved by AICTE, India. The attainments are calculated by applying direct and indirect tools. The attainments summaries are generated Batch wise and a comparison of different Batches were made. The attained PEOs and POs would help in accomplishing Vision and Mission of the department.
Course Outcome, Outcome Based Education, PO, PEO, Data Analytics
Short address: https://sciup.org/15016829
IDR: 15016829 | DOI: 10.5815/ijmecs.2019.02.04
Text of the scientific article Assessment and attainment of program educational objectives for post graduate courses
Published Online February 2019 in MECS DOI: 10.5815/ijmecs.2019.02.04
-
I. Introduction
The Outcome Based Education (OBE) is adopted by AICTE from Washington Accord on 13 June 2014[1]. All the technical institutions of India are following OBE as per the guidelines issued by AICTE. OBE is outcome based learning in which the engineering graduates are trained so as to have better knowledge, skill sets and attitudes. In OBE certain targets are set and teaching learning activities are properly planned and organized to achieve the targets. In case if there is any deviation from targets then gap analysis is performed. For continuous improvement targets are revised from time to time based on vision and mission of the department or institute. The
OBE process starts from defining vision and mission of the department in accordance to vision and mission of institute. The Program Educational Objectives (PEOs) and Program Outcomes (POs) are formulated as per vision and mission of institute and NBA graduate attributes. The next step is to design Course Outcomes (COs) for different courses and surveys like alumni, employer etc. A mapping of COs with POs is established having strong, moderate and weak correlation. In the research paper we will discuss the attainment process of PEOs and POs.
-
II. Background
The AICTE approved colleges in India follows OBE model which is adopted from Washington Accord [1,2]. The idea behind the implementation of OBE model is that graduate should posses a sound knowledge in the field but also can have global mobility and acceptance [3]. Malaysian engineering education also adopted outcome based education approach [4]. Bassi et al. [5] discussed the analysis of the students in different academic and non-academic activities by using OBE model. They examined the students whose targets were not achieved. Terang et al. [6] discussed the methodology to identify weak students for the subject Electromechanical Energy Conversion II. They took some corrective actions if the targets were not archived by the students [6]. The authors discussed about the methodology for the assessment of CO of an each and every student against pre-defined target [7]. Roy et al. [8] discussed an innovative approach to evaluate the CO's of the course Power Quality and its relationship with POs of Electrical Engineering. They further mapped the Cos with POs of the department.
Rajak et al. [9] discussed how to automate outcome based education for the attainment of PEOs and POs. Wong et al. [10] implemented OBE from the program design perspective and discusses importance of OBE in teaching. Tshai et al. [11] formulated the OBE process in integration with stakeholders and identified set of strategies for continuous quality improvement (CQI). The authors discussed an OBE framework and implemented it in Object-Oriented Software Development course [12]. The motivation of this research is to automate the outcome based process and to find the attainments of any PG program.
-
III. Attainment Process
The attainment process involves designing and calculating attainments of Program Educational Objectives, Program Outcomes and Course Outcomes.
It consists of following steps:
-
• Defining department Vision and Mission.
-
• Formulation of PEO and PO in alignment to Vision and Mission.
-
• Correlation between PEO and PO.
-
• Design of Course Outcome for different assessment tools like subjects, projects and various surveys.
-
• Establish mapping of CO with PO for different courses having strong (3), moderate (2) and weak (1) correlation.
-
• Calculate CO attainment from Figure 1 and 2.
-
• Finally predict PEO and PO attainments.
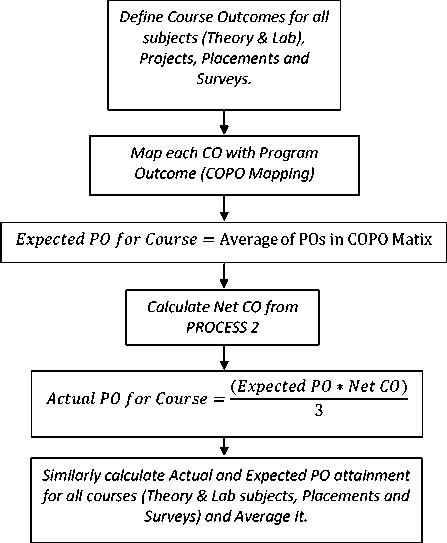
Fig.1. Process 1-PO Attainment
The Figure 1 gives the various steps involved in the attainment process. The process starts from defining
Course Outcomes for different courses, then establishing correlation between CO-PO and finally calculating the attained PO and PEOs.
The Figure 2 gives a detail on Net CO calculation. The Direct and Indirect tools were involved in calculating PEO and PO attainments. The Direct tools include various theory and practical subjects, projects and placements. The indirect tools consist of various surveys. In case of theory subjects the contribution of external is 70% and internal is 30% in calculating Net CO attainment. For placements and surveys a target is fixed and on that basis Net CO is calculated. For e.g. if the placement is more than or equal to 75% then the attainment is 3.
-
A. DIRECT TOOLS
SUBJECTS (Theory)
Internal:
Calculate average of all COs and scale it to 3.
External:
Calculate % of students having marks greater than or equal to class average.
If Per>=60% than Attainment=3
Else if Per>=50% than Attainment=2
Else Attainment=1
Net CO=
30%Internal Attainment+70%External Attainment
PLACEMENTS
Calculate Percentage of students placed.
If Per>=75% than Attainment=3
Else if Per>=60% than Attainment=2
Else Attainment=1
Net CO=Attainment
Calculate % of students marks having marks greater than or equal to class average in Internal and External Lab.
Internal:
If Per>=50% than Attainment=3
Else if Per>=40% than Attainment=2
Else Attainment=1
External:
If Per>=60% than Attainment=3
Else if Per>=50% than Attainment=2
Else Attainment=1
Net CO=
30%Internal Attainment+70%External Attainment
-
B. INDIRECT TOOLS
SURVEYS
Calculate average of all COs and scale it to 3, this gives attainment.
Net CO=Attainment
-
Fig.2. Process 2-Net CO Calculation
The Figure 3 gives final PO and PEO attainment. In final evaluation of PEO and PO attainments 50% weightage for direct and 50% weightage for indirect tools are given. While calculating direct attainment some weightage is to be given for subjects, projects and placements. Similarly while calculating indirect attainment some weightage is to be given for various surveys depending on its impact on attainments.
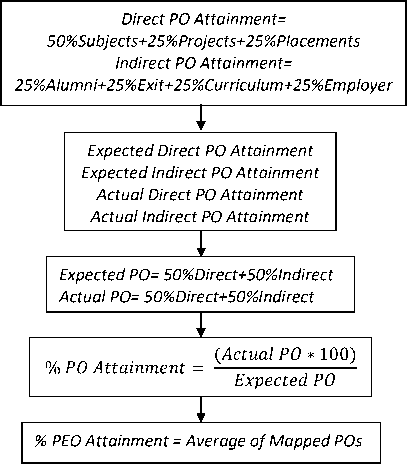
Fig.3. Process 3-PO and PEO Attainments
The percentage of PO attainment is measure by Actual PO and Expected PO. As stated earlier a correlation is to be established between PEOs and POs and based on these mappings the percentage PEO attained is calculated. For e.g. PEO5 is mapped with PO3, PO10, PO11 and PO12. The average of PO3, PO10, PO11 and PO12 gives attained PEO5. A comparison of PEOs and POs for different batches could help in assessing the PG program. In case of any weak attainment gap analysis can be performed. This OBE model could also help in designing of PG curriculum.
-
IV. Course Outcome Estimation
-
A. Course Outcome
The Course Outcome for any course can be formulated in form of various sentences giving the expected outcome of a particular course or what the students would get at the end of the course. The Course Outcomes are formulated by subject expert by involving various stake holders like Alumni, Industry etc. The Course Outcome of PG subject Computer Graphics is as follows.
The students would able:
-
• To understand the concepts of computer graphics and implementation of image creation and filling algorithms.
-
• To understand the concept of viewing and implement clipping algorithms & transformations.
-
• To understand the concept of projection and theory related to visible surface detection.
-
• To implement Bezier curves and study concepts related to illumination models.
-
• To understand fundamentals of animation and its techniques.
-
B. Mapping and CO Estimation
The department of MCA has formulated 12 POs based on twelve NBA graduate attributes. A correlation of various courses is established with Program Outcomes based on strong (3), moderate (2) and weak (1) correlation. It is shown in Table 1. In CO-PO Mapping Table the average of different columns gives Expected PO. The Actual PO is calculated through Net CO. In Net CO calculation 30% weightage is for internal and 70% weightage is for external. For the course Computer Graphics the Net CO Attainment is =1.77.
Table 1. CO-PO Mapping
|
PO1 |
PO2 |
PO3 |
PO4 |
PO5 |
PO6 |
PO7 |
PO8 |
PO9 |
PO10 |
PO11 |
PO12 |
|
|
CO1 |
3 |
3 |
1 |
1 |
1 |
1 |
1 |
1 |
1 |
|||
|
CO2 |
3 |
3 |
1 |
1 |
1 |
1 |
1 |
1 |
2 |
1 |
||
|
CO3 |
3 |
3 |
2 |
2 |
1 |
2 |
1 |
|||||
|
CO4 |
3 |
3 |
1 |
2 |
2 |
1 |
3 |
1 |
3 |
1 |
||
|
CO5 |
1 |
1 |
1 |
3 |
1 |
3 |
3 |
2 |
2 |
-
V. Assessment Process
The assessment process is based on utilizing direct and indirect tools for attaining PEOs and POs. The direct tool includes internal and external results, project evaluations and percentage of placements. The indirect tool utilizes conducting surveys by giving a set of questions to various stakeholders like alumni, employers and students.
-
A. Subjects Assessment
The subject assessment is based on student’s performance in internal and external examinations. This also includes the performance of students in various assignments and quizzes. The Table 2 shows expected and actual attainment of a particular batch in Computer Graphics. The table also shows overall attainment of all subjects.
|
Course |
Internal & External |
|||||||||||
|
PO1 |
PO2 |
PO3 |
PO4 |
PO5 |
PO6 |
PO7 |
PO8 |
PO9 |
PO10 |
PO11 |
PO12 |
|
|
Expected PO Attainment |
||||||||||||
|
Computer Graphics |
2.6 |
2.6 |
1.25 |
1.5 |
1.2 |
2 |
1 |
2 |
1.5 |
2.5 |
1.75 |
1.5 |
|
All Subjects |
2.18 |
2.27 |
2.11 |
2.24 |
1.77 |
1.61 |
1.94 |
1.72 |
1.86 |
1.66 |
1.96 |
2.19 |
|
Actual PO Attainment |
||||||||||||
|
Computer Graphics |
1.01 |
1.01 |
0.48 |
0.58 |
0.46 |
0.78 |
0.39 |
0.78 |
0.58 |
0.97 |
0.68 |
0.58 |
|
All Subjects |
1.44 |
1.47 |
1.34 |
1.47 |
1.15 |
1.02 |
1.27 |
1.08 |
1.20 |
1.03 |
1.29 |
1.41 |
-
B. Projects
The project development also plays an important role in the attainment of program objectives. A internal project committee comprising project coordinator and supervisors evaluate the projects on regular basics. The university appointed external examiner also evaluates the projects at the end of the semester. The project attainments are shown in Table 3 and Table 5.
Table 3. Expected Direct Attainment
|
Direct |
PO1 |
PO2 |
PO3 |
PO4 |
PO5 |
PO6 |
PO7 |
PO8 |
PO9 |
PO10 |
PO11 |
PO12 |
|
Result Of Courses |
2.18 |
2.27 |
2.11 |
2.24 |
1.77 |
1.61 |
1.94 |
1.72 |
1.86 |
1.66 |
1.96 |
2.19 |
|
Project |
1.98 |
2.33 |
2.00 |
1.33 |
1.91 |
1.33 |
1.50 |
1.78 |
2.56 |
1.00 |
1.43 |
1.63 |
|
Placement |
2.00 |
1.00 |
3.00 |
3.00 |
3.00 |
2.00 |
3.00 |
3.00 |
3.00 |
1.00 |
||
|
PO Attainment |
2.08 |
1.97 |
2.31 |
1.45 |
2.11 |
1.89 |
1.34 |
1.80 |
2.32 |
1.83 |
2.09 |
1.75 |
Table 4. Expected Indirect Attainment
|
Indirect |
PO1 |
PO2 |
PO3 |
PO4 |
PO5 |
PO6 |
PO7 |
PO8 |
PO9 |
PO10 |
PO11 |
PO12 |
|
Exit Survey |
2.00 |
1.80 |
2.67 |
2.25 |
2.00 |
3.00 |
2.00 |
2.25 |
2.33 |
1.83 |
2.25 |
2.00 |
|
Alumni Survey |
3.00 |
2.50 |
2.00 |
1.67 |
2.50 |
3.00 |
3.00 |
2.25 |
2.50 |
3.00 |
2.60 |
2.00 |
|
Curriculum Feedback |
2.50 |
1.33 |
3.00 |
3.00 |
2.00 |
2.00 |
3.00 |
1.00 |
2.00 |
|||
|
Employer Feedback |
3.00 |
2.75 |
3.00 |
1.67 |
1.67 |
3.00 |
3.00 |
3.00 |
3.00 |
2.50 |
2.33 |
2.50 |
|
PO Attainment |
2.00 |
2.39 |
2.25 |
2.15 |
2.29 |
2.25 |
2.50 |
2.38 |
2.71 |
2.08 |
2.30 |
1.63 |
-
C. Placements
The assessment process also uses placement results in attainment of PEOs and POs. The placement evaluations are based on the percentage of placements, package and number of offers. The Net CO attainment formula for placement is straight forward and is defined as:
If (Per>=75%) than
Attainment=3
Elseif (Per>=60%) than
Attainment=2
Else
Attainment=1
In case if attainment is 3 then Actual Attainment is equal to Expected Attainment.
-
D. Alumni Survey
An online survey is conducted once a year to get feedback from Alumni. The feedback is assessed during attainment process. The survey helps in bridging the gap between industry and institute.
-
E. Exit Survey
The exit survey is conducted at the end of the post graduate course to take the feedback from the students. The survey is assessed during the attainment process.
-
F. Curriculum Feedback
The curriculum feedback is conducted in the last semester of course to get feedback regarding the course contents and its applicability in real life and placements. The feedback is used in assessment process and would also help in designing the curriculum if the institute is autonomous. This would help the students to have better exposure in current market trends.
-
G. Employer Feedback
An employer feedback is taken from industry person where the students were placed. The different parameters were included in the form related to skills and ability of graduated student.
-
VI. Program Outcome Calculation
0.25 * Curriculum + 0.25 * Employer
The program outcomes are calculated by direct and indirect tools. The 50% contribution of direct tools and 50% contribution of indirect tools were taken in PO attainments.
In direct PO attainment the following weightage is given
Direct = 0.50 * Result + 0.25 * Project
+0.25 * Placement(1)
In indirect PO attainment the following weightage is given to various surveys
Indirect = 0.25 * Exit + 0.25 * Alumni +
The direct and indirect attainments are given in Table 4, 5, 6 and 7.
The final PO attainment is calculated as
Final PO Attainment = Actual_P0*100(3)
Expected_PO
Table 7 gives final PO attainment.
The PEO are calculated by taking average of mapped Program Outcomes(POs).
PEO = Average(Mapped POs) (4)
The mapping is shown in Table 8.
The Figure 4 gives PEO attainments of last four batches of post graduate course. All PEO attainments are above 80%. For any particular PG program one has to set the targets and if the targets are not achieved then gap analysis is to be performed. The same procedure is to be followed for PO attainments.
Table 5. Actual Direct Attainment
|
Direct |
PO1 |
PO2 |
PO3 |
PO4 |
PO5 |
PO6 |
PO7 |
PO8 |
PO9 |
PO10 |
PO11 |
PO12 |
|
Result of Courses |
1.44 |
1.47 |
1.34 |
1.47 |
1.15 |
1.02 |
1.27 |
1.08 |
1.20 |
1.03 |
1.29 |
1.41 |
|
Project |
1.61 |
1.83 |
1.55 |
1.11 |
1.54 |
1.11 |
1.28 |
1.41 |
1.89 |
0.78 |
1.15 |
1.35 |
|
Placement |
2.00 |
1.00 |
3.00 |
3.00 |
3.00 |
2.00 |
3.00 |
3.00 |
3.00 |
1.00 |
||
|
PO Attainment |
1.62 |
1.44 |
1.81 |
1.01 |
1.71 |
1.54 |
0.96 |
1.39 |
1.82 |
1.46 |
1.68 |
1.30 |
Table 6. Actual Indirect Attainment
|
Indirect |
PO1 |
PO2 |
PO3 |
PO4 |
PO5 |
PO6 |
PO7 |
PO8 |
PO9 |
PO10 |
PO11 |
PO12 |
|
Exit Survey |
1.54 |
1.39 |
2.05 |
1.73 |
1.54 |
2.31 |
1.54 |
1.73 |
1.80 |
1.41 |
1.73 |
1.54 |
|
Alumni Survey |
2.60 |
2.17 |
1.73 |
1.44 |
2.17 |
2.60 |
2.60 |
1.95 |
2.17 |
2.60 |
2.25 |
1.73 |
|
Curriculum Feedback |
1.63 |
0.87 |
1.96 |
1.96 |
1.31 |
1.31 |
1.96 |
0.65 |
1.31 |
|||
|
Employer Feedback |
2.80 |
2.57 |
2.80 |
1.56 |
1.56 |
2.80 |
2.80 |
2.80 |
2.80 |
2.33 |
2.18 |
2.33 |
|
PO Attainment |
1.74 |
1.94 |
1.86 |
1.67 |
1.81 |
1.93 |
2.06 |
1.95 |
2.18 |
1.75 |
1.87 |
1.40 |
Table 7. Final PO Attainment
|
PO1 |
PO2 |
PO3 |
PO4 |
PO5 |
PO6 |
PO7 |
PO8 |
PO9 |
PO10 |
PO11 |
PO12 |
|
|
Expected PO |
2.04 |
2.18 |
2.28 |
1.80 |
2.20 |
2.07 |
1.92 |
2.09 |
2.51 |
1.96 |
2.19 |
1.69 |
|
Actual PO |
1.68 |
1.69 |
1.84 |
1.34 |
1.76 |
1.73 |
1.51 |
1.67 |
2.00 |
1.61 |
1.78 |
1.35 |
|
Attainment (%) |
82.19 |
77.59 |
80.63 |
74.66 |
79.76 |
83.80 |
78.53 |
79.90 |
79.65 |
82.08 |
81.01 |
79.81 |
Table 8. PEO Attainment
|
PEOs |
Mapped POs |
PEO Expected |
PEO Attained |
Attainment (%) |
|
PEO1 |
PO1, PO2, PO3, PO5 |
2.18 |
1.74 |
80.02 |
|
PEO2 |
PO1, PO2, PO5, PO6, PO7, PO9, PO10, PO11 |
2.13 |
1.72 |
80.54 |
|
PEO3 |
PO3, PO4, PO6, PO10 |
2.03 |
1.63 |
80.46 |
|
PEO4 |
PO5, PO8, PO9, PO11 |
2.25 |
1.80 |
80.07 |
|
PEO5 |
PO3, PO10, PO11, PO12 |
2.03 |
1.64 |
80.91 |
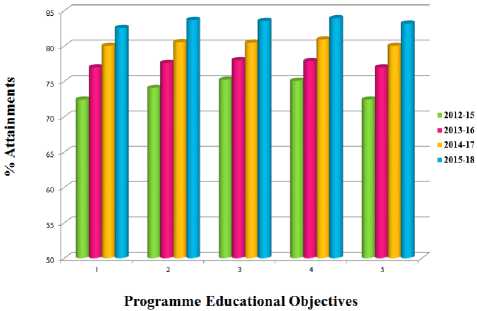
Fig.4. Previous Four Batches Attainments.
-
VII. Conclusion
Today, most of the engineering educational institutions are assessing their degree programs on the basis of outcome based education for improving their curriculum design, teaching methodologies, assessment and evaluation process. There are clear guidelines prescribed by accreditation bodies of Indian Government for each institute for defining, assessing various Program Outcomes in correlation NBA graduate attributes.
In this paper we discussed about the process of attaining Program Outcome and Program Educational Objectives for post graduate program. This work will help in assessing the teaching learning process of the institute and thus would help in calculating the attainments of different batches of a particular post graduate program.
References Assessment and attainment of program educational objectives for post graduate courses
- Washington Accord, [online] Available: www.ieagreements.org/accords/washington
- National Board of Accreditation [online] Available: www.nbaind.org
- Ramchandra, S., Maitra, S, Mallikarjuna Babu.K, “Method for estimation of attainment of program outcome through course outcome for outcome based education”, 2014 IEEE International Conference on MOOC, Innovation and Technology in Education (MITE), pp. 7 – 12, 2014.
- M. S. Jaafar, N. K. Nordin, R. Wagiran, A. Aziz, M. J. M. M. Noor, M. R. Osman, J. Noorzaei and F. N. A. Abdulaziz, "Assessment Strategy for an Outcome Based Education", International Conference on Engineering Education, July 2008.
- Shallu Bassi, V. K. Chandna, Sangeeta Singh, "Analysis of course outcomes of HVE-a tool for assessment of programme outcomes", MOOCs Innovation and Technology in Education (MITE), 2015 IEEE 3rd International Conference on, pp. 35-37, 2015.
- Parveen P Terang, Sanjiba Kr. Bisoyi, Vinay Kumar Chandna, "Weightage factor analysis between programme Outcomes and course Outcomes: A case study", MOOCs Innovation and Technology in Education (MITE) 2015 IEEE 3rd International Conference on, pp. 84-87, 2015.
- Vinay Kumar Chandna, "Course outcome assessment and improvement on weak student", MOOCs Innovation and Technology in Education (MITE) 2015 IEEE 3rd International Conference on, pp. 38-40, 2015.
- Amit Kumar Roy, Gunjan Varshney, V. K. Chandna, "Learning through modern tools in power quality to evaluate course outcome", MOOCs Innovation and Technology in Education (MITE) 2015 IEEE 3rd International Conference on, pp. 96-99, 2015.
- Akash Rajak, Ajay Shrivastava, D.P. Shrivastava, "Automating Outcome Based Education for the Attainment of Course and Program Outcomes",The Fifth HCT Information Technology Trends (ITT 2018), Dubai, UAE, pp. 373-376, 2018.
- Gary KW Wong, H. Y. Cheung, "Outcome-based teaching and learning in computer science education at sub-degree level", International Journal of Information and Education Technology, vol. 1, no. 1, pp. 40, 2011.
- K.Y. Tshai, J.-H. Ho, E.H. Yap, H.K. Ng, "Outcome-based Education -The Assessment of Programme Educational Objectives for an Engineering Undergraduate Degree", Engineering Education, vol. 9, no. 1, 2014.
- Srividya Bansal, Ajay Bansal, Odesma Dalrymple, "Outcomebased Education Model for Computer Science Education", Journal of Engineering Education Transformations, vol. 28, no. 2 & 3, pp. 113-121, 2015.
