Assessment of Error Bounds for Path Loss Prediction Models for TV White Space Usage in Ekiti State, Nigeria

Author: Akinsanmi Akinbolati, Olufemi J. Agunbiade
Journal: International Journal of Information Engineering and Electronic Business @ijieeb
Article in issue: 3 vol.12, 2020.
Free access
Path-loss propagation models are useful in radio communications for the prediction of signal’s coverage area, link’s design and power budget. They are equally used for radio channel characterization to accurately predict television coverage, interference analysis and ensure coexistence between the primary service providers and secondary users (through frequency re-use). One of the challenges with the application of a predictive path loss model for any environment other than the one it was developed for is the issue of high prediction errors. This is due to their high dependence on environmental complexity and terrain. In this paper, we investigated the error bounds of eight empirical path loss models to evaluate their reliability of predicting path losses on the UHF band in Ekiti State, South West Nigeria. Measurement of the signal strength for the UHF channel 41 (631.25MHz), Television Broadcasting Station at Ado-Ekiti, was carried out via major routes spanning through the Urban and Suburban areas of the State, using the station as reference. The signal strength values were converted to path losses and compared with predictions of eight selected models. The prediction error, relative error, root mean square error (RMSE), spread corrected mean square error (SC-RMSE), skewness and the normalized error probability density function metrics was calculated to determine the error bound which was used to validate the best predictive model for the routes under consideration. The results of this investigation show that no single model gives an accurate prediction consistently based on the evaluating metrics. However, the Electronic Communication Committee (ECC) 33 model provides better values for the overall metrics considered with RMSE values of 8.48 dB and 9.62 dB (between it and measured values) for Ekiti Suburban and Urban routes respectively. Therefore, optimizing ECC 33 model will bring the RMSE values to the standard acceptable range for both sub - urban and urban routes. The significance of this finding is that ECC 33 model has the least prediction error compared to other selected models and by extension the closest value to the measured values. This validates it to be suitable for the prediction of path losses on the UHF band over the study area.
Path loss model, Error Bound, RMSE, Terrain and TVWS
Short address: https://sciup.org/15017404
IDR: 15017404 | DOI: 10.5815/ijieeb.2020.03.04
Text of the scientific article Assessment of Error Bounds for Path Loss Prediction Models for TV White Space Usage in Ekiti State, Nigeria
Published Online June 2020 in MECS
-
I. Introduction
Information and Communication Technology (ICT) in the 21 st century has continually contributed largely to global social and economic development. With the drastic increase in demand for mobile connectivity and wireless networks, the need to manage and allocate the radio spectrum which is the necessary resources for wireless technologies is inevitable. This has led to the development of different approaches for addressing the optimization of the available spectrum. One alternative mode of spectrum utilization that has found expression in the developed countries of the world is the use of TV White Spaces (TVWS) for communication systems [1]. TVWS is a label that indicates the part of spectrum, which is available for a radio communication application at a given time in a given geographical area on a noninterfering and non-protected basis with regard to other secondary services. TVWS is one of the ways to curb the spectrum crunch that is being faced by the global communication scene. It does not only offer better spectrum management, but due to the inherent propagation characteristics of the UHF band (channels fourteen to fifty-one (14 – 51), located at 300 – 3000 MHz), it’s an economically viable solution for rural or suburban broadband and hotspot coverage [2]. Not only developed nations are cashing on the advantages of TVWS technology, even countries with minimal communication infrastructure are going for it because of
its ease of deployment, large coverage areas and better penetration property when compared to the higher frequency bands.
Various studies are employed to proffer solution to the recent argument of interference inducement by White Space Devices (WSDs) used by secondary users to the licensed primary operators.
Research focus: It was based on the above premise that this study was designed to assess the validity (model with the least prediction error and acceptable RMSE) of the selected models for use over the study areas and channel. It is equally expected that the most preferred model from this assessment can be used for the accurate prediction of path losses and TVWS over the study area.
This study has become imperative due to dearth of such studies in the area and the fact that similar studies in other environments may not fit in perfectly to this study location.
In this study, we present the assessment of the error bounds of eight selected empirical path loss models for use at the UHF band in Ekiti State, South-West, Nigeria in order to establish their accuracy at predicting path loss that can best be used for TVWS prediction among others. The models were selected primarily because they are approved models by the International
Telecommunications Union, Radio Study Group (ITU-R) and secondarily because their independent parameters and classification of environment can be deployed in the study location.
The selected models are, CCIR (developed by the Consultative Committee on International Radio) [4, 5], COST 231(developed by the European Co-operative for Scientific and Technical Research) [6], ECC 33 (developed by the Electronic Communication Committee) [7], Free Space Path Loss (FSPL) [8, 9], Hata [10], Hata-Davidson [11, 12], Okumura [13] and the Plane Earth [14] model.
This paper is organized in this order; Section I provides introduction; related works are presented in section II; Section III describes the method of data collection and research location; Models for path loss prediction were presented in Section IV; Section V presents data analysis and results; finally, Section VI compared the results of the selected models and proposed possible adjustments to the model with the best fit and concludes the paper.
-
II. Overview Of Related Study
Great numbers of researchers globally have demonstrated intense effort towards probing the efficacy of existing path loss models and its fitness for a new geographic location. The authors’ approach in many cases is to collect measurement data in an environment of interest and compare with model predictions to make an evaluation of which model best fit in or modify the closest model to fit in such environment. In addition, most works on model fitness and tuning concentrate on the fixed wireless access and cellular bands; little has been done in the region of broadcast TV band specifically in Nigeria. It is therefore necessary to review and have accurate assessments of the propagation models in order to modify a model or choose the best model to achieve high accuracy, thereby minimizing errors and, thus, increasing flexibility in local spectrum usage. For instance, in [15], the authors estimated five path loss propagation models such as; Stanford University Interim (SUI), COST-231, Hata-Okumura Extended Model (also known as ECC-33 Model), Ericsson and the Hata -Okumura model. The results of these models were compared with actual measured data. The results of comparison showed that the ECC-33 model was suitable for the suburban environment. The authors in [3] assessed the error bounds of 10 empirical path loss models. This was achieved by field strength measurement in VHF and UHF band in urban, suburban and rural areas of Kwara State, Nigeria. Five performance metric such as, Route Mean Square Error (RMSE), Spread Corrected Route Mean Square Error (SC-RMSE), Error Distribution and probability density function were employed to evaluate the performances of the prediction models. Nadir et al [16] investigated the characteristics of radio propagation, by measurement, at the small town of rural area in Purwokerto Central Java Indonesia and compared his findings with Okumura Hata and Lee’s prediction so as to evaluate the accuracy and determine the necessary adjustments to these models in order to improve their accuracies. In another study [7], a comparative assessment of five models was presented with respect to the data collected in the urban and suburban environments of Ottawa region, Canada at 910 MHz so as to verify which model gives the best results. Also, the authors in [17] provided a comparison of empirical propagation path loss models for fixed wireless access systems based on measurement conducted in Cambridge, UK. It was found that, the ECC-33 model among others such as; SUI and COST-231 models, showed the most promising result and that SUI model showed a quite large mean path loss prediction error for rural, suburban and urban environments. The results showed that in general the SUI and the COST- 231 Hata model over- predicted the path loss in all the environments considered. A very close and elaborate work was presented by [18], where propagation measurements at VHF/UHF bands in Ilorin, North Central Nigeria, were conducted. The work concluded that Okumura’s model is the most suitable for the prediction of field strengths for television broadcast services and for other communication system designs in the VHF and UHF bands. However, the Root Mean Square Errors (RMSEs) of 34 dB and 33 dB were obtained in the VHF and UHF bands respectively, which are far beyond the acceptable range 6 – 8 dB for urban areas [7] and 10–15 dB for suburban and rural areas [19]. Therefore, the said model cannot provide optimum pathloss prediction in the study area.
Finally, Authors in [20, 21] provided information on the actual coverage and proposed path loss prediction model for the UHF channel 41 Broadcasting Service of Ekiti State Television, in Ekiti State, Nigeria. The variation of signal level with distance (i.e. propagation curve) was analyzed, to reveal areas of optimum coverage and areas that are poorly serviced. The results showed the field strength distribution of the broadcasting station in major towns and villages, its elevation pattern and the various grades of coverage enjoyed by its citizens in such locations. The study however, doesn’t employ the path loss model prediction comparison approach to provide error bound for other widely used models.
The work presented in this paper is the first of its kind in the study area that carries out an extensive analysis of large number of propagation models using large amount of data set produced from real time measurements.
-
III. Methodology
-
A. Study Location and routes for field campaign
The spatial electric field strength measurement was carried out on channel 41 UHF television signal of the Broadcasting Service of Ekiti State (BSES). The broadcasting station is located at Ilokun quarters, Ado Ekiti (Lat. 7.71 0 N, Long. 5.21 0 E). Ekiti State is in the South Western parts of Nigeria with a population of about 2,398,957 (Nigerian Bureau of statistics, 2006 Census). The State is characterized by a complex terrain due to the presence of hills and valleys within the urban, suburban and rural settlements.
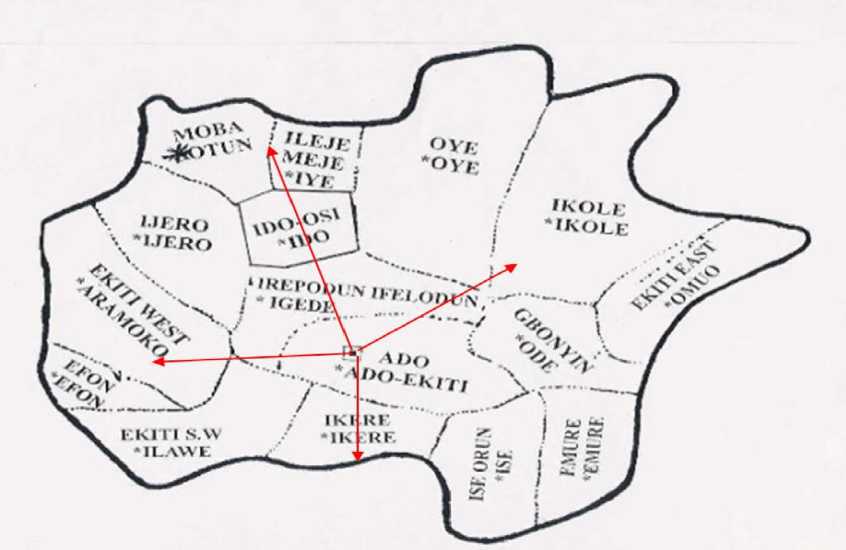
Fig.1. Map of Ekiti State indicating Routes of Measurement
-
B. Method of Data collection
Fig.1. presents the map of Ekiti State indicating routes of signal’s strength measurement. The electric field strength of the channel under study was measured along selected routes using the station as reference at an interval of 2 km using a field strength meter (Dagatron TM 10, with frequency range of 5.0 – 862.0 MHz and 15.0 – 12.0 dBµV measurement range). A Global
Positioning System (GPS) hand held receiver was used to monitor the Line of Sight (LOS) distance from the station and as well used to log the geo coordinates of the data points. Measurements were carried out in different environments within Ekiti State, Nigeria by drive test. Outside the major cities, the routes are covered with thick vegetation. The elevation of the transmitter’s base station is 415.22m, and the altitude for the points measured throughout the entire state ranges between 354.9m and 603.4m.
The measurement campaign routes and locations were categorized into urban and sub-urban areas and the characteristic attributes of the categorization are detailed as follows:
The urban routes include: From transmitting station in Ado Ekiti enroute Adebayo Road, Ajilosun, Ajebamidele towards Ikere (Urban Route A) and from transmitting station enroute Ifaki towards Ikole Ekiti (Urban Route B).
The sub- urban routes include; From transmitting base station in Ilokun-Ado Ekiti enroute Usi and Ayetoro Ekiti towards Ikosi and Ikun Ekiti (in Ileje meje local Government Area). The sub urban route B, starts from transmitting base station enroute Igbara Odo, Igogosi, Erinjiyan towards Efon Ekiti. The urban routes have regular building structure with average of two-storey buildings within the city, very busy commercial activities with higher percentage of dual carriage roads compared to single carriage. The suburban area/route has regular buildings structure within the town and the routes outside the settlements being single lane have trees and thick vegetation.
The transmitted power and received field strength measurement values in kW and dBµV respectively were converted to dBm using equation (1) and (2) and the path losses in dBm were obtained as shown in equation (3) [22].
-
P, (dBm ) = 10 log,0(P (kW ) *1000) + 30
P (dBm ) = P (dB mV )- 107
LdBm = Pt ( dBm )- Pr (dBm ) + Gt (dBm )
where, G t (dBm) is the transmitting antenna gain.
The transmission parameters for the transmitting station (BSES channel 41) as at the time of this study, is as presented in Table 1. (From the Station’s Technical crew) [20]
Table 1. Transmission Parameters for BSES, Ch.41 UHF Television Station at Ado Ekiti
|
S/N |
Parameter |
Values |
|
1 |
Base station rated transmitting power/ transmitted |
20 kW/ 12kW |
|
output |
||
|
2 |
Base station carrier frequency |
631.25 MHz |
|
3 |
Transmitter in use during field work |
Harris MAXIMA Solid State Type |
|
4 |
Height of transmitting mast |
200.0m |
|
5 |
Height of transmitting antenna |
13 m |
|
6 |
Transmitting antenna gain |
13 dB |
|
7 |
Height of receiving antenna |
1.94m(6ft) |
|
8 |
Coordinates |
Lat. 7.710N, Long. 5.210E |
-
IV. Empirical Path Loss Models
-
A. Path Loss
Signals undergo attenuation, commonly called path loss, which increases with distance. It represents the signal level attenuation caused by free space propagation, reflection, diffraction and scattering. The path loss between a pair of antennas is the ratio of the transmitted power to the received power and it is usual to express it in decibels by the expression [23]:
-
< P, ^
L dB = 10log10 l^^ I (4)
-
V P RI )
-
B. Path Loss Propagation Models
Path loss models represent a set of mathematical equations and algorithms that are used for radio signal propagation prediction in definite areas. According to [24], path loss models have been classified as follow:
-
1. Deterministic Model
-
2. Stochastic Model
-
3. Empirical Model
Deterministic and Stochastic models are more of theoretical models that predict transmission losses by mathematical and computational analysis of the path geometrical information of the terrain between the transmitter and the receiver, as well as the refractivity of the troposphere [25]. Empirical models are based on measurements conducted in a given environment, the main benefits for the use of these standard path loss models are time and cost efficiency, despite its limited accuracy. Path losses on wireless channels are generally the resultant effects of reflection, refraction, diffraction, scattering, absorption and fading due to multipath amongst others [26, 27]
Empirical model was the main focus in this paper as the study it presents was based on observation and measurement alone. The empirical models selected for error bounds analysis in this study were selected primarily because they are approved models by the International Telecommunications Union, Radio Study Group (ITU-R) and secondarily because their independent parameters and classification of environment can be deployed in the study location. The models and their relationship with one another are as presented:
-
(i) Free Space Model (FSPL)
Path loss in free space defines how much strength of signal is lost during propagation from transmitter to receiver with no atmospheric attenuation or multipath components [8]. Free space model depends on frequency and distance. It is calculated as:
Lfspl = 32.45 + 20log 10 ( d ) + 20log 10 ( f )
Where f is the frequency in (MHz) and d is the distance between transmitter and receiver in (km)
-
(ii) Plane Earth Model
The free space model does not consider the impacts of proliferation over ground. At the point when a radio wave proliferates over ground, a portion of the power will be reflected because of the nearness of the ground and after that received by the collector. The applicable information parameters incorporate the transmitting and receiving apparatus height, the distance of separation and the reflection coefficient of the earth. The path loss equation for plane earth model is [14]:
L PE = 40log i0 ( d ) - 2Olog io ( h ) - 2Olog io ( h 2 ) (6)
where d is the distance between transmitter and receiver in (km), h and h in (m) are the heights of the transmitting base station and receiving antenna respectively.
-
(iii) Okumura Model
Okumura’s model is one of the most frequently used macroscopic propagation models. It was developed during the mid1960's as the result of large-scale studies conducted in and around Tokyo. The model was designed for use in the frequency range 200 up to 1920 MHz and mostly in an urban propagation environment [13]. Okumura’s model assumes that the path loss between the transmitter and receiver in the terrestrial propagation environment can be expressed as:
L 50% = LFSL + Amu ( f, d ) - G ( he ) - G ( hre ) - G AREA where:
L 5o % is the median (i.e., 50th percentile) value of propagation path loss expressed in dB,
Lfsl is the free space propagation loss in dB,
A mu (f, d) is the basic median attenuation relative to free space in dB,
G(hte) and G(hre) are the base station and receiver antenna height gain correction factor in dB respectively, and
G area is the gain in dB due to the type of environment.
-
(iv) Hata’s Model
Hata’s model [10] is an empirical formulation of the graphical path-loss data provided by Okumura and is valid in the range 150–1500 MHz, the model transmission distance is up to 20 km and has been widely used to predict analogue TV signal propagation.
Hata gave the propagation formula and provided correction factors for other situations.
For Urban areas:
Г69.55 + 26.16log f —13.82 log hb — I (8) [urban ] a ( hm ) + (44.9 — 6.55log hb )log d J where:
L is the path loss in dB
( urban )
f is the frequency and its range is restricted to 150 -1500 MHz, ht is the base station height, 20 - 200 m range, hr is the receiver height and it ranges from 1 - 10 m,
-
d, ranging from 1 to 20 km is the distance between the transmitter and the receiver, and a(h,r) in dB is the correction factor for the receiver height and is computed as follows:
f [1.1log10( f ) — 0.7] h r — [1.56log ,0 < f ) — 0.8]
I For suburban or rural area
a(h) J^log^a.Mh.)2 — i.i r । For an Urban area : f < 200 MHz
I 3.2 log (11.75 h )2 — 4.97 10 r
[ For an Urban area : f < 400 MHz
Suburban areas:
L„, (dB) = L„, (urban) — 2 Hata Hata log10

— 5.4
Open areas:
L ( dB ) ' L Hata ( Urban ) — 4.78 ( log 10 ( f ) ) 1 (11)
[ — 18.33logw( f ) — 40.94 J
Hata’s model does not provide any path-specific correction factor as available in the original Okumura’s model. Even though the model provides wide range of frequency and the TV white space band (UHF) falls within this range, indoor environment is still not captured in the model.
-
(v) Cost 231 Model
A model that is widely used for predicting path loss in mobile wireless system is the COST-231 Hata model developed by the European Co-operative for Scientific and Technical Research Team, it is also called Personal Communication System (PCS) Extension. This model is an extension of the Okumura -Hata model to cover a wide range of frequencies between (0.5-2 GHz), and it’s used for medium to small cities [15]. The expression for the model in dB is:
_ Г 46.3 + 33.9log ,0 ( f ) — 13.82log ,0 ( h , ) + 1
L( dB ) "[ ( 44.9 — 6.55log ,0 ( h , ) ) log ,0 ( d ) — a ( h r ) + C m J
a(h r ) is as defined in (9), while Cm = 0 dB for mediumsized city and suburban areas and 3 dB for urban areas.
-
(vi) ECC 33 Model
The ECC 33 path loss model, which was developed by Electronic Communication Committee (ECC), was extrapolated from original measurements by Okumura and modified its assumptions so that it more closely represents a fixed wireless access (FWA) system. It is an appropriate model for the Ultra High Frequency (UHF) band, and according to recent recommendations of ITU-R, it uses up to 3.5GHz. This model was proposed based on the Okumura model and is given by [7].
L_r = L„ v + L_ — G, — G (13)
dB FS bm t r
Where:LFS, Lbm, Gt, Gr , all in dB, are the free space attenuation, basic medium path loss, transmitter height gain factor and the receiver height gain factor, respectively, which are defined as:
Lfs = 92.4 + 20log^ (d)+ 20log^ (f)
= Г20.41 + 9.83log10 (d ) + 7.89 log^ (f )J 'bm [+9.56 [log10( f)]2
-
G. = log 10 [ h^ + 5.8 ( log 10 ( d ) ) 2 J (16)
For medium size city,
G Г[42.57 + 13.7 1og10( f )][log10 (h )-J (17) r [ 0.585]
and for large city,
G = 0.759h - 1.862
rm where f is in GHz, d in km, ht and hm are in metres
-
C. Metrics for Performance Evaluation of the models
The performance of the models analyzed; was evaluated using six metrics: prediction error, Root Mean Square Error (RMSE), spread corrected – RMSE, normalized error probability density function, skewness and relative error.
-
(i) The prediction error (E ):This is the difference between the measured path loss ( Pi ) at distance i and the model’s predicted path loss ( Pm,i ) [26] and is evaluated using equation (19).
£i = P" Pm ,i|
Other sub metrics are the maximum and mean prediction error of sample (n) and are evaluated as:
Max Error = Max (et)
1 n
Mean Error = — ^ (^-)
n , = 1
Skewness (S) is the sum of a models’ error across the measurement distance and it is expressed as;
n
S = ^ ( £/ ) (22)
i = 1
-
(ii) RMSE: This is the most apparent metric for analyzing error of predictive models. The prediction error values were computed using equation (19) for each model as a function of distance from the transmitter. The
overall RMSE for a given model m , for a given data set n is defined as [26];
RMSE =

A RMSE value closer to 0 indicates a better fit. However, the acceptable RMSE for a model is about 6–7 dB for urban areas [7] and 10–15 dB for suburban and rural areas [19].
-
(iii) Spread Corrected Root Mean Square Error (SC-RMSE): It helps to extract the impact of dispersion from the overall error. This has the effect of reducing the error associated with a noisy link. Computing SC-RMSE is similar to that of RMSE; the only deference is that the error is obtained by subtracting the standard deviation from the absolute value of the error [27]. The SC-RMSE is computed as;
where,
SC - RMSE
£ '. = k i | - CT .
-
(iv) Error Distribution: This metric is also known as the probability density function of a Gaussian (normal) random variable. First, the model has to follow normal distribution curve. Second, the error counts from 0 to ±5 dB should dominate the frequency counts since 0–10 dB RMSE is the chosen performance criteria [26].
-
(v) Relative Error (δ): Equation (26) was used to calculate the relative error for the models evaluated.
^, 5 = *100% .
P i
-
V. Results And Discussion
The mean values of the predicted and measured path losses for the urban and sub-urban routes are presented in Table 2. It can be observed that the measured path loss gave a mean value of 156.51 dB and 165.41 dB for the urban and sub-urban route respectively. Measuring closely to these values is the path loss prediction by ECC 33 model which yielded 157.90 dB and 159.95 dB. The average path loss for the entire investigation region was also calculated, it can be deduced that all the models underestimated the measured path loss. However, the highest prediction deviation from the measured loss are given by FSPL and Plane Earth models which predicted path losses 114.90 dB and 121.01 dB respectively.
Fig.2., and Fig.3., depicted the measured and predicted path losses along the urban and sub-urban areas respectively as categorized in this investigation. These figures show the comparison between the measured and predicted path loss values as a function of LOS separation distance from the base station for different routes.
From the Figures, ECC 33 model gave the closest path loss prediction to the measured path loss, whereas, the FSPL and Plane Earth models gave the most inaccurate predictions by underestimating the path loss over the entire region of study. For the urban route, the CCIR, COST 231, Hata, Hata-Davidson and Okumura model agreed with the measured path loss within the first 10 km, whereas, only CCIR, COST 231 and Hata gave a good match up to 25 km. Beyond this, they all under estimated the path losses. The result for Hata matches with expectation within the first 20 km because the maximum transmission distance for Hata’s model is 20 km. Fig.3., showed the comparison of the measured path loss with the predicted path loss as a function of distance for the sub-urban route, although all models except ECC 33 underestimated the measured path loss throughout the entire route, only COST 231 gave a close prediction within the first 10 km, ECC 33 predictions started to measure up with the measured path loss at a distance of 13km as shown in Fig.3., However, ECC 33 model had the best fit with a minimum RMSE of 8.48 dB and SC-RMSE 3.98 dB as shown in Fig.6., and Fig.7. The worst result was provided by the Plane Earth and FSPL model with RMSE values of 43.36 dB 50.53 dB respectively.
Fig.4., and Fig.5., showed prediction error as a function of distance for the urban and sub-urban routes respectively. The shape of the error spread is similar for all the models in each route. For the urban route, ECC 33 provided a high negative prediction error values, CCIR, COST 231, Hata, Davidson and Okumura fell within the window of ±8 dB, FSPL and Plane Earth models gave high positive predication errors. Whereas, for the suburban route, all models except ECC 33 was seen to have positive error prediction error indicating they underestimated the path loss.
Table 2. Comparison Between Overall Measured and Predicted Path Losses for the Measurement Routes
|
ROUTES |
Measured (dB) |
FSPL (dB) |
Plane Earth (dB) |
Okumura (dB) |
COST 231 (dB) |
ECC 33 (dB) |
CCIR (dB) |
Hata (dB) |
Davidson (dB) |
|
URBAN |
156.51 |
114.21 |
119.63 |
148.46 |
149.83 |
157.90 |
149.15 |
149.05 |
145.29 |
|
SUB-URBAN |
165.41 |
115.59 |
122.39 |
144.20 |
148.77 |
159.95 |
134.47 |
141.90 |
138.22 |
|
Average Path Loss |
160.96 |
114.90 |
121.01 |
146.33 |
149.30 |
158.93 |
141.81 |
145.47 |
141.75 |
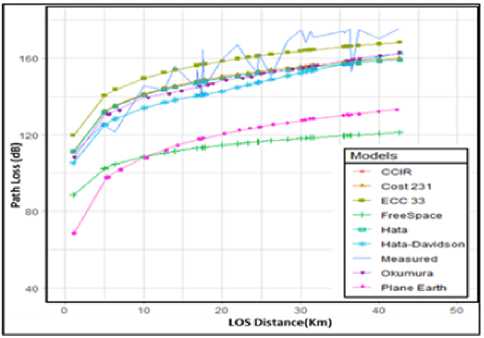
Fig.2. Comparison of empirical models with measured path loss for Ekiti Urban route
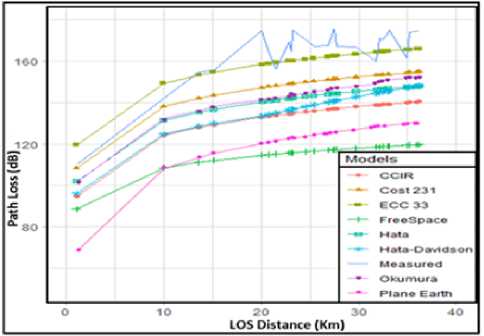
Fig.3. Comparison of empirical models with measured path loss for Ekiti Sub-urban route
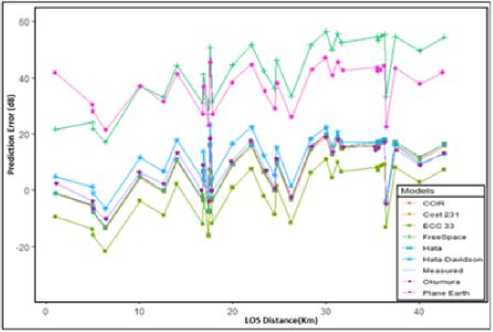
Fig.4. Prediction error as a function of distance for Ekiti Urban route
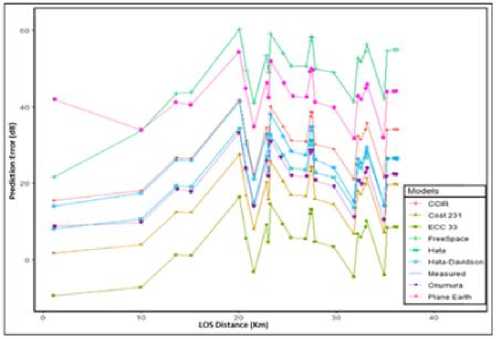
Fig.5.Prediction error as a function of distance for Ekiti Sub-urban route
In order to test the validity of these empirical models for applicability in the investigated area, the RMSE value, given in equation (14), was used to compute the error between the measured and the predicted path losses. The results shown in Table 3 revealed the RMSE of prediction for the models.
Also Fig.6., and Fig.7., showed the statistical values for the RMSE and SC-RMSE. ECC 33 model provided the best result with RMSE values of 8.48 dB and 9.62 dB for the overall sub-urban and urban route respectively, closely followed by COST 231, Okumura, CCIR, Hata and Hata-Davidson model with RMSE values of 11.63 dB, 11.89 dB, 12.10 dB, 12.17 dB, 13.91 dB for the urban route. On the other hand, FSPL and Plane Earth models performed woefully, with very high RMSE values of 43.93 dB and 50.53 dB, 37.72 dB and 43.36dB for urban and sub-urban route respectively. As shown in Fig 6, it can be emphasized that except for ECC 33 model, the RMSE values on the urban route are lower than that of the sub-urban for each model. ECC 33 model gave very close RMSE values for both routes with an average RMSE value of 9.05 dB for the whole investigation region as shown in Fig.9. Fig. 8., showed the mean error values for all the models along all the routes. The interpretation of this metric is ambiguous, in terms of whether a model underestimates or overestimates the path loss. However, a model that provides equal extent of underestimation and overestimation will result to zero mean value or the resulting skewness will be zero. It can be seen that ECC 33 gave an average of 2.03 dB, very close to zero and an overall skew of 52.09 dB as summarized in Table 4. Okumura, COST 231, CCIR and Hata models gave mean values close to zero for the urban route. However, COST 231 and Okumura also provided better skew for the suburban route, while CCIR, Hata, Davidson, Plane Earth and FSPL gave worst results.
Equation (19) was used to compute the relative error for each model. Fig.10, showed the relative errors for each model as a function of the measurements route. FSPL and Plane Earth models gave higher relative errors among other models which suggest that they provide the worst prediction for the entire region. It is worth mentioning that all the models gave a higher relative error for the sub-urban route when compared with the urban route.
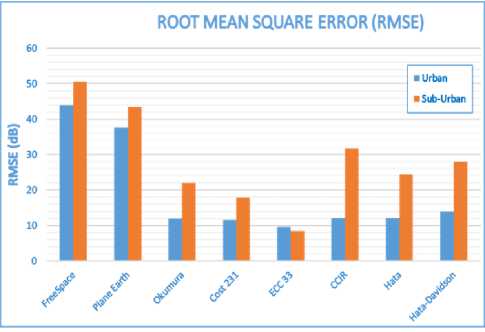
Fig 6. Root mean square error for the routes
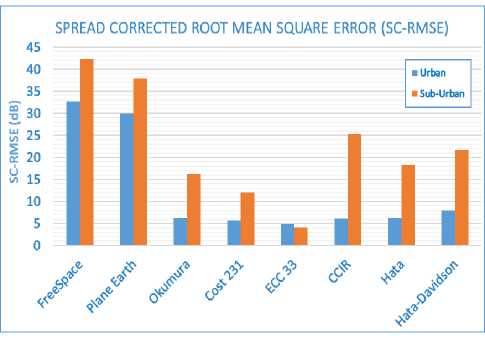
Fig 7. Spread corrected root mean square error for the routes
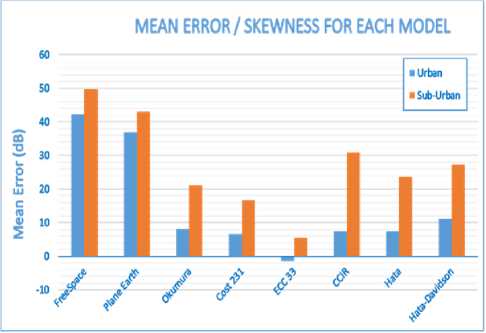
Fig 8. Mean error for the routes
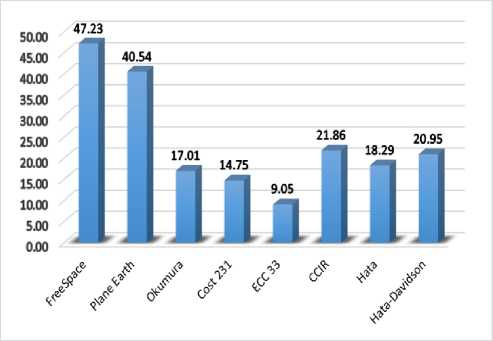
Fig.9. Average RMSE for the entire study region
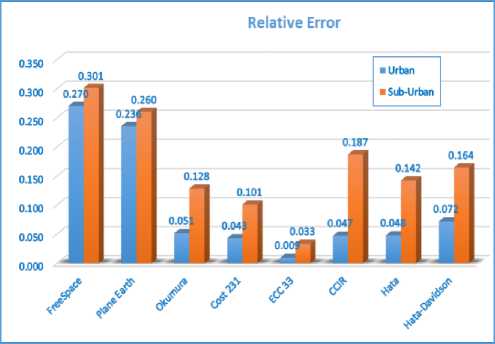
Fig.10. Relative error
Table 3. Root mean square error comparison for the measurement routes
|
ROUTES |
FSPL (dB) |
Plane Earth (dB) |
Okumura (dB) |
COST 231 (dB) |
ECC 33 (dB) |
CCIR (dB) |
Hata (dB) |
Davidson (dB) |
|
URBAN |
43.93 |
37.72 |
11.89 |
11.63 |
9.62 |
12.10 |
12.17 |
13.91 |
|
SUB-URBAN |
50.53 |
43.36 |
22.13 |
17.86 |
8.48 |
31.62 |
24.41 |
27.99 |
|
Average RMSE |
47.23 |
40.54 |
17.01 |
14.75 |
9.05 |
21.86 |
18.29 |
20.95 |
Table 4. Comparison between performance metrics of all models for the entire study region
|
Error |
FSPL (dB) |
Plane Earth (dB) |
Okumura (dB) |
COST 231 (dB) |
ECC 33 (dB) |
CCIR (dB) |
Hata(dB) |
Davidson (dB) |
|
Maximum Error |
58.37 |
50.85 |
26.48 |
23.28 |
13.66 |
30.80 |
27.14 |
32.22 |
|
Mean Error |
46.06 |
39.94 |
14.63 |
11.65 |
2.03 |
19.15 |
15.49 |
19.20 |
|
Skew |
1328.19 |
1152.25 |
411.05 |
328.03 |
52.09 |
531.67 |
433.06 |
540.95 |
|
Relative Error |
0.286 |
0.248 |
0.090 |
0.072 |
0.021 |
0.117 |
0.095 |
0.118 |
|
SC-RMSE |
37.46 |
33.95 |
11.16 |
8.84 |
4.44 |
15.68 |
12.18 |
14.78 |
Fig. 11 (a – e) showed the distribution histograms of the prediction error for five empirical models along the suburban route, in order of fitness. The solid line is the probability density function (PDF) of a Gaussian (Normal) random variable. In Fig 11(a), it can be observed that the prediction errors are nearly distributed symmetrically around the mean error of 5.45 dB. The error distribution within the 0 - 10 dB window dominated the frequency counts which is an indication of a relatively good fitness of the model in terms of predicted path loss in the region. However, for COST 231 model which is the second model that performs better along the route, the prediction error closely followed a normal distribution pattern centered around 16.6 dB as shown in Fig 11(b). The error distributions are found to be similar with a total error window width of 30 dB, though the center of the distribution differs. The error counts within the 3 classes at the center of the window is 21 for the ECC 33 model and 20 for COST 231. The error count for the median class is 13 and the distribution spread along the6window for Hata-Davidson model. As shown in Fig 11(d) and (e), Hata and Free Space Models do not follow normal distribution curve as they are right skewed with quite high error counts and spread along the distribution. ECC 33 model gave a better spread in the error distribution. Therefore, itcan be concluded that ECC 33
model may be found suitable for path loss prediction over the study area.
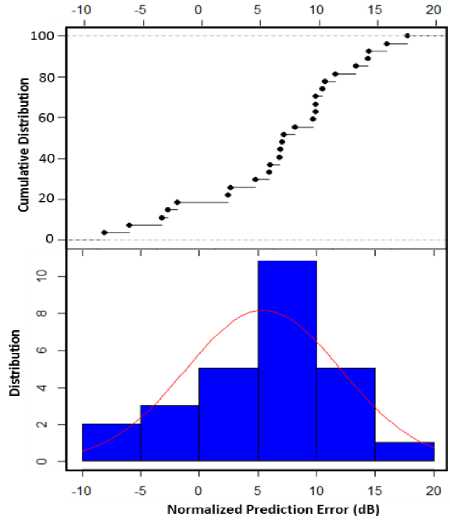
Fig 11a. ECC 33 Model
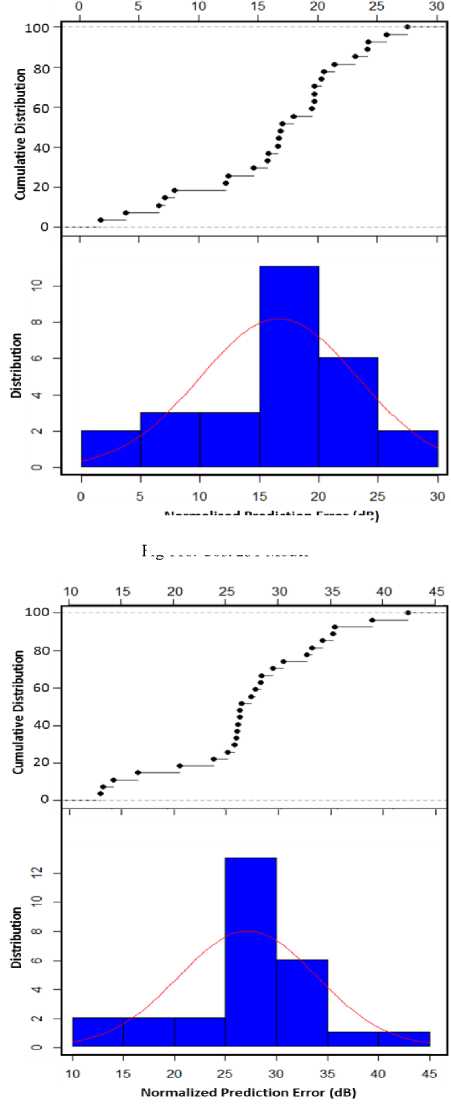
Fig 11c. Davidson Model
Normalized Prediction Error (dB)
Fig 11b. Cost 231 Model
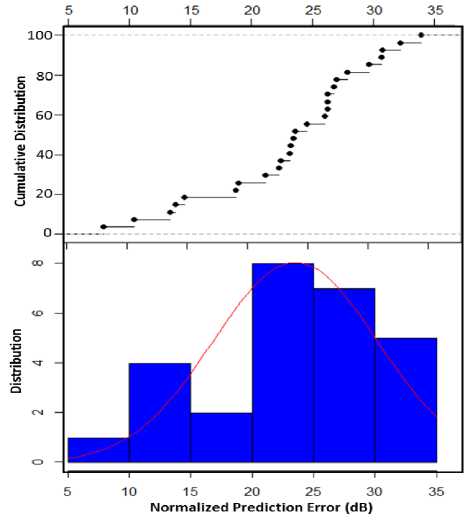
Fig 11d. Hata Model
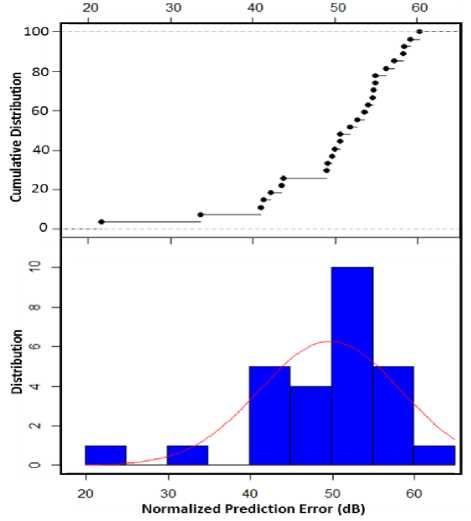
Fig 11e. Free Space Model
-
VI. Conclusion
In this study, the error bounds of eight widely used empirical path loss models were provided in order to verify their efficacy for the prediction of path losses for TV signals over the study area. The research objective was to determine the model with the least prediction error and with RMSE which falls within acceptable values according to [25, 26, 27]. This objective was achieved; from our findings, ECC 33 model provided the least prediction errors and the closest RMSE values along both measurement routes. The measured path loss gave a mean value of 156.51 dB and 165.41 dB for the urban and sub-urban route respectively. Measuring closely to these values is the path loss prediction by ECC 33 model which yielded 157.90 dB and 159.95 dB. While Plane Earth and Free Space models perform woefully for both routes, with higher RMSE and SC-RMSE values, COST 231, Okumura, CCIR and Hata, present RMSE less than 12 dB and Spread Corrected RMSE (SC-RMSE) less than 8 dB for the urban route, and perform better when compared with the suburban route. Further results on the error spread as a function of distance for suburban route revealed that ECC 33 model provided a very near good fitness and COST 231 model followed very closely. In terms of mean value errors, the ECC 33 model gave the least mean error values, very close to zero, slightly skewed to the negative and positive for the urban and suburban route respectively. However, COST 231, CCIR, Okumura, Hata and Davidson also provided better skew for the Urban route, but Plane Earth and FSPL gave worst results. It was also observed that the models prediction errors were nearly distributed symmetrically although around different mean errors for the suburban route under consideration.
Conclusively, these results indicate that no single model provided a good fit consistently but the ECC 33 had the closest value. With these findings, we recommend that ECC 33 model be adapted for use at predicting path losses on the UHF channel and TV white spaces over the study area.
References Assessment of Error Bounds for Path Loss Prediction Models for TV White Space Usage in Ekiti State, Nigeria
- ETSI EN 301 598 White Space Devices (WSD); Wireless Access Systems Operating in the 470 MHz to 790 MHz TV Broadcast Band; Harmonized EN covering the essential requirements of article 3.2 of the R&TTE Directive
- Research Paper on Broadband Deployment through TV-White Space; Telecommunication Engineering Centre, Ministry of Communication and Information Technology, India. TEC: ISO 9001:2008
- Nasir Faruk., AdesekoA. A. and Yinusa. A. A. Error Bounds of Empirical Path Loss Models at VHF/UHF Bands in Kwara State, Nigeria. Conference Paper, July 2013. DOI: 10.1109/EUROCON.2013.6625043
- Nnadi Nathaniel Chimaobi, IfeanyiChimaNnadi, Chibuzo Promise Nkwocha. Comparative Study of Least Square Methods for Tuning CCIR Path Loss Model. Communications. Vol. 5, No. 3, 2017, pp. 19-23. doi: 10.11648/j.com.20170503.11
- CCIR: http://w3.antd.nist.gov/wctg/manet/calcmodels_r1.pdf [Accessed on 10/09/2019]
- COST231, “Urban transmission loss models for mobile radio in the 900 and 1800 MHz bands (revision 2).” COST 231 TD (90) 119 Rev. 2, The Hague, the Netherlands. September 1991
- V.S.Abhayawardhana, I.J. Wassell, D. Crosbsy, M.P. Sellars, and M.G. Brown, “comparison of empirical propagation path loss models for fixed wireless access systems” IEEE Vehicular Technology Conference, Vol 1, pp 73-77, 2005.VTC 2005-Spring. 2005.
- K. Feher, “Wireless Digital Communications Modulation & Spread Spectrum Applications”. USA: Prentice Hall, Inc, 1995.
- Michael S. Moll el, Dr. Michael Kisangiri, “An Overview of Various Propagation Model for Mobile Communication”. Pan African International Conference on Information Science, Computing and Telecommunications (2014)
- M. Hata, “Empirical formula for propagation loss in land mobile radio services”, IEEE Trans. Vehicular Technology., Vol 29, No. 3, pp. 317 – 325, Aug. 1980.
- Davidson, "A Report on Technology Independent Methodology for the Modeling, Simulation and Empirical Verification of Wireless Communications System Performance in Noise and Interference Limited Systems Operating on Frequencies between 30 and 1500 MHz", TIA TR8 Working Group, IEEE Vehicular Technology Society Propagation Committee, May 1997.
- Wali Samuel, Njumoke N. Odu, Samuel Godwin Ajumo, “Performance Evaluation of Hata-Davidson Pathloss Model Tuning Approaches for a Suburban Area”. American Journal of Software Engineering and Applications. Vol. 6, No. 3, 2017, pp. 93-98. doi: 10.11648/j.ajsea.20170603.16
- Okumura Y., Ohmori E., Kawano T. and Fukuda K. “Field strength and variability in UHF and VHF land-mobile radio services.”, 1968. Rev. Elec. Commun. Lab. 16: 825-873.
- Sylvain Ranvier, “Path loss models”, S-72.333 Physical layer methods in wireless communication systems, Radio Laboratory / TKK, 23 November 2004.
- M. S. Mollel and M. Kisangiri, “Comparison of Empirical Propagation Path Loss Models for Mobile Communication” Computer Engineering and Intelligent Systems, vol. 5, pp. 1 -10. 2014
- Z. Nadir, N. Elfadhil and F. Touati, “Path loss Determination, using Okumura-Hata Model and Spline Interpolation for missing data for Oman’’– Proceedings of Journal of World Congress, 2008.
- G. Y. Delisle, J. P. Lefevre, M. Lecours, and J. -Y. Chouinard, “Propagation loss prediction: a comparative study with application to the mobile radio channel,” IEEE Transactions on Vehicular Technology, Vol. 34, no. 2, pp. 86–96, 1985.
- Obiyemi O.O., Ibiyemi T.S., Gbenga -Ilori A.O. and Ojo J.S. “Path loss model for radio wave propagation at VHF/UHF bands using electric field strength measurement over Ilorin middle-belt, Nigeria”, Proceedings of IEEE 2nd International Conference on Advances in Computational Tools for Engineering Applications (ACTEA), 12–15 December, 2012. pp.43–46.
- Blaunstein N., Censor D. and Katz D. “Radio propagation in rural residential areas with vegetation”, Progress in Electromagnetics Research, Vol. 40, pp.131–153, 2003.
- Akinbolati, A (2011). Survey of Electric Field Strength to Determine the Coverage Areas of Broadcasting Service of Ekiti State (BSES) UHF Channel 41 Television Station. A PGD in Electrical and Electronic Engineering Project; Submitted to the Department of Electrical and Electronic Engineering, University of Ado Ekiti, Nigeria.
- Akinbolati, A., Femi-jemilohun, O. J., and Tikyaa E. V. (2018b). Path Loss Modeling Suitable for Macro Cell Prediction for Analogue Decimetric Waves in Ekiti State, Nigeria, FUDMA Journal of Science, Vol. (2) (3), pp. 250-255
- Mukesh Kumar, Vijay Kumar and Suchika Malik, “Performance and Analysis of Propagation Models for Predicting RSS for Efficient Handoff”, International Journal of Advanced Scientific and Technical Research, Issue 2, Vol 1, February, 2012.
- S. Saunders and A. Aragón-Zavala, Antennas and propagation for wireless communication systems: John Wiley & Sons, 2007.
- G. S. Bola and G. S. Saini, "Path Loss Measurement and Estimation Using Different Empirical Models for WiMax in Urban Area”.
- Ayeni, A.A., Faruk, N., Olawoyin, L., Muhammad, M.Y. and Gumel, M.I. “Comparative assessments of some selected existing radio propagation models: a study of Kano city, Nigeria”, European Journal of Scientific Research, Vol. 70, No. 1, pp.120–127, 2012.
- Nasir Faruk., Adeseko A. A., Yinusa. A. A., and Nazmat S. B., “Improved Path-Loss Model for Predicting DTV Coverage for Secondary Access”, International Journal of Wireless and Mobile Computing, Vol. 7, No. 6, 2014.
- Oluwafemi I. B., Femijemilohun O. J., Oluwasola S. L., and Owolabi I. E., Investigation of error bounds of empirical path loss Models at UHF band in Ondo State, Nigeria, ARPN Journal of Engineering and Applied Sciences, vol. 13, no. 9, 2018
