Assessment of mutual influence of economic and ecological processes

Author: Druzhinin Pavel Vasilevich, Shkiperova Galina Timofeevna
Journal: Economic and Social Changes: Facts, Trends, Forecast @volnc-esc-en
Section: Environmental economics
Article in issue: 2 (32) т.7, 2014.
Free access
The article considers two issues: the assessment of the influence of economic development on the environment and the assessment of the impact of climate change on the development of certain economic sectors. The authors used methods of statistical analysis and economic-mathematical modeling. The article reveals differences in the dynamics and defines the nature of the relationship between GRP per capita and emissions of harmful substances into the atmosphere (including greenhouse gases) for Russia’s regions. It is shown that the dynamics in some regions in 2000-2011 corresponds to the environmental Kuznets curve. The factors that affect the reduction of anthropogenic impact were determined. Several models for estimating the impact of changes in climatic conditions on the productivity of various crops were designed and tested.
Economic growth, environmental kuznets curve, greenhouse gas emissions, climate change
Short address: https://sciup.org/147223576
IDR: 147223576 | UDC: 332.1:574 | DOI: 10.15838/esc/2014.2.32.16
Text of the scientific article Assessment of mutual influence of economic and ecological processes
At present, the consistent trends can be observed in the increase of environmental risks of economic development; moreover, the effect has a bilateral nature. The research into the problems of climate change, the causes and effects of global warming is reflected in many domestic and foreign publications. Regardless of the diversity of opinions, one can consider the impact of economic growth on climate change quite reasonable. In turn, possible changes in climate can have different positive and negative economic, social and environmental effects. High rates of economic growth in our country are, as a rule, typical of resource-producing regions, the economy of which is based on resource-extracting and resource-intensive industries. Their desire to achieve greater levels of economic development leads to the depletion of natural resources and enhancement of anthropogenic impact on the environment. Therefore, in modern conditions, it is necessary to study and forecast mutual influence of economic and ecological processes. The research into the influence of these factors on the regions’ economy and ways of adaptation is carried out under the project No. 12-22-18005а/Fin, which is supported and funded by the Russian Humanitarian Science Foundation.
The most important task consists in assessing and forecasting the impact of the economy on the environment, including greenhouse gas emissions. Accordingly, there is an opposite effect: climate changes, natural disasters become more frequent; it affects the economic development, and there emerges the necessity to assess the impact of climate change on certain economic sectors, mainly on agriculture.
The studies, carried out at the end of the 20th century in the field of environmental economics and natural resources management, proposed an inverted U-shaped form of relationship between the level of pollution and gross domestic product (GDP) per capita; this relationship is known as the environmental Kuznets curve (EKC). The suggested hypothesis assumes that alongside GDP growth (gross regional product – GRP – for regions) per capita up to a certain level, the amount of pollution per capita increases at first and decreases afterwards. The estimated reduction in environmental load is explained not by a simple flow of time, but by a set of factors [1, 2, 8, 12], including the change in the consumption patterns of the population, effective ecological policy on a micro-, meso-and macro-level, structural changes in the economical and technological modernization of production. According to the hypothesis, the economic growth may become a solution rather than a source of the problem [13].
The major criticism and contradiction of the EKC model is connected with the possibility of developed countries to transfer their ecologically harmful industries to underdeveloped countries. In this case, the EKC hypothesis is true only for developed countries [6]. Moreover, the EKC model may be advantageous for those countries, where economic activity is accompanied by environmental pollution, as it can be assumed that with a certain level of development being achieved, the environmental situation begins to improve. In this connection, a number of authors have suggested that EKC cannot be a global model, but may exist in individual countries [5, 16]. Another drawback of the EKC model is that it does not take into account a critical level of anthropogenic impact and opportunities of the assimilation potential in the territory. The achievement of the income level that corresponds to the inflection point in EKC can require much time, and the peak of pollution can occur much earlier. C. Tisdell [15] suggests that, in this case, the inflection point of EKC can not be achieved in any case. The improvement of the environmental quality is possible only if the amount of negative impact does not exceed the assimilation potential of the territory. Besides, many types of pollution tend to accumulate in the natural environments, and when their concentration becomes critical, environmental quality may deteriorate. As a result of such a cumulative effect, pollution will grow even beyond the inflection point of EKC, when the volume of waste production is reducing, but still accumulating. This fact casts doubt on the possibility of using EKC when making forecasts for many countries and regions.
The empirical studies of EKC lead to contradictory results. They were mostly carried out separately for well-known regulated types of pollutants, and the majority of evidence of an inverted U-shaped relationship applies to such atmosphere pollutants as suspended particles, sulfur dioxide and carbon monoxide. There are certain estimates of greenhouse gas emissions for the majority of developed and developing countries [7, 9]. For example, the estimate of the time series models by the emissions of carbon dioxide, sulfur dioxide and nitrogen oxide separately for the Netherlands, Germany, the UK and the USA shows that economic growth has a positive impact on the dynamics of these pollutants.
According to the traditional EKC model, the level of pollution grows until GDP per capita reaches the amount of 5–8 thousand US dollars; then the pollution volume begins to decline and may reach a pre-industrial level. Some politicians regard it as an opportunity to choose priorities – first economic growth and then environmental protection. It should also be noted that the maximum point varies greatly. For instance, in works [11, 14], according to the study of sulfur dioxide, the inflection points of EKC were obtained at 3.1 and 101.2 thousand US dollars in the 1990 prices, respectively; it can be explained by several reasons including the use of different data sets. A number of recent empirical studies, confirming the EKC hypothesis, show that the curve’s level reduces and shifts to the left, because the economic growth is accompanied by a lower level of pollution growth in the early stages of industrialization, and the inflection point of EKC is achieved at a lower income level [6].
The absence of EKC for greenhouse gas emissions can be explained by the fact that they cause a global effect, not a local one. The EKC hypothesis, as emphasized above, is most often confirmed for developed countries, as for developing countries, they are becoming leaders in global greenhouse gas emissions in recent years. Thus, according to B.N. Porfir’ev, since 2007, the world economy growth by 45% has been provided by the BRIC nations (Brazil, Russia, India and China), their share in total emissions of greenhouse gases is increasing, thus, their role in solving this problem is becoming more important [3].
Many foreign researches prove that the level of GDP is not the only factor influencing the change of the anthropogenic impact on the environment. Changes in a sectoral structure, technology and production scales, degrees of economical openness, a state regulatory role in the sphere of environmental protection and ecological standards have also a paramount importance. Therefore, the single-factor models, such as a Weibull function, are rarely used in the research of eco-economic processes. They do not take into account the influence of several factors, state regulation, in particular, which, as it was revealed in works [6, 11], is a dominant factor in the pollution reduction. The countries and regions, where economic policy is aimed at rapid income growth and employment, can cause serious harm to the environment if the relevant environmental standards are not introduced.
The recent studies confirm that the technological changes are determinants. The analytical model, presented in the work [10], shows that it is modernization that produces an effect of emissions reduction and leads to the ECK appearance when economy is developing. In Spain, for example, the technological changes have fully compensated the growth of production volumes for sulfur dioxide emissions, but for a number of other pollutants the modernization effect was considerable, but still much less than the scale effect [12]. The research [7] has indicated that the form of pollution dependence on GRP can be different and is defined by the country particularities, such as technological progress, activity of structural changes and influence of external shocks. The calculations, performed in the work [9], have led to the conclusion that for Canadian regions there is no pollution dependence on GRP but there is dependence on population and technologies, as well as on an industry share, an export share, an import share, a crude oil price and on other factors.
As the work [2] reveals, for the Russian Federation and its regions the process of modernization and economy restructuring, significant in many Russian regions, has the most essential influence on the change of ecological indicators. The boost in a service sector and decrease in the industry share, which is the main pollutant, have provided a significant part of the environmental load reduction in the Russian Federation and its regions.
The assessment of an economical development impact on the environment was made by functions, in which economical development was described by the indicators, used in forecasting. It gives an opportunity to evaluate the effects of different investment decisions. To study eco-economic processes, we used multiplicative functions with constant and changing factorial elasticities, constructed by the type of production functions, sometimes taking into account neutral environmental progress:
Z ( t ) = A ( t ) X U 1 ц ( t ) X U 2 " ^ ( t ) X U 3 3 ( t), (1)
where: Z(t) is an analyzed ecological index;
A(t) – neutral environmental progress;
U1(t) – a factor that reflects the economical development and, as a rule, has a negative influence on the environment (GDP, investments in the economy, investments in new construction and others);
U2(t) – a factor that reflects the environmental activity and has a positive impact on the environment (environmental investments and others);
U3(t) – a factor that reflects the change of the existing industries and has, as a rule, a positive impact on the environment (investments into modernization upgrade and others);
t – a year;
μ , η and ν – constants (factorial elasticity).
The impact of economical development on greenhouse gas emissions in the Russian Federation.
While considering the ecological situation in Russia, we can note that in the 1990s the economical impact on the environment decreased rapidly with the slowdown in production, in the 2000s the decline became slow, but some indicators of the environmental load increased slightly (fig. 1) . So, since 2002 the GDP growth has been accompanied by a slight rise in greenhouse gas emissions.
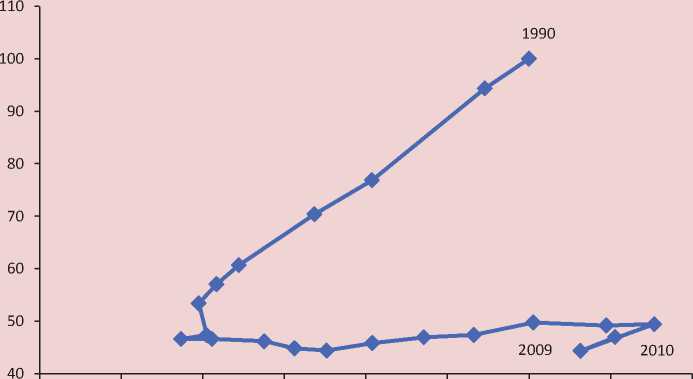
To estimate the relationship between environmental and economic indicators approximately, it is worthwhile to modify these graphs, constructing them as dependency of environment pollution indicators on GDP dynamics. As a result, the graph distinguishes two periods in almost all cases (fig. 2) .
Figure 2 shows that in the 1990s GDP and greenhouse gas emissions decreased approximately with the same pace. In the 2000s the GDP volume went up, then in 2008–2009 it went down and since 2010 it has been growing again. The volume of greenhouse gas emissions in this period is almost identical to the GDP fluctuations, but much slower. In this situation it can be assumed that the environmental measures, equipment upgrade and structural shifts in the economy contributed to the enhancement of ecological situation in the 2000s. But the graph does not correspond to the ECK.
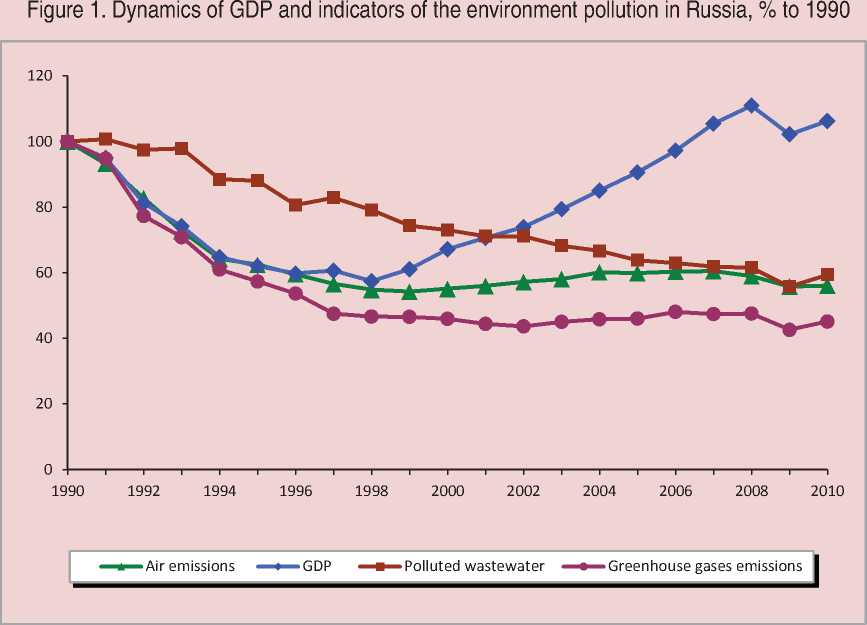
Figure 2. Changes in greenhouse gas emissions per capita, depending on the dynamics of Russia’s GDP per capita, % to 1990
40 50 60 70 80 90 100 110 120
GDP per capita, %
The calculations were made by means of functions in order to determine the effect of different factors (1). Unfortunately, the information on greenhouse gases for the regions is missing and the calculations were made only for the Russian Federation. According to the calculations, the investments impact in the air protection is insignificant. Apparently, the structural changes in the economy and modernization have the main positive influence. The changes take into account neutral environmental progress in the function (1) (with good statistical characteristics R2 = 0.99, and F = 838):
77/v\ ^0.53 6 ч where: X1(t) – GDP;
E(t) is greenhouse gas emissions;
μ = 0.766, η = 0.
The economical growth increased greenhouse gases emissions, but modernization and structural changes in the economy reduced them by 4.9% annually. As a result, in the 2000s the GDP growth exceeded the rates of greenhouse gas growth dramatically. To determine the modernization impact the calculations were carried out by means of functions (1) with the investments allocations into modernization. In the end the influence of investments on the atmospheric air protection turned out to be inconsiderable and the impact of modernization – meaningful (in case of good statistical characteristics: R2 = 0.85, F = 38.2):
E ( t ) = e 26 x Xn 0,304( t ) x Xm -0’052( t ) , (3)
where: Xn – cumulative investments in new construction;
Xm – cumulative investments in modernization; μ = 0.304 , η = 0, ν = -0.052.
As the result, the growth of cumulative investments in new construction by 1% increased emissions by 0.3%, and the rise of cumulative investment in modernization by 1% reduced emissions by 0.05%.
EKC of Russian regions. As in the 1990s almost all Russian regions experienced an economic decline, accompanied by the decrease of anthropogenic load on the environment, time series of this period can not be described by the EKC. Therefore, the study covers the period of 2000–2011, when most regions of Russia had economic growth, providing different effects on an ecological index. The graph of dependence of the greenhouse gas emissions on GDP per capita ( fig. 2) , which distinguishes two periods, reveals it. In the 1990s the amount of emissions declined alongside with the GDP, and in the 2000s the GDP growth was followed by a slight increase in the greenhouse gas emission. Therefore, we can conclude that the EKC hypothesis, concerning greenhouse gas emissions, was not confirmed in the 2000–2011economic growth period.
The analysis of the emissions dependence on stationary sources and economical development makes it possible to single out four main forms of connection: the economic growth is followed by the emissions (direct linear); the economy growth leads to emissions reduction (reverse linear); U-shaped or N-shaped forms of connection; an inverted U-shaped form (ECR).
The EKC hypothesis on the emissions from stationary sources into the atmosphere can only correspond to 19 regions of the Russian Federation. The classical EKC is characteristic for Tyumen, Orenburg, Chelyabinsk, Leningrad, Novgorod, Saratov oblasts, Kamchatka, Perm and Khabarovsk krais, and Chukotka Okrug, the Altai and Udmurt republics. The maximum point for these regions was observed in the period of 2003–2005, with the average GRP per capita of more than 100 thousand rubles, or 8–12 thousand US dollars at purchasing power parity (PPP) being re. For the Republic of Altai and the Udmurt Republic the inflection point is achieved at lower income levels – 45.3 and 84.6 thousand rubles, respectively.
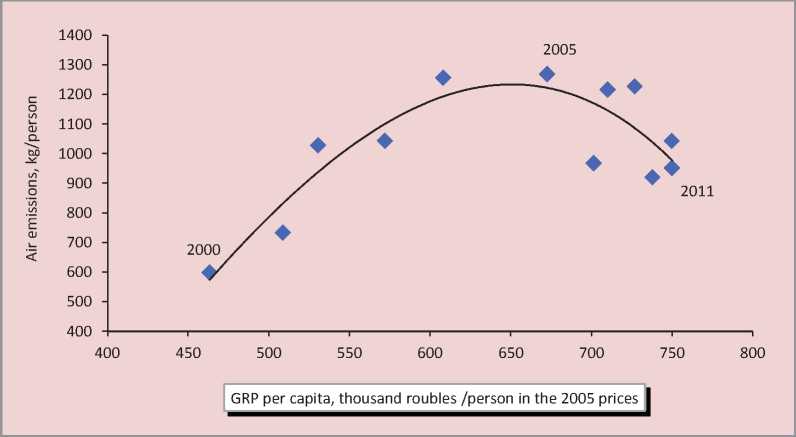
The highest levels are characteristic for the Tyumen Oblast where till 2005 the economy growth was accompanied by intensive emissions into the atmosphere; in 2006–2011 the level of pollution decreased by 25% while GDP per capita increased by 12% during this period. The inflection point corresponds to 672 thousand rubles per person (42.5 thousand dollars per person at PPP) and 1268.7 kg per person of polluting substances emissions into the atmosphere (fig. 3).
The preliminary graphs analysis of the Russian regions for a one-year period (“crosssection”) shows that the connection between economic growth and pollution is rather ambiguous. The maximum point for each region is different and, probably, for most of them t is not reached yet. The structure of the regions groups have changed in 2000 and 2010. The differentiation of environmental indicators went up, while the revenue level went down slightly [4]. The statistical analysis confirms these data: the emissions variation coefficient into the atmosphere increased from 1.25 in 2000 to 1.31 in 2010, and GRP per capita decreased from 0.81 to 0.79 .Thus, the trend, calculated for a later time period at higher levels of economical development, suggests that regions pass the same stage of development at higher levels of differentiation of environmental indicators. Thereafter, the EKC maximum point is shifting up and to the right. The climate change and the regional economy. The problem of global climate change is most relevant for such industries as agriculture. The study of the USA and Canada regions has shown that more Northern regions can increase crop yields improving climatic conditions and choosing more productive and heat-demanding crops and, at the same time, in the southern regions the conditions can worsen. The research of the current climate change was carried out on the agriculture of separate RF regions. The models to identify the impact of various factors, primarily of temperature and precipitation on the yield of various agricultural crops are constructed. The calculations by means of the data of separate regions of Northwestern Russia are performed. To assess this impact, the system description of the processes is prepared, and
Figure 3. Changes in emissions into the atmosphere per capita from stationary sources in the Tyumen Oblast in 2000–2011, depending on the growth of GRP per capita
the specific features of regional development are studied, the main factors, determining the change of agriculture indicators, particularly of crop yield, are singled out and described, factors and yields data are gathered and analyzed, indicators graphs to identify current dependencies are constructed.
To estimate the climate change impact on agriculture we used models, based on regression equations, where the yield in different regions is considered depending on the selected factors: climate, farming, soil conditions, socio-economic characteristics, a management level, a technological level and peculiarities of a particular culture. Yields equation by regions were built according to the time series for the same region, “cross-sections” – by regions for a one year period, according to panel data.
For regions linear and multiplicative functions were taken into account while calculating:
Y ( t ) - A x t + B + C x T 2( t ) +
+ D x T (t ) + E x R 2( t ) + F x R ( t ) +
+ G x M ( t) + H x X ( t ) (4)
Y(t) = A(t) x (To2 - T2(t))^ x x (R 02 - R 2( t))11 x M v (t) x X CT (t) (5)
where: T0 – optimum temperature,
T – deviation from the optimal temperature,
R0 – optimal precipitation,
R – deviation from the optimal amount of precipitation,
M – volume of fertilizers in comparison to 1990,
X – socio-economic and other characteristics.
Parameters ε 1 = μ , ε 2 = η , ε 3 = ν и ε 4 = σ are factor elasticities. They indicate the change in the yield, with a relevant factor having risen by 1%. In the first case, the optimal parameters are defined in the course of calculations, in the second – in the course of preliminary graphs analysis and experts consultation.
Some climatic characteristics are taken into consideration. They are average temperature, sum of active temperatures and gross precipitation for different periods (for a year, for a season, between harvesting periods, from seeding to harvesting, for June, July and for the third decade of June). Since the time series are short and the number of factors must be minimal, one can use a hydrothermal factor for different periods, in practice there is the best connection with yield during the period from seeding to harvesting. The agro-technical indicators are the use of mineral and organic fertilizers per hectare of crops. The socio-economic parameters take into account a state of agriculture in the region (volume and dynamics of investments in agriculture), a level of economical development of the regions, dynamics of economical development of the regions (GRP in comparable prices) and some other features. The problem is to consider soil characteristics of the region. The soil-ecological index and other indicators are calculated for local territories and it is difficult to calculate an average one for the region as a whole. The impact of changes in the amplitude of temperature fluctuations has not been studied yet. Some information was obtained from the data book of the Federal State Statistics Service and data from various departments. In addition, the information, collected by the institutes of the RAS, was taken into account.
Russian Central and Northern regions, particularly the Northwestern Federal District regions, were expected to gain profit by analogy with the results, obtained for American regions. This hypothesis approbation has shown that for certain crops (grain) the profit is insignificant, and it is much less than the losses of the southern regions for the given cultures. For other crops warming leads to yields growth within 5–10%.
Conclusion. Time series analysis testifies that the EKC hypothesis of greenhouse gas emissions and pollutants, emitted from stationary sources, for the majority of Russian regions is not proved. It is obvious that a significant part of the regions is still far from the EKC maximum point by main indicators of an environmental impact; and the potential economic growth can be accompanied by the increased environmental degradation. In the framework of the EKC model it can be argued that with the GRP growth the level of contamination decreases in highly developed regions and grows in inefficient regions. This conclusion on Russian regions coincides with the results of international research. However, if foreign studies have shown that recently the EKC level have reduced and shifted to the left in majority of developed and developing countries, but the picture is quite opposite for Russian regions. The economic growth is accompanied by higher levels of pollution, and the inflection point is achieved at a higher level of GRP. Thus, the curve level for Russian regions increases slightly and moves to the right.
According to the calculations, one can conclude that with continued warming the agricultural production does not rise automatically, but the expected warming creates potential for the growth with certain efforts being required to use it.
First of all it is necessary to increase financing of agricultural science. Yields boost, due to warming with traditional cultures preserving, is to be negligible, not exceeding 10%. The higher management level and transition to more modern technologies can benefit greatly. The positive influence is exerted by the change in the sown areas structure, the transition to late-grown and more productive varieties and to new, more heat-loving crops. It requires increasing investments in agricultural science. The regions adaptation to expected climate change and focus of the agricultural science on adaptation projects are required to take advantage of opportunities and minimize expected losses.
References Assessment of mutual influence of economic and ecological processes
- Bobylev S.N. Vzaimosvyaz’ mezhdu urovnem blagosostoyaniya i ustoychivym razvitiem. Krivaya Kuznetsa . Sotsial’no-ekonomicheskiy potentsial ustoychivogo razvitiya . Ed.by L. Khens and L. Mel’nik. Sumy: Universitetskaya kniga Publ., 2007. Pp. 134-159.
- Druzhinin P.V., Shkiperova G.T., Moroshkina M.V. Vliyanie razvitiya ekonomiki na okruzhayushchuyu sredu: modelirovanie i analiz raschetov . Petrozavodsk: KarNTs RAN Publ., 2010. 119 p.
- Porfir’ev B.N. Priroda i ekonomika: riski vzaimodeystviya . Moscow: Ankid, 2011. 352 p.
- Shkiperova G.T. Ekologicheskaya krivaya Kuznetsa kak instrument issledovaniya regional’nogo razvitiya . Ekonomicheskiy analiz: teoriya i praktika , 2013, no. 19, pp. 8-16.
- Cole M. Re-Examining the Pollution-Income Relationship: a Random Coefficients Approach. Available at: http://economicsbulletin.vanderbilt.edu/2005/volume14/EB-05N50001A.pdf.
- Dasgupta S., Laplante B., Wang H., Wheeler D. Confronting the Environmental Kuznets Curve. Journal of Economic Perspectives, 2002, Vol. 16 (1), pp. 147-168.
- Fried B., Getzner M. Determinants of CO Emissions in a Small Open Economy. Ecological Economics, 2003, Vol. 45, pp. 133-148.
- Grossman G., Krueger A. Economic Growth and the Environment. The Quarterly Journal of Economics, 1995, Vol. 110, pp. 353-377.
- Lantz V., Feng Q. Assessing Income, Population, and Technology Impacts on CO Emissions in Canada: Where’s the EKC? Ecological Economics, 2006, Vol. 57, pp. 229-238.
- Müller-Fürstenberger G., Wagner M. Exploring the Environmental Kuznets Hypothesis: Theoretical and Econometric Problems. Ecological Economics, 2007, Vol. 62. pp. 648-660.
- Panayotou T. Economic Growth and the Environment. Available at: http://www.cid.harvard.edu/cidwp/pdf/056.pdf.
- Roca J., Serrano M. Income Growth and Atmospheric Pollution in Spain: An Input-Output Approach. Ecological Economics, 2007, Vol. 63, pp. 230-242.
- Rothman D., Bruyn S. Probing into the Environmental Kuznets Curve Hypothesis. Ecological Economics, 1998, Vol. 25, pp. 143-145.
- Stern D., Common M. Is There an Environmental Kuznets Curve for Sulfur? Journal of Environmental Economics and Management, 2001, Vol. 41, pp. 162-178.
- Tisdell C. Globalisation and Sustainability: Environmental Kuznets Curve and the WTO. Ecological Economics, 2001, Vol. 39, pp. 185-196.
- Vincent J. Testing for Environmental Kuznets Curves within a Developing Country. Environment and Developmental Economics, 1997, Vol. 2, pp. 417-433.
