Assessment of Sleep Quality and Stress Level in Bus Drivers in and around Chennai City – A Cross Sectional Study

Author: Joel, Karthika M., Vijayalakshmi B., PremKumar S., Sriranganathan T.
Journal: Журнал стресс-физиологии и биохимии @jspb
Article in issue: 3 т.16, 2020.
Free access
The city bus drivers are more prone to various physical and mental stress due to the heavy traffic in the city. They are also on shift work causing decrease in the sleep quality which results in increase in stress level and negatively impacts on the health and quality of life. Objective: To assess the stress level among bus drivers in and around city of Chennai Methods: A Cross-sectional study was conducted on a group of 100 city bus drivers from January 2019 to March 2019. The "Perceived Stress Scale (PSS)" questionnaire was used to measure stress level. The Pittsburgh Sleep Quality Index (PSQI) was used to measure of sleep quality. Results: The PSQI scores were poor in 89% of the studied population. The mean PSQI scores were 10.05 and standard deviation of 3.016. Scores of the Perceived Stress Scale shows that 23 % had low stress, 28 % had moderate stress and 49 % had high stress levels. The study shows significant association between stress levels and poor sleep quality. Conclusion: The result of the study show that the bus drivers in the city are stressed and the stress is high during middle age.
Perceived Stress Scale (PSS), Pittsburgh Sleep Quality Index (PSQI)
Short address: https://sciup.org/143173844
IDR: 143173844
Text of the scientific article Assessment of Sleep Quality and Stress Level in Bus Drivers in and around Chennai City – A Cross Sectional Study
The city bus drivers are more prone to various physical and mental stress due to the heavy traffic in the city. This stress gives many physical, mental and behavioral issues (Kompier, Di Martino, 1995). There are several adverse psychophysical effects due to driving bus, in which the most common is hypertension (Johansson et al. , 2012). This stress level also makes the bus drivers more susceptible to the usage of alcohol, tobacco, illegal drugs and over the counter medicines (Ragland et al. , 2000).
The bus drivers because of their seating positions and the ergonomics of the seat have an increased risk of getting musculoskeletal disorders which causes serious health problems, physical and mental stress which may increase the risk of cardiovascular illness in comparison to the other professional groups (Tse et al. , 2006).
Shift-work is very common among the bus drivers and they do not get proper sleep due to several trips throughout the day and night which makes them susceptible to problems like irritability, daytime sleepiness and insomnia, resulting in the further increase in stress level and people who are stressed end up eating more, indulge in smoking and drinking. This affects their sleep-wake cycle and quality of sleep, negatively impacting on their health and quality of life (Hauri, 1982). The lack of sleep causes mental fatigue which inturn results in loss of attention and eventually more number of accidents (Florez-Lozano, 1980). Stress at work place is also carried home which creates problems in their household as well where they expect to find peace. (Sagar et al. , 2013).
Hence this study was taken up to assess the sleep quality and stress level and to find its association among bus drivers in and around the city of Chennai.
MATERIALS AND METHODS
Study design
A Cross-sectional study was conducted on a group of 100 city bus drivers who are professionally active from January 2019 to March 2019, after obtaining ethical approval from the Institutional Ethics Board, Saveetha Medical College and Hospital. Prior written informed consent was obtained from all the participants. Data collection was done using the Perceived Stress Scale (PSS) which is a questionnaire widely used to measure stress level, validated by Sheldon Cohen et al. (1983) and by the Pittsburgh Sleep Quality Index (PSQI).
The Perceived Stress Scale (PSS) is a classic stress assessment tool developed in 1983 and remains a popular choice for helping us understand how different situations affect our feelings and our perceived stress. The questions in this scale ask about feelings and thoughts during the last month. The participants will be asked to indicate how often they felt or thought a certain way.
The Pittsburgh Sleep Quality Index (PSQI) developed by Buysse and colleagues to provide a standardized measure of sleep quality is based on eighteen self-reported questions; measuring: subjective sleep quality, sleep latency, habitual sleep efficiency, sleeping medication usage, sleep duration, sleep disturbances, and daytime dysfunction. The score from each category is added to get a global score ranging from 0-21. A cut-off score of 5 or above is indicative of a sleep disturbance.
It contained responses ranging from 0 to 4 for each question. Each response corresponds to various feelings and thoughts as indicated below.
Statistical Analysis
Then the data was entered in database Statistical Package for the Social Sciences (SPSS) software version 21. Statistical analysis of the data was done using Data analysis was done using Fisher's exact test and P-value < 0.05 was considered as significant.
RESULTS
The study was conducted among bus drivers in and around city of Chennai using PSQI and Perceived Stress Scale and the results are tabulated below.
Sleep quality assessment (PQSI)
Table 1 shows that the Subjective sleep quality was bad in 29%, the Sleep latency was more than 31 min in 29%, sleep duration was less than 6hrs in 50% and the habitual sleep efficiency was less than 84% in 81%.
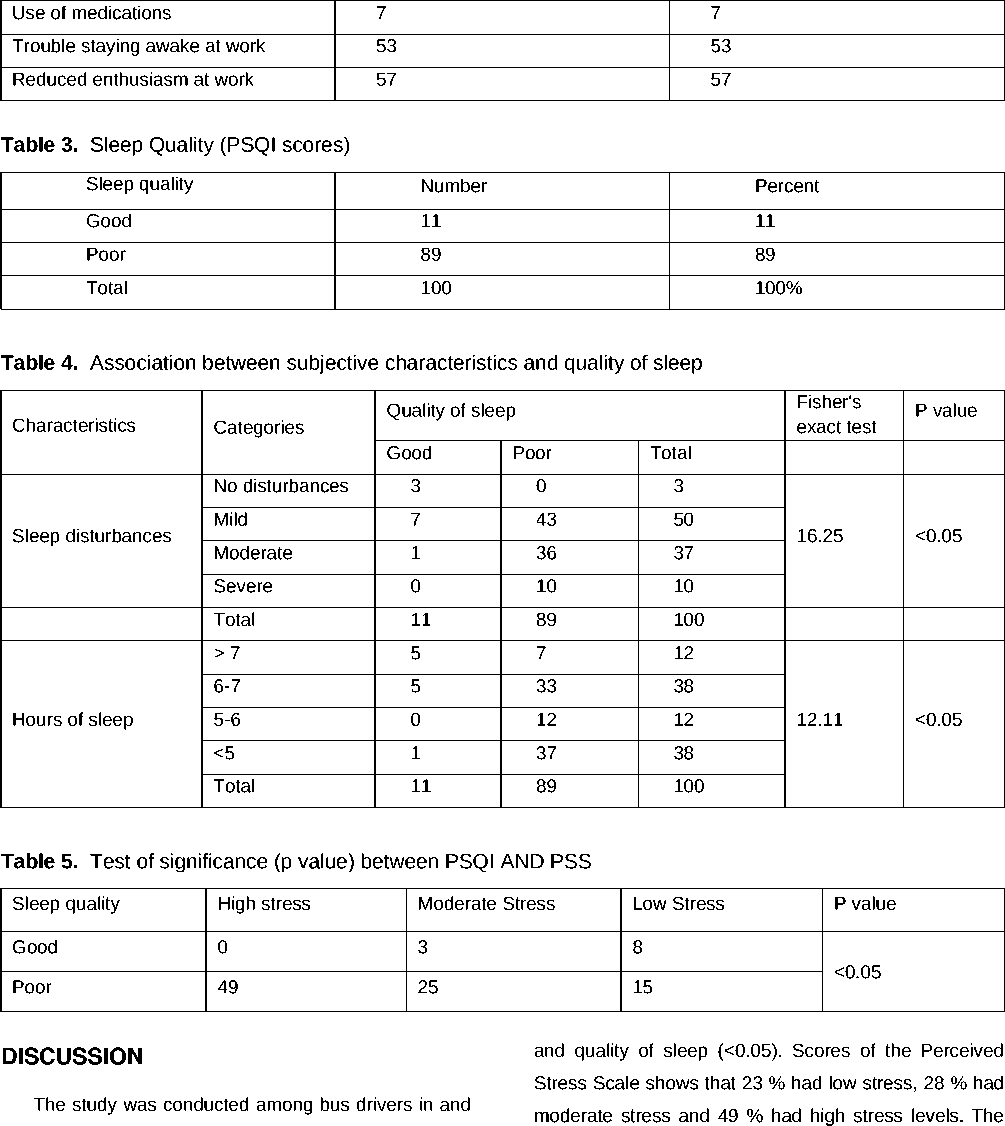
Table 3 shows the PSQI scores which were poor in 89% of the studied population. The mean PSQI scores were 10.05 and standard deviation of 3.016
Table 4 shows association between subjective characteristics like Sleep disturbances, Hours of sleep and quality of sleep and the P value was found to be <0.05.
Stress scores:
Scores of the Perceived Stress Scale:
Scores ranging from 0-13 – 23 %
Scores ranging from 14-26 - 28 %
Scores ranging from 27-40 - 49 %
Table 5 shows the association between PSQI and Perceived Stress Scale scores and the P value was found to be <0.05.
Table 1. Distribution of Study Participants Based On Their Subjective Sleep Patterns (N=100)
|
Characteristics |
Categories |
Frequency (n=100) |
Percent (%) |
|
Very good |
13 |
13 |
|
|
Subjective sleep quality |
Fairly good |
48 |
48 |
|
Fairly bad |
10 |
10 |
|
|
Very bad |
29 |
29 |
|
|
< 15 mins |
25 |
25 |
|
|
Sleep latency |
16- 30 mins |
46 |
46 |
|
31- 60 mins |
8 |
8 |
|
|
> 60 mins |
21 |
21 |
|
|
>7 |
12 |
12 |
|
|
Sleep duration (hours) |
6-7 |
38 |
38 |
|
5-6 |
12 |
12 |
|
|
<5 |
38 |
38 |
|
|
>85% |
19 |
19 |
|
|
Habitual sleep efficiency (score) |
75- 84% |
20 |
20 |
|
65- 74% |
18 |
18 |
|
|
<65% |
43 |
43 |
Table 2. Subjective Sleep Disturbances Experienced By the Participants in the Past Week (n=100)
|
Sleep disturbances |
Number (n=100) |
Percent (%) |
|
Waking in the middle of the night |
54 |
54 |
|
Getting up to use the wash room |
42 |
42 |
|
Due to breathing difficulty |
11 |
11 |
|
Cough or snoring |
28 |
28 |
|
Feeling too cold |
9 |
9 |
|
Feeling too hot |
6 |
6 |
|
Having bad dreams |
38 |
38 |
|
Feeling pain |
4 |
4 |
|
Other reasons |
20 |
20 |
around city of Chennai using PSQI and Perceived Stress Scale. This study revealed that the Subjective sleep quality was bad in 29%, the Sleep latency was more than 31min in 29%, sleep duration was less than 6hrs in 50% and the habitual sleep efficiency was less than 84% in 81%. The PSQI scores were poor in 89% of the studied population. The mean PSQI scores were 10.05 and standard deviation of 3.016. The study shows significant association between subjective characteristics like Sleep disturbances, Hours of sleep study also shows significant association between stress levels and poor sleep quality.
Fundamentally the results of this study ties well with the study by Yamada et al. (2008). The study showed that the bus drivers don’t spend sufficient time with family due to their hectic job which affects their psychosocial behaviour and contributes largely to the stress and lead to consumption of alcohol and tobacco which hamper their sense during driving causing accidents.
Gangwisch et al. ( 2007) studied the effect that sleep duration had on the risk factors for diabetes. There was a noted increase in the risk for diabetes for the subjects who slept < 5 or > 9 hours per night.
Tse et al. (2006) in their research demonstrated that stressors result in physical (cardiovascular disease, musculoskeletal problems, gastrointestinal disorders, fatigue), psychological (anxiety, depression, post-traumatic stress disorder) and behavioural outcomes (substance abuse). Bus driver health problems lead to consequences like employee absence, labour turnover and accidents.
Additionally, researchers at the National Institute of Health have reported that decreased sleeping may lead to a decrease in total lifespan (National Institute of Neurological Disorders and Stroke, 2017). In a study by Labyak et al. (2002) in nurses, it was found that poor sleep quality tends to increase rates of cancer, cardiovascular diseases, digestive diseases and irregular menstrual cycles.
CONCLUSION
The result of the study shows that the bus drivers in the city are stressed irrespective of age. The stress level can be improved with the care of the Government by making the PayScale of bus drivers sufficient and satisfactory and the drivers should be provided appropriate holidays whenever needed. Also, performance appraisal schemes have to be devised and sufficient medical care and assistance should be provided to them. Support should be given by the public by following the traffic rules. It is essential that traffic rules must be introduced at an younger age in school.
In the present study, the PSS score was calculated for positive questions only. More elaborate study can be made considering all the questions for the PSS score.
LIMITATIONS OF THE STUDY:
The sample size is less so, Similar study can be repeated in other intensive care units and by increasing the size of the sample. only the bus drivers from state government (CMBT) and private depot were considered; no female bus drivers could be included due to unavailability during my research.
ETHICAL CLEARANCE
Ethical approval was obtained from the Research Ethics Board, RIMS, Imphal before the beginning of the study.
SOURCE OF FUNDING
The authors received no specific funding for this work.
CONFLICT OF INTEREST
The authors declare that they have no conflicts of interests.
ACKNOWLEDGMENT
We acknowledge great help received from the scholars whose articles are cited and included in the references of this manuscript.
References Assessment of Sleep Quality and Stress Level in Bus Drivers in and around Chennai City – A Cross Sectional Study
- Azagba, S., Sharaf, M.F. (2011). The effect of job stress on smoking and alcohol consumption. Health Econ Rev 1, 15
- Baker C, Driver H (2008) Circadian rhythms, sleep, and the menstrual cycle. sleep medicine. 8(6), 612-623.
- Cohen, S., Kamarck, T., and Mermelstein, R. (1983) A global measure of perceived stress. Journal of Health and Social Behavior. 24, 386-396.
- Duffy C.A., & McGoldrick A.E. (1990) Stress and the bus driver in the UK transport industry. Work & Stress, 4(1), 17-27.
- Florez-Lozano J.Á. (1980) Aspectos psicofisiológicos da fadiga. Revista Brasileira de Saúde Ocupacional, 29, 19-23.
- Gangwisch J.E., Heymsfield S.B., Boden-Albala B., Buijs R.M., Kreier F., Pickering T.G., Rundle A.G., Zammit G.K., Malaspina D. (2007) Sleep duration as a risk factor for diabetes incidence in a large US sample. Sleep. 30, 1667-1673
- Hauri P. (1982) The Sleep Disorders., Kalamazoo, Michigan: The Up John Company.
- Johansson G., Evans G.W., Cederström C., Rydstedt L.W., Fuller-Rowell T., Ong A.D. (2012) The effects of urban bus driving on blood pressure and musculoskeletal problems: A quasiexperimental study. Phychosom Med. 74(1), 89-92.
- Kompier M.A., Di Martino V. (1995) Review of bus drivers' occupational stress and stress prevention. Stress Med. 11(1), 253-262.
- Labyak S., Turek F. (2002) Effects of shiftwork on sleep and menstrual function in nurses. Health Care for Women International, 23, 703-714. National Institute of Neurological Disorders and Stroke. (2017) Brain basics: understanding sleep. NIH Publication No. 17-3440c. Available at http://www.ninds.nig.gov. Accessed August 28, 2019.
- Ragland D.R., Greiner B.A, Yen I.H. & Fisher J.M. (2000) Occupational stress factors: factors and alcohol-related behaviour in urban transit operations. Alcoholism: Clinical and Experimental Research. 24, 1011-1019.
- Sagar R., Mehta M., Chugh G. (2013) Road rage: An exploratory study on aggressive driving experience on Indian roads. Int. J. Soc. Psychiatry. 59, 407-412.
- Stamatakis K.A., Brownson R.C. (2008) Sleep duration and obesity-related risk factors in the rural Midwest. Prev. Med. 46, 439-444.
- Tse J.L., Flin R., Mearns K. (2006) Bus driver well-being review: 50 years of research. Transportation Research Part F. 9(2), 89- 114.
- Yamada Y., Mizuno M., Sugiura M., Tanaka S., Mizuno Y., Yanagiya T., Hirosawa M. (2008) Bus drivers’ mental conditions and their relation to bus passengers; accidents with a focus on the psychological stress concept. J. Human Ergol (Tokyo). 37(1), 1-11.
