Assessment of the effectiveness of public investment in the increase in life expectancy

Author: Kabanov Vadim Nikolaevich
Journal: Economic and Social Changes: Facts, Trends, Forecast @volnc-esc-en
Section: Social development
Article in issue: 5 (41) т.8, 2015.
Free access
The beginning of the 21st century was marked by the emergence of national projects in our country, which exactly correspond to the private integral indicators used by the UN in calculating the index of human capital development since 1996. The national project “Health care” is aimed at increasing life expectancy, “Education” - expanding the population's access to knowledge, “Doubling GDP” - raising people's income. Attaching equal importance to each indicator, the author of the article set a task to consider the economic efficiency of budgetary funds allocated to improve the nation's health. The author assumed a proportion as the main hypotheses about the nature of correlation between life expectancy (H) and expenditures on health care (G); the calculated coefficients of correlation (Pearson, r) of dependence H = f(G) for all RF subjects for 2003-2013 (0.49
Life expectancy, public spending on health care, budget investment, dependence of life expectancy on public expenditure on health care, effectiveness of budget investment in health care
Short address: https://sciup.org/147224144
IDR: 147224144 | UDC: 332.025.12 | DOI: 10.15838/esc/2015.5.41.5
Text of the scientific article Assessment of the effectiveness of public investment in the increase in life expectancy
Relevance. The quantitative value of life expectancy registered by the state statistics agencies of the Russian Federation has a fairly wide field of practical application. This indicator is most famous in its application as an integral index for measuring the human development index (HDI). However, focused professionals (healthcare workers and demographic specialists) knew this indicator long before its inclusion in the formula to calculate the HDI.
The practical application of “life expectancy” values has become especially relevant in connection with the discussion about the need to increase the retirement age in our country. Proponents [1] and opponents [2] of retirement age revision used the quantitative value of life expectancy indicator as the evidence base.
If we put aside the discussion about the retirement age in Russia, the relevance of practical application of life expectancy indicator will not decrease. Its value is proposed to be used as an indicator that reflects the level of development of national economy [3], as well as the depth of social stratification (polarization) [4]. National health accounts 1 consider life expectancy to be an indicator that characterizes the efficiency of public health system.
Wide scope of application of the indicator of life expectancy (LE – H), and its close connection with public healthcare system suggests that the research into the methods for evaluating the effectiveness of investments (G) in healthcare through the increment of the calculated value of LE (H) should be considered as relevant scientific studies that involve current issues of national economic development. The dependence ΔН = f(G), proposed by the author, was compared with the accumulated experience; it relies on the standard measurement system (obtaining baseline information), involves simple mathematical processing of the initial data, and simple assessment of the reliability of the function obtained.
In order to eliminate the debate regarding the definition of the quantitative value of life expectancy (LE, H ), it is reasonable to present the standard definition used by the state statistics bodies of the Russian Federation: “Life expectancy at birth is the average number of years that is likely to be lived by an individual from the given generation, provided that throughout the whole life of this generation the age-specific mortality rates remain at the level of the year, for which the indicator was computed” 2. With regard to the fact that statistical yearbooks present quantitative values interpreted in this way, the present study considers the officially published quantitative values of LE to be accurate and does not take into account possible statistical errors.
It should be noted that from the viewpoint of domestic researchers, the value of LE depends on quite a few factors. If we omit those factors, the influence of which requires at least special knowledge in the field of medicine and healthcare, and focus instead on the issues of socio-economic development, then it will be useful to highlight some of the findings that were published and which attracted the attention of the author of the present paper.
These research findings include a firm opinion concerning the need to increase federal budget expenses on healthcare [5], including those allocated for the national project “Health” [6, 7] and other federal target programs [8] aimed to increase life expectancy. However, the growth of budget expenditures does not find unanimous approval among researchers. As an alternative, it is proposed to take into account the increasing influence of state and non-state health insurance funds [9], and, which is considered particularly important, to make efforts to increase public spending efficiency [10].
The increase in the efficiency of public spending on health in most of the cases is associated with the modernization of fixed assets in the sector [11], which leads to the increase in the amount of high-tech medical services [12] provided to the population. A perceptible increase in life expectancy, although it cannot satisfy the Russians [13], confirms the conclusions of the World Health Organization [14] (WHO) concerning the existence of a close correlation between the level of funding and the value of LE – one of the main indicators of the quality of public healthcare system [15]. It is necessary to consider the fact that the experience of foreign countries, on the one hand, confirms [16] and, on the other hand, refutes [17] the above findings of the WHO. The above-mentioned authors acknowledge the dependence of life expectancy on state financing; nevertheless, they conclude that it is necessary to increase the efficiency of using financial resources in healthcare.
The scientific hypothesis. When studying the statistical indicators that describe the dynamics of change in life expectancy and volume of public resources annually allocated for healthcare, it is important to use a system of quantitative values that is traditionally used in domestic and foreign practice. Such a system of indicators exists in the form of the National Health Accounts recommended by the Organization for Economic Cooperation and Development and the WHO [18]. In order to perform practical calculations, three indicators were considered as the input data: these indicators describe the Russian Federation and its constituent entities for the period from 2003 to 2013. Such indicators are:
– life expectancy 3 ( H );
– consolidated budget expenditures on healthcare 4 ( G );
– population of each of the subjects of the Russian Federation 5 ( N ).
We adopted as the main hypothesis an assumption that the nature of the relationship between LE ( H ) and budget expenditures on healthcare ( G ) is proportion. This approach is somewhat different from the mathematical set of tools used to test the hypotheses of exponential functions [19], but it makes it possible to compare the calculation results with the data obtained in the current [20]
and the precious century [21]. In this regard, at the first stage, the correlation coefficients (Pearson coefficient, r ) were calculated for all the subjects of the Russian Federation for 2003–2013 (0.49 < r < 0.97). An incorrect result was obtained only for the Tyumen Oblast ( r = –0.01), and low values of the Pearson coefficient ( r < 0.5) were obtained for the Chechen Republic ( r = 0.34) and Ingushetia ( r = 0.4).
The results of the study. The value of the correlation coefficient ( r = 0.94) for the Russian Federation as a whole indicates the high reliability ( R2 = 0.881) of application of the linear function ( H = 0.0055 G + 63.629) to describe the dependence of life expectancy ( N ) on the consolidated budget expenditures on healthcare ( G ) (fig. 1) . It is necessary to pay attention to the fact that the calculations involved the actual values of healthcare expenditures of consolidated budgets of Russia’s constituent entities. This approach is often criticized due to the fact that in this case the real cost of financial resources is not taken into account. An attempt to adjust the array of initial values with the help of standard tools that are used to determine the actual value of money, did not change the nature of the distribution in any significant way.
Several researchers [14, 15, 18] note a more precise dependence of LE on budget expenditures per inhabitant ( GN ). Consolidated budget expenditures per inhabitant of the Russian Federation and corresponding subject of the Russian Federation were calculated in order to verify this statement. The replacement of G by GN has not changed the indicators of validity with regard to the linear function
Figure 1. Dependence of LE ( H , years) on the budget expenditures on healthcare ( G , billion rubles)
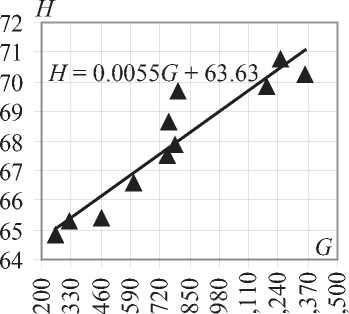
Source: author’s calculations based on: Regiony Rossii. Sotsial’no-ekonomicheskie pokazateli. 2014: stat. sb. [Regions of Russia. Socio-Economic Indicators. 2014: Statistics Collection]. Rosstat. Moscow, 2014. 900 p. R32. (Pp. 54-56. Tab. 2.9; Pp. 744-754. Tab. 22.2–22.3.)
used to describe the dependence. The values of the parameters traditionally used to assess the dynamics of changes in the set of values (growth rates) did not change. This is due to minor changes in the number of population, including that in each RF subject, for 2003– 2013. Therefore, further presentation of the results is given relative to the total budget expenditures on healthcare ( G ).
In the past few years the author [22, 23] successfully applies the value of the slope of the straight to the x-axis for assessing investments effectiveness. Indeed, the value of the tangent can show the extent to which an increase in public expenditure on healthcare (movement along the x-axis to the right) will increase (of reduce) the value of the function (will provide the movement along the y-axis upward, in this case – will lead to the growth of LE). It is obvious that the increase in the value of the tangent will correspond to the increase in the efficiency of budget spending (investment in the quality of life – increase in life expectancy). A graphic image of such assessment is shown in figure 1.
The proposed evaluation of public investment effectiveness (budget expenditures on healthcare) suggests that the increase in life expectancy by one year requires the increase of the annual investment volume by at least 180 billion rubles. It should be noted that the study of the values of life expectancy depending on budget expenditures on healthcare has shown that many RF subjects have a higher level of efficiency than the country as a whole. However, before we substantiate this assertion, it is appropriate to consider the nature of distribution of the values of LE and budget expenditures on healthcare in RF subjects as calculated per inhabitant. In order to avoid placing too many tables in the text of the paper, the author present the results of the study as distributions of respective initial values ( fig. 2a, b ).
Without dwelling on the obvious conclusions derived from a rather simple analysis of distributions of initial values ( H, G ), we present the characteristics that confirm the high level of validity when linear functions are used for describing the dependence H = f(G) when applied to the overwhelming majority of RF subjects. In order to show all the regions of Russia, we present the Pearson coeff icient ( r ) and the mean root square deviation ( R2 ) in the form of histograms ( fig. 3a, b ).
Graphical representation of the values of the correlation coefficient (see fig. 3a) shows that the Pearson coefficient assumes the values less than 0.7 only for four RF subjects. When assessing the adequacy of linear approximation of statistical values, the mean root square deviation takes values sufficient to claim that the accuracy of the calculations is able to meet the requirements for the reliability of mathematical calculations. Thus, it can be argued that the methods of mathematical statistics applied in the present research can be used for scientific substantiation of the conclusions about the effectiveness of state investments in healthcare.
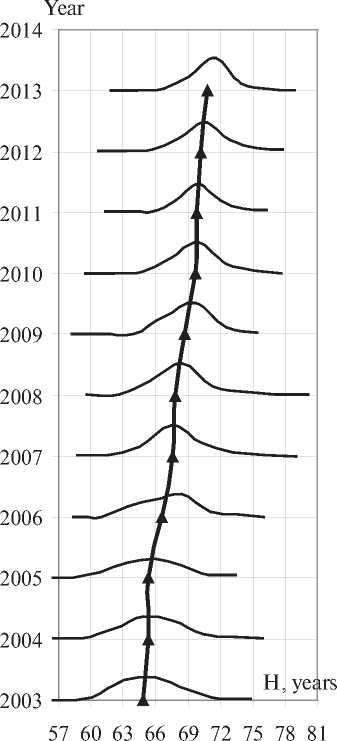
It is important to note that in 2003–2013, the different levels of healthcare financing in RF subjects both in absolute terms ( see fig. 2b ) and calculated per resident provided the positive dynamics of the value of life expectancy. The increment of this indicator in Russia’s regions took place in different ways: in some subjects there was an annual increment of this indicator, in others – variations relative to the values achieved. Without dwelling on the causes of this situation, we present the graphical result of the changes that Russia achieved in 11 years (fig. 4) .
When analyzing the distribution of LE values in RF regions, it is necessary to pay attention to the following changes that the author considers to be positive:
– first, the distance between the minimum and maximum values of LE decreased (see fig. 4);
– second, it is obvious that according to LE indicator, the majority of the regions moved closer to the maximum value on the interval from Hmin to Hmax ;
Figure 2. Distribution of values in the arrays of initial data: a) life expectancy (vertical – LE for Russian Federation); b) RF budgets expenditures on healthcare per inhabitant
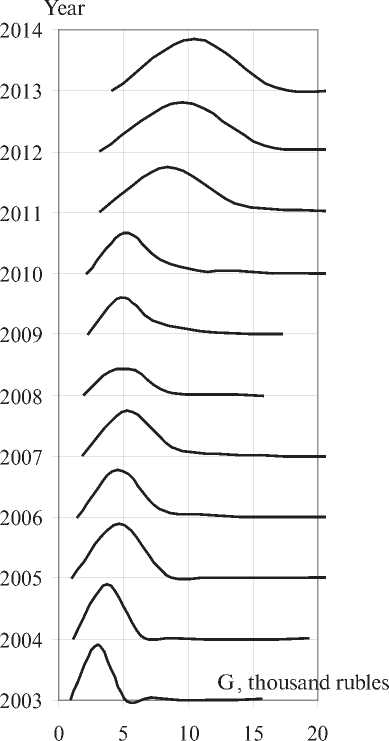
a) b)
Source: Regiony Rossii. Sotsial’no-ekonomicheskie pokazateli. 2014: stat. sb. [Regions of Russia. Socio-Economic Indicators. 2014: Statistics Collection]. Rosstat. Moscow, 2014. 900 p. R32. (a) Pp. 54-56. Tab. 2.9; b) Pp. 744-754. Tab. 22.2–22.3.).
Figure 3. Distribution of values of the indicators for assessing validity: a) correlation
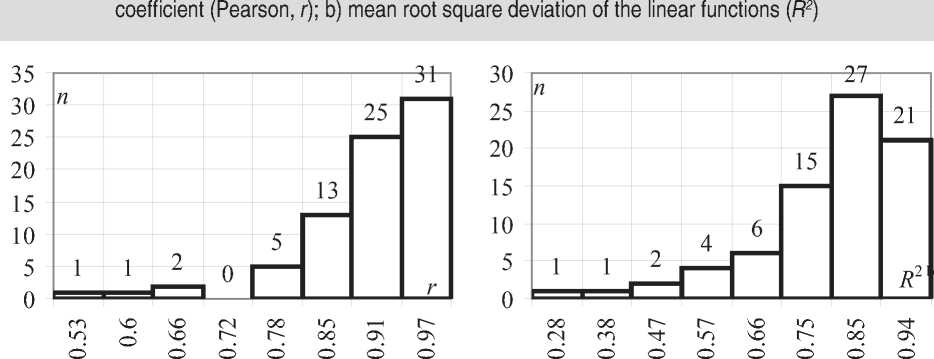
a) b)
Source: author’s calculation based on the standard method of pair correlation analysis.
Figure 4. Distribution of LE ( H ) in the subjects of the Russian Federation in 2003 and 2013
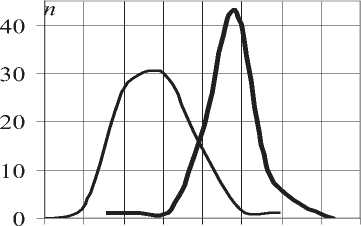
57 60 63 66 69 72 75 78 81
---- 2003----2013 H , years
Source: Regiony Rossii. Sotsial’no-ekonomicheskie pokazateli. 2014: stat. sb. [Regions of Russia. SocioEconomic Indicators. 2014: Statistics Collection]. Rosstat. Moscow, 2014. 900 p. R32. (Pp. 54-56. Tab. 2.9).
– third, there was an increase in the number of RF subjects with relatively equal values of LE (the peak of the graph for 2013 in fig. 4);
– fourth, the movement of distribution of LE values in RF regions can be used to solve problems associated with increasing efficient public investment in healthcare (for example, the provision of such health investments in RF subjects, which will provide the greatest movement of the whole distribution along the x-axis to the right).
From the viewpoint of the author, each RF subject can be regarded as a constituent of the state socio-economic system of the Russian Federation. Each elementary part has its rate of increase in its LE value measured by value of the slope of the straight to the x-axis. A linear function for each RF subject is determined by the mathematical statistics methods described above. The accuracy of such function is very high (see fig. 3a, b). It is necessary and sufficient to determine the slope of each straight that describes the situation in the relevant region of Russia in order to measure the rate of LE increase depending on state investments. Such computations can be performed for at least a three-year period (i.e. at least by three points). The present work presents the values of the slopes (fig. 5), which, according to the author, characterize the efficiency of using public investment in healthcare for 2003–2013.
Obviously, the intrigue that arises when considering the graphical representation of the research findings is to identify regions that are leaders in the effective use of public
Figure 5. Distribution of the slope ( k ) of the linear functions constructed for RF subjects
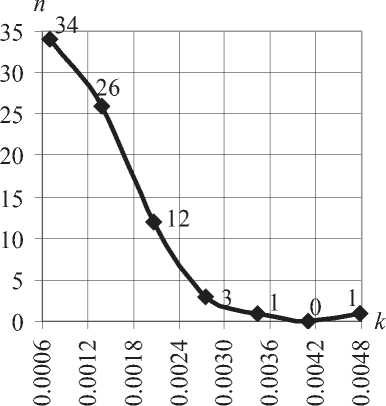
Source: author’s calculations based on the results of the pairwise correlation analysis investment in healthcare (3 + 1 + 1 = 5 RF subjects, see the points in fig. 5 that are most remote from the origin of the axis system along the x-axis). It is highly important to compare the result obtained by the author to the traditional rating assessment of regions on the two most common criteria: life expectancy (H) and the amount of budget funding per inhabitant (GN). To ensure the reliability rating of the assessment in relation to some initial position (in this case, it is the situation in RF subjects in 2003), the absolute and relative criteria of the values (H and GN) are subjected to comparison. Since it is impossible to present the results of the rating assessment in full within the framework of the present paper, only five RF subjects are shown. The number of the subjects is determined by the number of the subjects that are leaders by the author’s criterion of public investment efficiency (the slope of the approximating straight line).
Conclusions. The results of the ranking of the initial data (see tab. 1) suggest that the maximum increase in the calculated value of life expectancy over the past 10 years was observed in the Chita Oblast (tab. 1A). At the same time, the Chita Oblast ranked 48th in Russia in terms of increase in budget financing per capita for 2003–2013 by the absolute index (in rubles); and relative to the base year (2003), it ranked only 76th. Thus, it is necessary to pay attention to very interesting conclusions [24] (see tab. 2), which can be used for this phenomenon.
Probably, it is worth considering the arguments about the growth of budget expenditures on healthcare in RF subjects (see tab. 1b). The leaders of such growth are
Table 1. Ranking estimate of the increase in the initial data (life expectancy and the volume of budget investment per capita) in RF subjects for 2003–2013
|
RF subject |
Absolute growth rate |
Relative growth rate |
||
|
value |
position |
value, % |
position |
|
|
A. Increase in the value of life expectancy in 2003–2013 |
||||
|
Chita Oblast |
10.65 |
1 |
17.85 |
1 |
|
Perm Oblast |
9.54 |
2 |
15.39 |
2 |
|
Kaliningrad Oblast |
9.16 |
3 |
14.93 |
3 |
|
Leningrad Oblast |
8.92 |
4 |
14.52 |
4 |
|
Irkutsk Oblast |
8.67 |
5 |
14.36 |
5 |
|
Republic of Khakassia |
8.02 |
8 |
13.25 |
9 |
|
Altai Republic |
7.30 |
17 |
12.16 |
14 |
|
Saint Petersburg |
7.21 |
18 |
10.76 |
25 |
|
Sakhalin Oblast |
6.41 |
29 |
10.46 |
27 |
|
Moscow |
6.39 |
30 |
9.13 |
33 |
|
Republic of Kalmykia |
5.55 |
40 |
8.43 |
43 |
|
Primorsky Krai |
5.20 |
50 |
8.28 |
46 |
|
Krasnoyarsk Krai |
4.46 |
65 |
7.12 |
61 |
|
Jewish Autonomous Oblast |
4.30 |
68 |
7.09 |
63 |
|
Magadan Oblast |
4.00 |
72 |
6.34 |
69 |
|
Chechen Republic |
3.98 |
73 |
5.75 |
73 |
|
Chukotka Autonomous Okrug |
3.08 |
79 |
5.22 |
77 |
|
B. Increase in budget investment in healthcare per capita in 2003–2013 |
||||
|
Krasnoyarsk Krai |
24.33 |
3 |
9.73 |
2 |
|
Primorsky Krai |
19.37 |
5 |
12.06 |
1 |
|
Moscow |
14.72 |
6 |
5.85 |
4 |
|
Sakhalin Oblast |
21.30 |
4 |
5.56 |
6 |
|
Jewish Autonomous Oblast |
14.63 |
7 |
6.93 |
3 |
|
Magadan Oblast |
30.45 |
2 |
5.29 |
10 |
|
Saint Petersburg |
8.71 |
12 |
5.15 |
12 |
|
Republic of Khakassia |
6.85 |
21 |
4.74 |
19 |
|
Leningrad Oblast |
6.75 |
22 |
4.48 |
21 |
|
Kaliningrad Oblast |
5.93 |
31 |
4.59 |
20 |
|
Chechen Republic |
5.15 |
47 |
5.82 |
5 |
|
Chukotka Autonomous Okrug |
32.59 |
1 |
2.09 |
78 |
|
Altai Republic |
6.69 |
23 |
2.65 |
66 |
|
Irkutsk Oblast |
5.41 |
40 |
2.99 |
60 |
|
Chita Oblast |
5.11 |
48 |
2.24 |
76 |
|
Republic of Kalmykia |
4.63 |
60 |
2.57 |
68 |
|
Perm Oblast |
4.68 |
59 |
2.56 |
69 |
|
Source: compiled by the author on the basis of: Regiony Rossii. Sotsial’no-ekonomicheskie pokazateli. 2014: stat. sb. [Regions of Russia. Socio-Economic Indicators. 2014: Statistics Collection]. Rosstat. Moscow, 2014. 900 p. R32. (Pp. 54-56. Tab. 2.9) |
||||
Table 2. Ranking of RF subjects in terms of growth in life expectancy (H) on a unit volume of public investment in healthcare (G)
|
RF subject |
Value |
Position |
RF subject |
Value |
Position |
|
Altai Republic |
0.004783 |
1 |
Perm Oblast |
0.000895 |
30 |
|
Republic of Kalmykia |
0.002963 |
2 |
Leningrad Oblast |
0.000689 |
44 |
|
Jewish Autonomous Oblast |
0.002256 |
3 |
Sakhalin Oblast |
0.000625 |
46 |
|
Republic of Khakassia |
0.002103 |
5 |
Primorsky Krai |
0.000535 |
48 |
|
Chukotka Autonomous Okrug |
0.001664 |
11 |
Irkutsk Oblast |
0.000503 |
50 |
|
Kaliningrad Oblast |
0.001568 |
12 |
Krasnoyarsk Krai |
0.000189 |
69 |
|
Chita Oblast |
0.001306 |
17 |
Saint Petersburg |
0.000097 |
75 |
|
Magadan Oblast |
0.000899 |
29 |
Moscow |
0.000027 |
77 |
|
Source: author’s calculations based on the results of the pairwise (N = f(G)) correlation analysis (calculation of the slope of the straight to the x-axis using the least squares method). |
|||||
References Assessment of the effectiveness of public investment in the increase in life expectancy
- Kudrin A., Gurvich E. Starenie naselenie i ugroza byudzhetnogo krizisa . Voprosy ekonomiki , 2012, no. 3, pp. 52-79.
- Solov'ev A.K. Demograficheskie usloviya povysheniya pensionnogo vozrasta v Rossii . Narodonaselenie , 2015, no. 2, pp. 39-51.
- Aganbegyan A.G. Sostoyanie ekonomiki formiruet zdorov'e natsii . Ekonomika i upravlenie , 2011, no. 10, pp. 3-8.
- Rimashevskaya N.M. Kachestvo chelovecheskogo potentsiala v usloviyakh innovatsionnoi ekonomiki . Narodonaselenie , 2009, no. 3, pp. 16-30.
- Levin I.A., Petrashenko D.A., Ponomareva Yu.N. Regional'nyi indeks zdorov'ya naseleniya kak faktor planirovaniya sistemy meditsinskogo obsluzhivaniya . Servis v Rossii i za rubezhom , 2014, no. 4, pp. 189-198.
- Samoilova A.V. Mediko-demograficheskaya situatsiya v Chuvashskoi Respublike za 2010-2013 gg. . Zdravookhranenie Chuvashii , 2014, no. 2, pp. 5-14.
- Bykovskaya T.Yu. Rol' natsional'nogo proekta “Zdorov'e” v uluchshenii pokazatelei zdorov'ya rabotayushchego naseleniya . Meditsina truda i promyshlennaya ekologiya , 2011, no. 3, pp. 19-33.
- Stepchuk M.A., Pinkus T.M., Abramova S.V., Bozhenko D.P. Dal'neishee razvitie otrasli zdravookhraneniya . Nauchnye vedomosti Belgorodskogo gosudarstvennogo universiteta , 2012, no. 22, pp. 89-93.
- Arbitailo I.Ya. Sotsial'nye posledstviya reformy zdravookhraneniya . Sovremennye problemy nauki i obrazovaniya , 2014, no. 6, p. 1603.
- Danishevskii K.D. Kakie prioritety v oblasti zdorov'ya naseleniya trudosposobnogo vozrasta naibolee vazhny dlya Rossii . Meditsina , 2013, no. 3, pp. 33-45.
- Popova L.A. Otsenka effektivnosti gosudarstvennykh demograficheskikh initsiativ . Ekonomicheskie i sotsial'nye peremeny: fakty, tendentsii, prognoz , 2014, no. 1, pp. 125-137.
- Shkol'nikov V.M., Andreev E.M., McKee M., Leon D.A. Rost prodolzhitel'nosti zhizni v Rossii 2000-kh godov . Demograficheskoe obozrenie , 2014, no. 2, pp. 5-37.
- Lepikhina T.L., Karpovich Yu.V. Prioritetnye napravleniya investirovaniya v chelovecheskii kapital v sovremennoi Rossii . Vestnik Permskogo natsional'nogo issledovatel'skogo politekhnicheskogo universiteta , 2010, no. 6, pp. 21-34.
- Lastochkina M.A. Analiz mediko-demograficheskikh pokazatelei kak indikatora sotsial'no-ekonomicheskogo razvitiya territorii . Problemy razvitiya territorii , 2013, no. 5, pp. 57-62.
- Il'inskaya E.V. Effektivnost' raskhodov na zdravookhranenie v Rossii i stranakh mira . Regional'nye agrosistemy: ekonomika i sotsiologiya , 2012, no. 1, p. 18.
- Reva I.V., Poleshchuk T.A., Gul'kov A.N., Gainulina Yu.I., Usov V.V., Son E.A., Kim A.R., Reva G.V. Ekonomicheskaya i sotsial'naya effektivnost' organizatsii lechebnoi pomoshchi v Yaponii . Uspekhi sovremennogo estestvoznaniya , 2015, no. 1-3, pp. 373-381.
- Miller M.A. Material'noe blagopoluchie i zdorov'e v zhiznedeyatel'nosti naseleniya . Izvestiya Irkutskoi gosudarstvennoi ekonomicheskoi akademii , 2009, no. 3, pp. 125-128.
- Obukhova O.V. Mezhdunarodnye statisticheskie instrumenty v otsenke effektivnosti otechestvennoi sistemy zdravookhraneniya . Sotsial'nye aspekty zdorov'ya naseleniya , 2012, no. 2, pp. 3.
- Molchanova E.V., Kruchek M.M. Matematicheskie metody otsenki faktorov, vliyayushchikh na sostoyanie zdorov'ya naseleniya v regionakh Rossii (panel'nyi analiz) . Sotsial'nye aspekty zdorov'ya naseleniya , 2013, no. 5, p. 10.
- Lavrent'eva E.V., Komarov O.K., Cherkasov V.E. Byudzhetnaya politika munitsipal'nykh obrazovanii kak faktor razvitiya chelovecheskogo kapitala . Biznes. Obrazovanie. Pravo. Vestnik Volgogradskogo instituta biznesa , 2014, no. 4, pp. 53-57.
- Ovcharov V.K., Tarasova G.V., Korol'kova T.A., Tokurov M.V. Faktornyi analiz i modelirovanie dlya prognozirovaniya osnovnykh pokazatelei zdorov'ya naseleniya Rossii . Otchet o NIR/NIOKR, RFFI № 97-06-80041-a, 1997-1998 gg .
- Kabanov V.N. Otsenka effektivnosti mestnogo samoupravleniya. Upravlenie razvitiem krupnomasshtabnykh sistem (MLSD'2012): materialy Shestoi mezhdunarodnoi konferentsii (1-3 oktyabrya 2012 g., Moskva, Rossiya) . Moscow: IPU RAN, 2012, pp. 168-171.
- Kabanov V.N. Pokazatel' kachestva zhizni naseleniya dlya otsenki effektivnosti mestnogo samoupravleniya. Strategicheskoe planirovanie i razvitie predpriyatii: materialy XIY vserossiiskogo simpoziuma. Moskva, 9-10 aprelya 2013 g. . Moscow: TsEMI RAN, 201, pp. 84-87.
- Shvets Yu.Yu. Sootnoshenie kolichestvennykh pokazatelei s kachestvom okazyvaemoi meditsinskoi pomoshchi. XXII Vserossiiskoe soveshchanie po problemam upravleniya VSPU-2014, Moskva, 16-19 iyulya 2014 goda . Moscow: IPU RAN, pp. 6161-6169.
- Regiony Rossii. Sotsial'no-ekonomicheskie pokazateli. 2014: stat. sb. . Rosstat. Moscow, 2014. 900 p. R32. (Pp. 54-55. Tab. 2.9.)
- Regiony Rossii. Sotsial'no-ekonomicheskie pokazateli. 2014: stat. sb. . Rosstat. Moscow, 2014. 900 p. R32. (Pp. 744-753. Tab. 22.2-22.3.)
- Regiony Rossii. Sotsial'no-ekonomicheskie pokazateli. 2014: stat. sb. . Rosstat. Moscow, 2014. 900 p. R32. (Pp. 37-38. Tab. 2.1.)
- Regiony Rossii. Sotsial'no-ekonomicheskie pokazateli. 2014: stat. sb. . Rosstat. Moscow, 2014. 900 p. R32. (a) Pp. 54-56. Tab. 2.9; b) Pp. 744-754. Tab. 22.2-22.3.)
- Regiony Rossii. Sotsial'no-ekonomicheskie pokazateli. 2014: stat. sb. . Rosstat. Moscow, 2014. 900 p. R32. (Pp. 54-56. Tab. 2.9)
