Assessment of the impact of the social reproduction process on economic development of the region (case study of the Sverdlovsk oblast)
")
Author: Tatarkin Denis Aleksandrovich, Sidorova Elena Nikolaevna
Journal: Economic and Social Changes: Facts, Trends, Forecast @volnc-esc-en
Section: Social development
Article in issue: 4 (34) т.7, 2014.
Free access
When a human person is perceived not only as a key factor in social development, but also as its objective, there appears the understanding that the qualitative shifts in the reproductive process, most valuable for the society, occur not in the material sphere, but in the sphere associated with the development of a person and satisfaction of his/her needs. This fundamental postulate helps to prioritize the goals of economic development. Economic growth without social reproduction defeats the purpose of economic development, as economic growth, which does not enhance the level and quality of life, contradicts its primary purpose. Financing of social reproduction of the population is not forced diversion of financial resources from the production process, but social investment that improves the quality of life and attracts skilled workforce to the region. The rise in salary of the economically active population has a positive effect on the formation of a profitable part of the budget, which is a prerequisite for its economic and social development on a more innovative base...
Social reproduction, social impact, multiplier economic effect, system of national accounts, revenue, social budget expenditure, gross regional product
Short address: https://sciup.org/147223611
IDR: 147223611 | UDC: 332.14:336.13 | DOI: 10.15838/esc/2014.4.34.9
Text of the scientific article Assessment of the impact of the social reproduction process on economic development of the region (case study of the Sverdlovsk oblast)
The upgrade of the Russian economy and its integration into the world economy have determined the need to revise the approach to the selection of new factors of progressive development. Building an effective model of economic development should be based on the global trends to form sustainable socially-oriented self-developing territorial systems which provide conditions for social stability and economic welfare of the population.
Nowadays society begins to consider that the main wealth of any country is its human potential. It recognizes that the most important valuable qualitative shifts in the reproductive process of leading world economies do not occur in the material sphere but in the sphere associated with the development of human and his/her needs. This statement is reflected in the concept “social orientation of the economy in the region” and development of the mechanism of financial support for human potential development.
However, due to the complexity of the issues, there are unsolved questions, such as interaction between financial development and efficiency of the social reproduction process. The costs on social deve-lopment of the territories are often viewed as a forced diversion of financial resources from the production sphere. It is not surprising that in the conditions of economic instabi- lity and growing budget deficit in many developed countries, the evaluation of the effectiveness of social budget expenditures is very important.
The financial support of the social reproduction system is a set of financial flows of the territory associated with the formation of the population income, consumption of social services by the population, financing of recurrent and investment expenditures in the social sphere of budgetary and extrabudgetary sources ( fig. 1 ).
EXTERNAL FACTORS

Figure 1. Factors promoting financial provision of social reproduction of territories
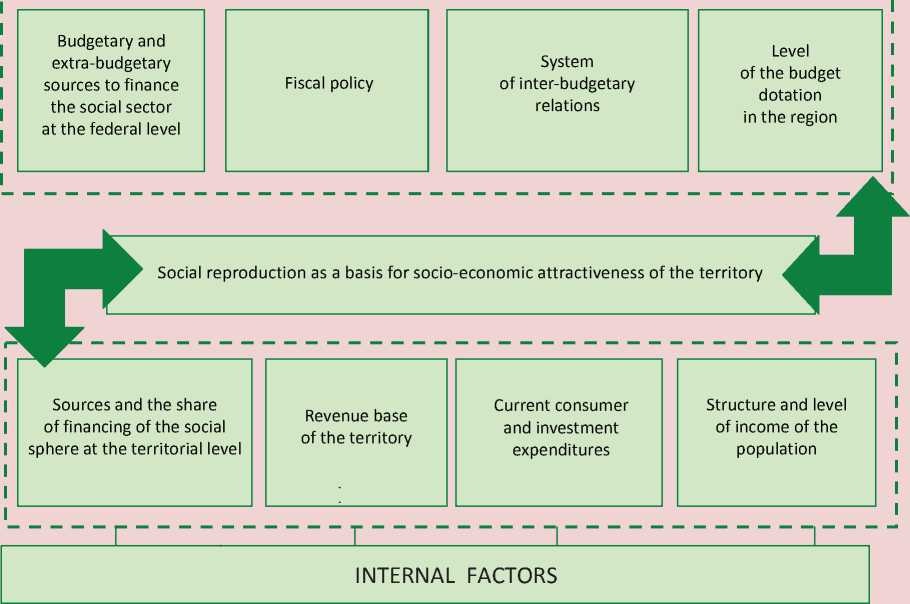
Improved life quality and positive processes in the social sphere attract highly skilled workforce to the region. The inflow of economically active population and the increase in wages have a positive effect on the formation of a profitable part of the budget, which is a necessary condition for economic development on a more modern and innovative basis.
The integral elements of the social reproduction process are consumption of social goods and services and financial assurance of the social sector, including education, health, culture, environment and public utilities.
The important characteristic of the social reproduction process is the level of consumptive use of goods and services by the population, including social, and the level of gross fixed capital.
The structure of these indicators distribution reveals the development strategy, implemented in the country:
-
1) either human-oriented, boosting domestic consumption of goods and services;
-
2) or oriented to production development, investment growth at the expense of high savings rates. Moreover, the fundamental point is a ratio of the roles of state and private business in the social services provision.
Currently, the Russian social sphere is being mainly developed on the state basis. Howe-ver, the business sector begins to play an increasingly prominent role in social policy. The two-tier system of production and distribution of social services is being formed. The state guarantees minimum social standards according to a certain situation.
They are the following: minimum wages, minimum pensions, regulations of budget spent on health, nutritional standards, norms and requirements of preferential provision with medicines, standards of the total floor area of the accommodation, etc. The private institutions offer additional services on a fee basis.
Despite positive changes in the financing of the social sphere, today Russia lags behind Western countries and, as a consequence, has a non-competitive level of social reproduction of the population.
The estimate of social development of the Russian Federation, in comparison with developed countries, has revealed its significant gap. Russia ranks last by the level of consumption of social services, even lagging behind former Soviet republics.
At the same time, the state costs on social services provision are quite high – 17% of GDP.
Russia ranks second last by the development of the sphere of paid social services – 3.3% of GDP, only ahead of the Republic of Belarus (2.7% of GDP). By this indicator we lag behind Western countries by 2–3 times or more: Japan – 6.9% of GDP, Germany – 7.4%, Canada – 7.6%, USA – 20.7% [6, p. 128; 7, p. 256; 9; 10].
To assess the situation we consider an indicator such as a share of social expenses in the total budget expenditures. In Russia it amounts to 60%. The significant part of the budget funds to finance social expenditures is allocated by the EU. In 25 countries the share of social expenses in the total budget expenditures has recently amounted to more than 70%.
Taking into account the extremely low level of GDP per capita, the lowest social indicators in GDP and their poor dynamics, it is possible to draw a conclusion about the lack of the clearly defined socially-oriented economic policy in this country. Increased opportunities in social reproduction of the population and rapprochement with developed countries require a significant increase in the pace of social development.
One of the factors contributing to the lag in social development of the country is the inability to assess financial implications of increased amounts of the social sector. It is caused by the complexity to measure socioeconomic efficiency of current spending and investment in the industry with regard to the conjugated effects in all sectors of production and social sphere. The complexity and diversity of this category perception predetermine the lack of consensus on the nature and efficiency measures.
The functioning of social sphere has a double effect: on the one hand, it is connected with the fulfillment of social functions; on the other hand, it is a factor of economic growth. The social effect is to meet the needs of society in the most important social services – education, health, culture, etc. The economic effect is manifested in increased gross domestic product and in the change of crucial economic indicators. The social sphere as a basis for social reproduction of human potential provides reproduction of qualified labor force, health maintenance of the population, increase in the intellectual potential of the society, thereby having a qualitative impact on socio-economic development of the society.
What is more, the social sphere is embedded in the economic system of the country where people work, wages are paid, profit is made, investments are carried out and taxes are levied. Its development, like the development of any other manufacturing industry, affects the economy of the country and regions directly.
The methodology of the system of national accounts (SNA) helps to carry out a comprehensive assessment of the influence of social budget expenditures on the economy of the territory. The use of the SNA tools provides an opportunity to consider the financial maintenance of social processes from different perspectives: on the basis of incomes dynamics and patterns of goods and services consumption, including social; from the perspective of the influence of social processes on the regional economic development; with respect to the efficiency of socially oriented budget expenditures.
Budget costs have two main forms of the impact on regional economy and create a multiplier effect in the formation of GRP:
-
1) they participate in the generation of the population’s income (of the public sector employees) through the payment of wages and social benefits, which are then consumed by households for final consumption and savings;
-
2) budget financing provides the demand for work and services in some sectors of the economy. By undertaking the maintenance and development of the property complex, authorities increase demand and, therefore, launch a number of industries, primarily housing and utilities, construction and some others.
The authors have calculated the effect of social expenditures on GRP of the Sverdlovsk Oblast on the basis of the 2011 data. The budget expenditures include the financing of budgetary institutions of the social sphere from federal, regional and local budgets.
In Stage I of the study , we, using the functional classification of budget expenditures, single out the articles aimed to fulfil social functions of the state.
They include education, culture, health, social policy and sport. Then the relevant articles of the functional classification of expenditures are further divided according to the classification of the operations in the public sector.
In the Sverdlovsk Oblast in 2011 the expenditures of budgets of all levels region totaled 257.4 billion rubles, including 67.5 billion allocated from the federal budget. It should be noted that in this research the federal budget expenditures include the costs for maintenance and operations of institutions under the jurisdiction of the federal government that operate in the region. The expenditures on social services equaled 141.2 billion rubles or 54.8%. The large part of this amount was allocated to education (61.6 billion – 43% of the total expenditure on social services), health (35.8 billion rubles – 25.3%) and social policy (33.4 billion – 23.6%). The expenses on culture and cinema, physical education and sport amounted to 5.9 (4.1%) and 4.5 (3.1%) billion rubles, respectively [3; 4].
Then we divide budget expenditures in accordance with the classification of the government operations.
The most significant items of expenditure are the following: salaries and charge on payroll amounted to 110.7 billion rubles (43% of the total budget); the increase in the fixed assets value – 29.5 billion rubles (12%); social assistance allowance – 24.3 billion rubles (9%); the maintenance of property – 19 billion rubles (7%).
However, the closer study of individual budget expenses reveals a significant change in the structure. For example, the prevailing costs on wages remained in education (63.2%), culture (53.2%) and health (44.9%), while the share of costs in social policy, physical culture and sport was 12.4 and 12.2%, respectively. Major funds in social policy were allocated to social service benefits (67.8%), in physical culture and sport – to the increase in the value of fixed assets (49%) [3; 4].
The analysis shows that the structure of budget expenditures in accordance with the government operations varies greatly depending on the sphere where these funds are allocated. Consequently, it can be assumed that the changes in the funding of different items of social spending will have different impacts on the region’s GRP. To determine the impact of budget expenditures on regional economy it is necessary to clarify the distribution of resources. Stage II of the study presupposes the grouping of budget expenditures.
The first group comprises the expenses that are allocated to the enterprises serving the public sector in the form of yield (growth in the number of related industries); therefore, they are a source of added value.
The second group includes costs, which directly increase disposable income of the population. In addition, there is a group of costs, which impact on the regional economy is impossible to estimate, since the actual final distribution of these costs cannot be determined with a sufficient degree of probability. So, the first group accounts for 21.8% of all budget expenditures on social services, the second group – 61.5% and the third – 16.7%. Each of these groups has a different impact on the economy of the region.
The first group includes the following articles of budget expenditures: communication; transportation; utility services; rent for the property use; payment for works, services for the property maintenance; other works and services; the rise in the value of fixed assets.
In order to determine the impact of budget expenditures on a particular industry we can compare the items of budget expenses with the economic activities. For example, the budget expenditures for transport and communications form a certain share of economic activity “transport and communications”. The utility costs form the share of economic activity “production and distribution of gas and water”, etc. So, we get the following distribution of budget expenditures by economic activities:
-
• transport and communication – 563.4 million rubles;
-
• production and distribution of electricity, gas and water – 6129 million rubles;
-
• operations with real estate, rent and services – 12052 million rubles;
-
• construction – 8414 million rubles.
Besides, we should pay attention to the allocation of the increased fixed assets to the construction sector. Obviously, this cost item also includes a number of other areas of investment – machinery and equipment, vehicles, etc. So, the study assumes that only 70% of the costs to increase the value of fixed assets have been allocated to the construction and repair of buildings.
Allocating funds in certain sectors of the economy, the authorities form part of the gross output of the industry. According to the SNA, gross output consists of two components: added value and intermediate consumption. Added value, in turn, consists of wages, profit and other taxes on production. The further analysis is conducted on the basis of existing proportions in the regional economy (tab.) .
For example, in the sector of production and distribution of electricity, gas and water there is the following ratio: the share of added value in gross production was 31.7%. In this industry added value consisted of 43% of wages, up 53.6% of enterprises’ profit and 3.4% of other taxes on production.
The calculations based on the table data indicate the following amounts of gross added value in the related sectors at the expense of budget expenditures:
– transport and communication – 336.8 million rubles;
– production and distribution of electricity, gas and water – 1943.2 million rubles;
– operations with real estate, rent and services – 7583.3 million rubles;
– construction – 4004 million rubles.
Structure of gross added value in the Sverdlovsk Oblast in 2011*
|
Economic activity |
Gross output, million rubles |
Gross added value, million rubles |
The share of gross |
Structure of gross added value in % |
||
|
added value in the total production, % |
Remuneration |
Other taxes on production |
Gross income |
|||
|
Agriculture, hunting and forestry |
69308 |
39643 |
57.2 |
27.2 |
0.5 |
72.3 |
|
Fishing, fish farming |
68 |
43 |
63.2 |
26.9 |
1 |
72.1 |
|
Mining |
98901 |
51894 |
52.5 |
27.6 |
3.8 |
68.6 |
|
Manufacturing |
1137397 |
359934 |
31.6 |
44 |
2.5 |
53.5 |
|
Production and distribution of electricity, gas and water |
190508 |
60402 |
31.7 |
43 |
3.4 |
53.6 |
|
Construction |
162936 |
77535 |
47.6 |
48.3 |
0.5 |
51.1 |
|
Wholesale and retail trade; repair of motor vehicles, motorcycles, household goods and personal items |
381261 |
246177 |
64.6 |
29.1 |
1.7 |
69.3 |
|
Hotels and restaurants |
36346 |
15922 |
43.8 |
33.9 |
1.1 |
65 |
|
Transport and communications |
245019 |
146482 |
59.8 |
27.5 |
2.6 |
69.9 |
|
Financial activities |
11133 |
7093 |
63.7 |
40.8 |
0.1 |
59.1 |
|
Operations with real estate, rent and services |
165318 |
104069 |
63.0 |
39.6 |
1.1 |
59.3 |
|
Public administration and military security, compulsory social security |
77993 |
52464 |
67.3 |
97.7 |
0.2 |
2.1 |
|
Education |
52331 |
39370 |
75.2 |
91.8 |
0.7 |
7.5 |
|
Health and social services |
81317 |
52838 |
65.0 |
92 |
0.3 |
7.8 |
|
Other community, social and personal services |
19806 |
11815 |
59.7 |
77.8 |
0.6 |
21.6 |
|
* Calculated by: Natsional’nye scheta Rossii v 2004–2011 godakh: stat. sb. [National Accounts of Russia in 2004–2011: Statistics Digest]. Rosstat, Moscow, 2011. Pp. 251-259. |
||||||
Thus, the total increase in gross value added (GVA) in the related industries due to the social sphere financing from the budgets of all levels was 13867.3 million rubles.
On the basis of the table data we calculate the amount of remuneration, gross profit and other taxes on production, formed due to demand from the state budget. In the result, the amount of remuneration, formed at the expense of budget expenditures in all four sectors accounted to 5866 million; gross profit – to 7822 million rubles; other taxes on production – 178 million rubles. On the basis of total amount of remuneration we calculate the amount of real income formed at the expense of budget expenditures financing.
According to the SNA, the indicator “wages” includes taxes on profit and other payments to employees, even if they are actually withheld by employers in admi- nistrative interests or by other reasons and paid directly to the state social non-budgetary funds, tax services on behalf of the employee. Thus, employees’ remuneration consists of two components: (a) wages; (b) employers’ contributions to the state social non-budgetary funds.
Therefore, to calculate the amount of funds which employees get in fact, it is necessary to single out the amount of compulsory social contributions and individual income taxes. The calculations show that the amount of employees’ real incomes has amounted to 3809 million rubles.
Then, households will save the part of the given sum and spend another part on consumer needs. It will result in the effective demand for food and non-food goods and services. In other words, in the SNA terms the payment of wages provides the launch of enterprises and organizations that sell goods and services to the population in the region.
These industries will form added value, i.e. will create a multiplier effect. The available statistics take it into account partly. It should be noted that the yield of the enterprises serving the public sector will also create a multiplier effect, as part of this amount after profit or dividends distribution will be at the disposal of the owners of the enterprise. Another part can be directed to investment. Unfortunately, this statistics does not take into account this effect.
Stage III of the study is to calculate the impact of the second group of budget items on the regional economy (remuneration, social service benefits, etc.). As it has been noted above, the primary effect of these industries is associated with the population’s incomes, which are further used for consumption and accrual. After necessary calculations, we get the following value of real income received by households as a result of implementation of the budget expenses – 68571 million rubles (taking into account monetary income of employees of the enterprises serving the public sector).
As the households spend only part of disposable income on consumptive use and save another part, it is necessary to calculate the marginal propensity to consume (MPC) in the Sverdlovsk Oblast in 2011. For this we compare consumer spending and income of the population. The initial data are taken from the sample survey of household budgets, quarterly conducted by the statistical agencies in all regions of the Russian Federation. In particular, in the Sverdlovsk Oblast such survey considered about 1000 households with a different income level, place of residence, etc. [1, p. 126; 8].
The calculations show that the MPC in the Sverdlovsk Oblast in 2011 amounted to 0.706, i.e. on average the households spent 70.6% of disposable income on consumption. Thus, the amount of real income, aimed at consumer spending, amounted to 48411 million rubles.
Then, it is required to consider the structure of household consumption. On the basis of the same data we single out major items of household expenditure (fig. 2) . As you can see in the chart, almost all consumer expenditures are part of three groups: the purchase of food-products, the purchase of non-food products and the payment for services. They together accounted for 94% of
Figure 2. Structure of consumer expenditures of the population in the Sverdlovsk Oblast in 2011
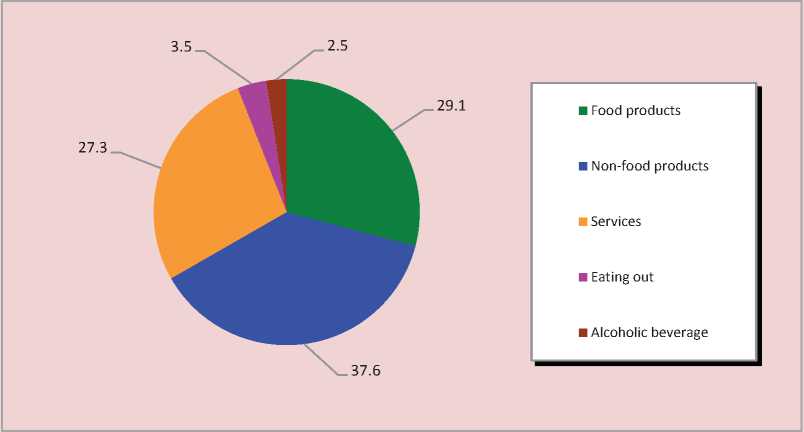
Source: Struktura ispol’zovaniya denezhnykh dokhodov naseleniya v Sverdlovskoi oblasti: analiticheskii material Rosstata po Sverdlovskoi oblasti [Structure of the Use of the Population Income in the Sverdlovsk Oblast: Analytical Material of Russian Statistics of the Sverdlovsk Oblast]. Available at: 0&referrerId=1292867
all expenses. Expenditures on eating out and purchase of alcoholic beverages comprised the remaining 6%.
With the available data on the marginal propensity to consume and the structure of consumer expenses in the Sverdlovsk Oblast being taken into account, the purchase of food products required 14087 million rubles, the purchase of non-food goods – 18202.5 million rubles; the payment for services – 13216.2 million rubles; eating out – 1694.3 million rubles and the purchase of alcoholic beverages – 1210.2 million rubles.
Each of these groups is optionally divided into more specific elements. For example, the payment for services includes the following articles: utility services – 8.3% (of total consumer expenditures), household services – 3.4%, culture – 4.5%, education – 1.1%, medicine – 2.3%, health resort treatment – 0.5%, passenger transportation – 2.4%, communication – 3.2 % and other services – 1.4% [8].
The purchase of food, non-food products and alcoholic beverages is made through a network of shops; therefore, the costs of households on these goods are treated as revenue of the industry of wholesale and retail trade. Expenditures on eating out are considered as production of the sector “hotels and restaurants”, etc. Having compared the data of the table and figure 2 on the structure of household consumption, we calculate gross value added, formed at the expense of households’ income, obtained in the course of the budgetary financing of social expenditures. It amounted to 15675 million rubles, with 6311 million rubles being remuneration, 9112 million rubles – gross profit of enterprises and 259 million rubles – other taxes on production. On the basis of the obtained values of remuneration, we can again calculate the re-growth of real incomes – 4098 billion rubles
Stage IV (final) includes the calculation of the total multiplier effect of public financing of social sectors. For this purpose it is necessary to sum added value in the related sectors, calculated during Stage II of the study, and added value, and received at Stage III. The total sum amounted to 29542 billion rubles.
To get a clearer idea of the size of the multiplier effect, it is necessary to compare it with the total amount of funds allocated to finance the social sphere from budgets of all levels. To do this, one should calculate the amount of gross regional product produced at the expense of budget costs.
As you know, GRP can be calculated by three methods: production, a method of revenues use and a method of GDP formation by the sources of income. For research purposes, the calculation is based on the assessment of the direct effect of financing social budget expenditures, equal to the remuneration costs of employees of state and municipal institutions. This approach approximates to the GRP calculation based on the method of generating income sources. In this case, GRP as part of the budgetary expenditure includes the remuneration of employees (residents and nonresidents), gross profit in all industries or institutional sectors and net taxes on production and import. As a result, the direct effect of budgetary financing of social expenditures is estimated at 62831 million rubles of added value.
Thus, having added the direct and indirect effect, we have found out that in the Sverdlovsk Oblast in 2011 added value amounted to 92373 million rubles at the expense of the budgetary expenditure on social services. Correlation of the total effect and the total budget expenditures on social services at the rate of 141258.4 million rubles revealed the value of the multiplier equal to 0.65 . So, one ruble of social budget expenditures from all sources (federal, regional and municipal) creates 65 kopecks of GRP in the Sverdlovsk Oblast. Thus, the study clearly shows that the budget expenditures on social services had not only a social, but also significant economic impact on the region’s development.
It should be noted that the proposed approach does not fully reflect the impact of budget expenditure on the GRP formation in the region. The main reason for this is a lack of statistical information and research in the field of the structure of costs on production and services, profit distribution and consumer preferences of different population groups. However, it can be assumed that in case of further development of this approach the total value of the multiplier will be even higher.
Cited works
-
1. Revenues, Expenditures and Consumption of Households in 2012: Statistics Digest. Rosstat, Moscow, 2013.
-
2. National Accounts of Russia in 2004–2011: Statistics Digest . Rosstat, Moscow, 2011. 344 p.
-
3. Report on Cash Receipt and Replacement of Budgetary Funds as of January 1, 2012 . Available at: http://sverdlovsk . roskazna.ru/file/fs/39066.0503124.ARJ
-
4. Report on the Execution of the Consolidated Budget of the Russian Federation Subject and the Territorial ExtraBudgetary Fund as of January 1, 2012 . Available at: http://www.roskazna.ru/byudzhetov-subektov-rf-i-mestnykh-byudzhetov/doc/reports_file807.zip
-
5. The 2011 Russian Statistical Yearbook: Statistic Digest . Moscow, 2011. 795 p.
-
6. Russia and the World Countries in 2011: Statistic Digest. Rosstat, Moscow, 2012. 372 p.
-
7. Sidorova E. N., Tatarkin D. A. Financial Potential of the Regions and their Socio-Economic Attractiveness . Ekaterinburg: Institut ekonomiki UrO RAN, 2013. 385 p.
-
8. Structure of the Use of the Population Income in the Sverdlovsk Oblast: Analytical Material of Russian Statistics of the Sverdlovsk Oblast . Available at: erId=1292867
-
9. Society at a Glance 2011. OECD Social Indicators: Analytical Material of OECD . Available at: http://www.oecd . org/els/soc/societyataglance2011.htm
-
10. Society at a Glance 2014. OECD Social Indicators. The Crisis and Its Aftermath Analytical Material of OECD. Available at: ccname=guest&checksum=7357A8CE8F69299C776EEE5D1AF10B2C
References Assessment of the impact of the social reproduction process on economic development of the region (case study of the Sverdlovsk oblast)
- Dokhody, raskhody i potreblenie domashnikh khozyaistv v 2012 godu: stat. sb. . Rosstat, Moscow, 2013.
- Natsional’nye scheta Rossii v 2004-2011 godakh: stat. sb. . Rosstat, Moscow, 2011. 344 p.
- Otchet o kassovom postuplenii i vybytii byudzhetnykh sredstv na 1.01.2012 g. . Available at: http://sverdlovsk.roskazna.ru/file/fs/39066.0503124.ARJ
- Otchet ob ispolnenii konsolidirovannogo byudzheta sub”ekta Rossiiskoi Federatsii i Territorial’nogo vnebyudzhetnogo fonda na 1.01.2012 g. . Available at: http://www.roskazna.ru/byudzhetov-subektov-rf-i-mestnykh-byudzhetov/doc/reports_file807.zip
- Rossiiskii statisticheskii ezhegodnik. 2011: stat. sb. . Moscow, 2011. 795 p.
- Rossiya i strany mira. 2011: stat. sb. . Rosstat, Moscow, 2012. 372 p.
- Sidorova E. N., Tatarkin D. A. Finansovyi potentsial regionov i ikh sotsial’no-ekonomicheskaya privlekatel’nost’ . Ekaterinburg: Institut ekonomiki UrO RAN, 2013. 385 p.
- Struktura ispol’zovaniya denezhnykh dokhodov naseleniya v Sverdlovskoi oblasti: analiticheskii material Rosstata po Sverdlovskoi oblasti . Available at: http://www.fedstat.ru/indicator/data.do?id=31502&referrerType=0&referrerId=1292867
- Society at a Glance 2011. OECD Social Indicators: Analytical Material of OECD. Available at: http://www.oecd.org/els/soc/societyataglance2011.htm
- Society at a Glance 2014. OECD Social Indicators. The Crisis and Its Aftermath Analytical Material of OECD. Available at: http://www.oecd-ilibrary.org/docserver/download/8113171e.pdf?expires=1403171952&id=id&accname=guest&checksum=7357A8CE8F69299C776EEE5D1AF10B2C
