Assessment of the Influence of Growth Factors on the Gross Regional Product on the Example of Arkhangelsk Oblast

Author: Kuznetsova M.N., Vasilyeva A.S.
Journal: Arctic and North @arctic-and-north
Section: Social and economic development
Article in issue: 46, 2022.
Free access
The problem of differentiating indicators of economic development is relevant not only for the regions of Russia. One of the main indicators is the gross regional product. The work carried out a comparative analysis of its values for the constituent entities of the Russian Federation, the United States and China, which revealed differences by tens, and sometimes hundreds of times. In most cases, this is due to the specifics of a particular region. The aim of the work is to assess the influence of regional factors on the gross regional product. The article presents an analysis of existing methods for solving this problem by modern domestic and foreign researchers. A brief overview of the key factors used in the proposed models is given. However, the trends in the development of the world and domestic economies, political events, restrictions imposed by the pandemic, regional peculiarities leave this issue relevant. The paper proposes a model for assessing the impact of objective and subjective factors on the gross regional product. The testing subject was the Arkhangelsk Oblast, located in the north of the European part of the Russian Federation. Seven indicators were selected as objective factors, which have a close correlation with the resulting indicator. A multiple regression equation was developed and the quality of the model was assessed. A forecast of the values of the gross regional product for the planning period was made. The influence of subjective factors was studied using the method of expert assessments through the analysis of ratings of influential agencies. A correction factor has been introduced into the model, with the help of which the values of the volume of the gross regional product have been corrected. The results of the study can be useful for state authorities and local self-government bodies that manage the regional development of territories, and can be used to develop a strategy for the development of the constituent entities of the Russian Federation.
Gross regional product, subjective factor, objective factor, multiple regression model, correlation, ranking, differentiation of indicators, forecasting
Short address: https://sciup.org/148323965
IDR: 148323965 | UDC: 332.14(470.11)(045) | DOI: 10.37482/issn2221-2698.2022.46.51
Text of the scientific article Assessment of the Influence of Growth Factors on the Gross Regional Product on the Example of Arkhangelsk Oblast
One of the main indicators of the level of development of the regional economy is the gross regional product (GRP). GRP is the main tool in economic and analytical studies conducted at the regional level, especially in comparative analysis, since its value varies significantly within one country.
Russia is the largest country in the world in terms of area — over 17.13 million km2 1. The territories of such large countries as Canada, China, the USA are almost twice less. But, despite
* © Kuznetsova M.N., Vasilyeva A.S., 2022
this, GRP differentiation is observed not only in the regions of the Russian Federation, but also in the regions of foreign countries [1–5].
On the territory of Russia, GRP per capita varies between regions by ten times (Fig. 1). In 2018, for example, the GRP per capita of the Yamalo-Nenets Autonomous Okrug was 10 times higher than the national average and 50 times higher than the value of the Republic of Ingushetia.
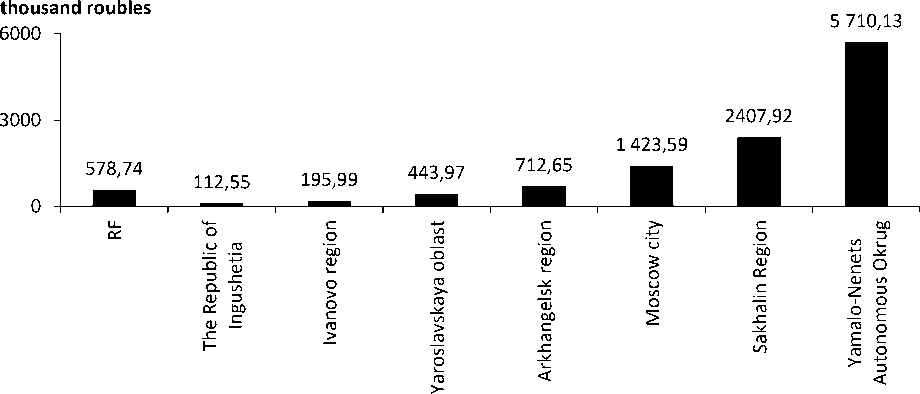
Fig. 1. Share of GRP per capita by regions of the Russian Federation (2018) 2.
In the United States (Fig. 2), this figure in 2019 in the Colombian region was 3 times higher than the national average, but 6.6 times higher than the value of Puerto Rico.
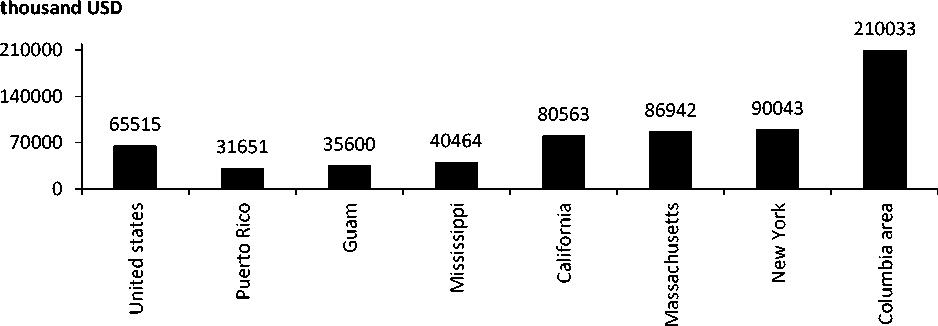
Fig. 2. Share of GRP per capita by US regions (2019) 3.
In China (Fig. 3), in 2019, the GRP of Macau was 8.2 times higher than the national average and 18.6 times higher than the value of Gansu.
-
2 Compiled by the authors. URL: https://rosstat.gov.ru/ (accessed 03 September 2021).
-
3 Compiled by the authors. Source: List of states and territories of the United States by GDP. URL: https://ru.qaz.wiki/wiki/List_of_U.S._states_and_territories_by_GDP/ (accessed 03 September 2021).
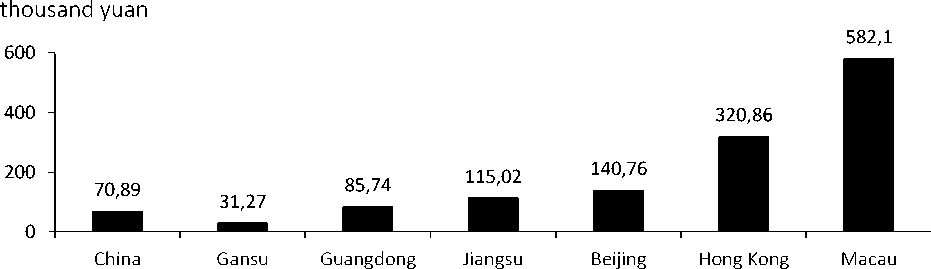
Fig. 3. Share of GRP per capita by regions of China (2019) 4.
Consequently, the problem of differentiation of regional socio-economic development indicators is relevant for the world community and is widely discussed in academic circles.
Approaches to assessing the impact of indicators on the gross regional product
The volume of GRP is influenced by many factors. Many studies have been devoted to their study [6–21, 25].
One approach is to use the classical production function. Baranov S.V. and Skufina T.P. [6, Baranov S.V., Skufina T.P., pp. 57–62] propose to calculate GRP by selecting the value of fixed assets of the regional economy and the average annual number of employed in the economy as influencing factors.
Employees of the Institute of Socio-Economic Research of the USC RAS [7, Gafarova E.A., p. 10] developed a complex simulation model of GRP volume forecasting, where the main indicators include investment in fixed capital, labour costs of employees and costs of research and development. The same factors are chosen by the scientists R.M. Nizhegorodtsev and N.A. Petukhov of the Institute of Management Problems of the RAS 5. To assess their impact on GRP, scientists propose to use the three-factor Cobb-Douglas model [22, 23].
One of the classic approaches to predicting the GRP volume and assessing the influencing factors is the Box-Jenkins method (ARIMA — Autoregressive Integrated Moving Average), which is a linear statistical model. This approach forms the basis of V.S. Mkhitaryan and O.A. Khokhlova’s research [8, p. 53], who used the growth coefficients of the region’s development indicators in the model.
Another method that has become widespread is the method of regression equations. On its basis, M.D. Mamedsupiev [9, p. 53] created an economic-mathematical model of the GRP, where he singled out cash income, investments in fixed capital, the number of employed popula- tion and the volume of industrial production as the determinants. A.N. Petrov [10, Petrov A.N., p. 93] also adheres to this method in his research, taking into account the indexes of regional economic indicators (industrial production, investment in fixed capital, the average annual number of employed people, etc.) when calculating GRP.
The model based on the balanced scorecard (BSC) is also well-known. The possibility of its application to a specific subject of the Russian Federation depends on the information capabilities of statistical data. This model is the subject of studies by E.V. Zarova and R.A. Prozhivin [11, p. 59], who developed an algorithm for assessing the impact of 130 statistical indicators on GRP.
Intuitive methods are also of great importance for the analysis of the influence of factors on GRP, for example, a two-sector simulation model of the Energy Research Institute of the Russian Academy of Sciences for assessing an array of variable factors [12, Shapot D.V., Osipov A.V., p. 74].
Another common model is the input-output method. The works of researchers from the Institute of Economic Forecasting of the Russian Academy of Sciences (IEF RAS) and The Institute of Economics and Industrial Engineering of the RAS are devoted to it. They include the RIM model (Russian Interindustry Model) — a macroeconomic intersectoral model. This model was used in the studies of M.N. Uzyakov and G.R. Serebryakova [13, 14] when evaluating the structure of the regional economy using the least squares method, and in the works of M.V. Chistov [15, 24] when predicting trends in the sectoral structure of the region's economy.
In these methodologies, researchers propose different models for assessing the influence of factors on GRP. However, it should be noted that the trends of modern economic and political events are making their own adjustments, and the issue of taking regional specifics into account remains open.
GRP forecasting model
In this study, the authors developed a methodology for assessing the impact of indicators on the gross regional product. All calculations were made on the example of the Arkhangelsk Oblast.
The Arkhangelsk Oblast is a subject of the Russian Federation, which is located in the European North and is part of the Northwestern Federal District. In terms of area, it is the eighth largest constituent entity 6.
The degree of influence of factors on GRP is proposed to be assessed by means of correlation coefficient. The data for the last 11 years from 2009 to 2019 are taken to build a multiple regression equation (Table 1). The following objective indicators were chosen as factors:
-
• costs of production and sale of products (goods, works and services) of organizations (legal entities) (Х 1 );
Table 1
Factors for constructing multiple regression, million rubles 7
|
Factor |
2009 |
2010 |
2011 |
2012 |
2013 |
2014 |
|
Y |
323606.8 |
372804.8 |
439116.8 |
472470.9 |
500095.1 |
542695.3 |
|
Х 1 |
212035.6 |
238969.5 |
277048.8 |
294286.6 |
320081.9 |
326221.9 |
|
Х 2 |
96480.9 |
98622.3 |
116293.5 |
125233.3 |
148613.1 |
156717.6 |
|
Х 3 |
61504.8 |
71455.2 |
87903.1 |
80406.0 |
96062.9 |
94218.0 |
|
Х 4 |
204233.4 |
254095.8 |
276038.7 |
297986.1 |
449366.0 |
350382.4 |
|
Х 5 |
63282.8 |
73836 |
122139.6 |
149210.9 |
143411.9 |
138458.2 |
|
Х6 |
38691.3 |
42421.6 |
45593.2 |
45229.6 |
49687.4 |
55316.9 |
|
Х 7 |
1258.4 |
787.6 |
981.2 |
1168.3 |
1389.1 |
1572.6 |
|
Factor |
2015 |
2016 |
2017 |
2018 |
2019 |
|
|
Y |
627698.0 |
680482.0 |
726004.8 |
819247.0 |
897103.4 |
|
|
Х 1 |
343633.0 |
364032.0 |
388306.2 |
423051.2 |
454917.1 |
|
|
Х 2 |
159024.0 |
161807.0 |
163041.4 |
177645.1 |
174346.8 |
|
|
Х 3 |
95374.5 |
101268.0 |
120777.5 |
123658.8 |
131495.7 |
|
|
Х 4 |
408996.0 |
425810.0 |
605666.8 |
632968.6 |
393056.9 |
|
|
Х 5 |
155961.0 |
154384.0 |
194847.4 |
173797.2 |
169615.9 |
|
|
Х6 |
61278.1 |
68123.5 |
72179.8 |
74793.5 |
83855.3 |
|
|
Х 7 |
1579.6 |
1808.8 |
4989.3 |
1672.7 |
1579.6 |
-
• amount of IE proceeds from the sale of goods, products, works, services for all types of economic activity (Х 2 );
-
• turnover of small business organizations (Х 3 );
-
• volume of shipped goods of own production, works and services performed on their own in the sections “Mining” and “Manufacturing” (Х 4 );
-
• investments in fixed assets (Х 5 );
-
• labor costs of personnel of organizations (legal entities) (Х 6 );
-
• research and development costs (Х 7 ).
The resulting indicator (Y) is the gross regional product.
The estimation of the parameters of the multiple regression equation is carried out by means of the least squares method and takes the form of (1):
Y = - 0.382* X - 1.179* X 2 -1.173* X 3 + 0.401* X 4 + 1.472* X 5 + 12.647* X 6 -33.607* X 7, (1)
Let us analyze the impact of the regression coefficients in equation (1) on the resulting indicator. A direct comparison of the regression coefficients in equation (1) is justified, since the factors are expressed in identical units — million rubles — and have the same variability, which is estimated by means of the coefficient of variation of factor characteristics (Table 2). It should be noted that only factor X7 has a coefficient of variation different from the others and corresponds to 0.199; for other factors, the variance ranges from 0.061 to 0.119.
-
7 Compiled by the authors. URL: https://rosstat.gov.ru/ (accessed 03 September 2021).
Table 2
Coefficients of variation of factors 8
|
Factor |
Coefficient of variation |
|
Х 1 |
0.067 |
|
Х 2 |
0.061 |
|
Х 3 |
0.068 |
|
Х 4 |
0.119 |
|
Х 5 |
0.086 |
|
Х 6 |
0.078 |
|
Х 7 |
0.199 |
The coefficients of the multiple regression equation (1) show the size of the influence of factors Х 1 , Х 2 , Х 3, Х 4 , Х 5 , Х 6 , Х 7 on the level of the resulting indicator in absolute terms. The greatest influence is exerted on GRP when factors are fixed: Х 3 , Х 6 , Х 7 (Table 3).
For comparative assessments of the role of factors in the GRP formation, absolute values should be supplemented with relative, in particular, normalized regression coefficients. This will make it possible to identify the factors that contain the largest reserves for changing the performance indicator (GRP) (Table 3). The analysis of the values of the normalized regression coefficients shows that, taking into account the degree of variation of factors, the largest reserves in the GRP change lie in the increase of factors Х 4 , Х 6 , Х 5, Х 1 .
Table 3 shows that the ranks of factors in terms of the regression coefficient (absolute values) and in terms of the normalized regression coefficient (relative values) coincide or are close in terms of factors Х 2 , Х 5 , Х 6 . The discrepancy in the assessment is observed for factors Х 1 , Х 3 , Х 4, Х 7.
Table 3
Analysis of regression coefficients 9
|
Fac tor |
Regression Coefficient |
Rank of factors by the regression coefficient |
Normalized regression coefficients |
Rank of factors by the normalized regression coefficient |
|
Х 1 |
-0.382 |
7 |
-0.00052 |
4 |
|
Х 2 |
-1.179 |
5 |
-0.00024 |
5 |
|
Х 3 |
-1.723 |
3 |
-0.00020 |
6 |
|
Х 4 |
0.401 |
6 |
0.00219 |
1 |
|
Х 5 |
1.472 |
4 |
0.00058 |
3 |
|
Х 6 |
12.647 |
2 |
0.00070 |
2 |
|
Х 7 |
-33.607 |
1 |
-0.00001 |
7 |
Let us turn to the assessment of the quality of the regression equation (1). The multiple correlation coefficient is 0.999. According to the Chaddock table, the qualitative assessment of the relationship between the effective attribute (GRP) and factor attributes is very high. The parameters of the regression model reflect the effectiveness of the included indicators. The coefficient of multiple determination corresponds to 0.998. The adjusted multiple regression coefficient, which determines the tightness of the connection, taking into account the degrees of freedom of the total variance and residual variance, is 0.999. It allows evaluating the closeness of the relationship,
-
8 Authors' calculations.
-
9 Authors' calculations.
which does not depend on the number of indicators. Both coefficients indicate a high level of correlation (over 98%).
In the paper, the reliability of the indicator of closeness of correlation was assessed according to F — Fisher’s criterion. The actual value of the criterion was 1812.4 and does not exceed the permissible significance level of 5% (Fcrit = 6.09).
So, the obtained value is not accidental, it was formed under the influence of significant indicators. The statistical significance of both the regression equation and the closeness of the correlation is confirmed. The standard error of the regression equation is 17.9 billion rubles.
Table 4 shows the matrix of paired coefficients of the multiple regression model.
Table 4
Matrix of paired coefficients of multiple regression model 10
|
Х 1 |
Х 2 |
Х 3 |
Х 4 |
Х 5 |
Х 6 |
Х 7 |
У |
|
|
Х 1 |
1 |
|||||||
|
Х 2 |
0.964 |
1 |
||||||
|
Х 3 |
0.971 |
0.911 |
1 |
|||||
|
Х 4 |
0.942 |
0.877 |
0.964 |
1 |
||||
|
Х 5 |
0.924 |
0.891 |
0.906 |
0.85 |
1 |
|||
|
Х6 |
0.959 |
0.913 |
0.934 |
0.915 |
0.839 |
1 |
||
|
Х 7 |
0.554 |
0.489 |
0.638 |
0.665 |
0.638 |
0.635 |
1 |
|
|
Y |
0.986 |
0.935 |
0.951 |
0.930 |
0.881 |
0.987 |
0.569 |
1 |
As seen from Table 4, there is a direct correlation with all factors in GRP, indicating that the growth of each of them causes an increase in GRP. The strongest influence is exerted by the following factors: the costs of production and sale of products (goods, works and services) of organizations (legal entities) (X 1 ), the correlation coefficient is 0.986, the costs of remuneration of personnel of organizations (legal entities) (X 6 ). The least influence of the factors under consideration is the costs of research and development (X 7 ) — 0.569.
According to Table 4, there is a high dependence between the factors. This suggests that one of the factors should be excluded from consideration, but the task of the study is to predict GRP. The coefficient of multiple determination is greater than 0.9, so the presence of multicollinearity does not affect the quality of the developed model. To reduce multicollinearity, it is sufficient to increase the sample size.
Thus, the model is reliable and can be used for further forecasting.
On the basis of the average annual growth rates, the values of the factors for the forecast period were calculated (Table 5). Using the model (1), the values of GRP (Y) for 3 planning years are determined.
-
10 Authors' calculations.
Table 5
Forecasting the values of objective factors and GRP 11
|
Factor |
Average annual growth rate |
Value for the forecast period, million rubles |
||
|
1 year |
2 year |
3 year |
||
|
x1 |
1.079 |
491003.5 |
529952.5 |
571991.1 |
|
x2 |
1.061 |
184974.2 |
196249.5 |
208212.0 |
|
x3 |
1.079 |
141876.9 |
153077.7 |
165162.8 |
|
x4 |
1.111 |
653317.8 |
726161.9 |
807128.0 |
|
x5 |
1.104 |
187190.9 |
206586.9 |
227992.6 |
|
x6 |
1.080 |
90598.8 |
97884.6 |
105756.2 |
|
x7 |
1.023 |
1747.2 |
1787.4 |
1828.5 |
|
у |
- |
974477.6 |
1075555.8 |
1186713.3 |
In addition to objective factors affecting GRP, it is advisable to consider the impact of subjective factors (political, climatic, environmental) [26]. The choice of these indicators is justified by the fact that the political situation is of great importance for the development of the region's economy, especially in recent times. Consideration of climatic and environmental conditions in the Arkhangelsk Oblast is associated with the geographical location of the RF subject. It is proposed to evaluate these factors using the method of expert assessments. Let us consider the ratings of influential agencies.
In July 2020, the Petersburg Politics Foundation presented a rating of socio-political sustainability of Russian regions. According to the data, the Arkhangelsk Oblast was among the regions with low socio-political stability 12.
According to the experts of the CROS analytical department on the National Anxiety Index, calculated as a weighted average coefficient, the Arkhangelsk Oblast was in the top 10 “anxious regions” in 2019. The main reasons are the following: political changes in the country (change of the Government, amendments to the Constitution), environmental situation, coronavirus infection 13. The work of the head of the region has a significant impact on the level of anxiety.
In 2020, the Centre for Information Communications “Rating” within the framework of the “National Rating” project, has conducted a research, based on an absentee survey of experts, aimed to evaluate the performance of heads of subjects of the Russian Federation, according to which the Arkhangelsk Oblast ranked 70th place among other regions 14.
According to the results of the study “Rating of influence of the heads of subjects of the Russian Federation” by the Agency for Political and Economic Communications, the head of the Arkhangelsk Oblast moved down from 48th to 52nd place, leaving the group of strong influence. The assessment took into account the results of the implementation of major projects in the field
SOCIAL AND ECONOMIC DEVELOPMENT
Marina N. Kuznetsova, Anastasia S. Vasilyeva. Assessment of the Influence … of transport and social infrastructure, anti-corruption investigations, as well as the consequences of negative events with public resonance 15.
The indicator of the quality of life is of great importance among the factors influencing GRP. According to the RIA Agency, the Arkhangelsk Oblast ranked 74th by this indicator in 2019, and 75th — in 2020, entering the top ten outsiders 16. The rating was calculated according to 70 indicators combined into 11 groups, among which attention is paid to environmental and climatic conditions.
The Arkhangelsk Oblast is located in the northern part of European Russia, has unfavorable climatic conditions for living and development of many sectors of the national economy (agriculture, housing and communal services). This leads to negative trends in demographic and environmental indicators.
According to the All-Russian public organization “Green Patrol”, the Arkhangelsk Oblast took 51st place in the sphere of environmental security and protection (“National ecological rating of regions”) 17.
The study of the Analytical Credit Rating Agency (ACRA) is based on the relative indicators of the negative impact obtained as the ratio of the absolute value of the factor in the analyzed entity to the size of its GRP (for example, the volume of emissions or wastewater discharge) 18. As of February 2021, the Arkhangelsk Oblast ranked 53rd among the regions of the Russian Federation.
Thus, the analysis of the ratings of the leading agencies showed that the Arkhangelsk Oblast is in 51–75 places among 85 regions of the Russian Federation according to the selected factors, which indicates an unstable situation. As a result the GRP volume projected with the help of the presented model (1) should be adjusted for the future period, taking into account the impact of adverse subjective factors.
To do this, we introduce the correction factor presented in Table 6 into our model (1).
Table 6
GRP volume correction factor 19
|
Place of the region in the ratings of leading agencies |
Value of the correction factor |
|
1–25 |
1.05 |
|
26–50 |
1.0 |
|
51–75 |
0.95 |
|
76–100 |
0.9 |
The regions ranked from 1st to 25th place are among the leaders that have favorable subjective factors that contribute to the development of the region's economy and the growth of GRP. Therefore, the value of the correction factor is greater than 1.
The subjects that fell into the third and fourth groups are the outsiders; therefore, the impact of subjective factors in these regions slows down the growth of GRP. The stronger the negative impact, the lower the value of the correction factor.
The Arkhangelsk Oblast, according to our methodology, falls into the third group, for which a coefficient of 0.95 is applied. Let us correct the value of the predicted GRP (Y) (Table 7).
Table 7
GRP forecast with correction factor 20
|
Indicator |
Value for the forecast period, million rubles |
||
|
1 year |
2 year |
3 year |
|
|
Y |
974 477.6 |
1 075 555.8 |
1 186 713.3 |
|
Y updated |
925 753.7 |
1 021 778.0 |
1 127 377.7 |
As can be seen, the values of the gross regional product will decrease by 5%. Thus, the influence of the most significant subjective factors for the given region is taken into account.
Conclusion
It should be noted that this paper represents the authors’ approach to assessing the impact of regional indicators on the gross regional product and only partially illuminates the complex and multifaceted problem of differentiation of the socio-economic development of the constituent entities of the Russian Federation.
The study substantiates the necessity to take into account the influence of factors on GRP, based on the characteristics of each region. This is caused by the territorial differentiation of many indicators, typical both for the economy of the Russian Federation and for foreign countries.
These factors in the paper are divided into objective and subjective. All the calculations were carried out on the indicators of the Arkhangelsk Oblast.
The evaluation of the first group was made using a multifactorial model, which is a multiple regression equation. Seven factors were selected that have a close correlation with the gross regional product. The sample of initial data was carried out for 11 years. The reliability of the model was confirmed statistically. The result is the calculation of GRP for the forecast period.
The influence of factors of the second group was taken into account on the basis of the method of expert assessments of leading agencies. Significant subjective factors for the northern region were taken for the research. Based on the study of the ratings, a scale of the GRP adjustment coefficient was developed and its significance for the Arkhangelsk Oblast was taken into account.
Thus, the advantage of this methodology is an integrated approach based on the use of statistical methods and the method of expert assessments of objective and subjective factors. The
-
20 Authors' calculations.
developed model can be used in medium-term forecasting of regional development. It should be noted that the result of its application to data from other subjects of the Russian Federation will depend on the representativeness of the sample of initial indicators of objective factors and the list of subjective ones.
A promising direction for further research on this issue is to increase the list of assessed factors and test this methodology on statistical indicators of other regions.
References Assessment of the Influence of Growth Factors on the Gross Regional Product on the Example of Arkhangelsk Oblast
- Ogryzek M., Wisniewski R., Kauko T. On Spatial Management Practices: Revisiting the «Optimal» Use of Urban Land. Real Estate Management and Valuation, 2018, vol. 26, no. 3, pp. 24−34. DOI: 10.2478/remav-2018–0022
- Slaper T.F., Harmon K.M., Rubin B.M. Industry Clusters and Regional Economic Performance: a Study across U.S. Metropolitan Statistical Areas. Economic Development Quarterly, 2018, vol. 32, no. 1, pp. 44−59. DOI: 10.1177/0891242417752248
- Glushchenko K.P. Ob otsenke mezhregional'nogo neravenstva [On Estimation of Inter-Regional Ine-quality]. Prostranstvennaya ekonomika [Spatial Economics], 2015, no. 4, pp. 39–58. DOI: 10.14530/se.2015.4.039–058.26
- Krivoshlykov V.S., Zhakhov N.V. Ekonomika i upravlenie mezhregional'noy differentsiatsiey [Econom-ics and Management of Interregional Differentiation]. Vestnik NGIEI [Bulletin NGIEI], 2017, no. 1, pp. 119–129.
- Golova I.M., Sukhovey A.F. Differentsiatsiya strategiy innovatsionnogo razvitiya s uchetom spetsifiki rossiyskikh regionov [Differentiation of Innovative Development Strategies Considering Specific Characteristics of the Russian Regions]. Ekonomika regiona [Economy of Region], 2019, vol. 15, iss. 4, pp. 1294–1308. DOI: 10.17059/2019-4-25
- Baranov S.V., Skufina T.P. Modelirovanie proizvodstva valovogo regional'nogo produkta v zone Sev-era i nesevernoy chasti Rossii [Modeling of Production of Gross Regional Product at the North Area and Non-North Part of Russia]. Voprosy statistiki, 2007, no. 2, pp. 57−62.
- Gafarova E.A. Modelirovanie regional'nogo razvitiya na osnove proizvodstvennoy funktsii [Modeling of Regional Development Based on Production Functions]. Naukovedenie, 2013, no. 3, p. 10.
- Mkhitaryan V.S., Khokhlova O.A. Statisticheskoe issledovanie razvitiya ekonomiki regiona [Statistical Research of the Region Economy Development]. Voprosy statistiki, 2008, no. 8, pp. 53−59.
- Mamedsupiev M.D. Mnogofaktornaya model' otsenki valovogo regional'nogo produkta Vostochno-Kazakhstanskoy oblasti [Multifactorial Model for Assessing the Gross Regional Product of the East Kazakhstan Region]. Nash obshchiy dom — Altay. Mezhdunarodnoe partnerstvo: nauka, ekonomika, obrazovanie, kul'tura, turizm: mezhdunar. nauch.-prakt. konf. [Our Common Home — Altai. Interna-tional Partnership: Science, Economy, Education, Culture, Tourism: Intern. Sci.-Practical. Conf.]. Ust-Kamenogorsk, VKRU Publ., 2008, pp. 17−22.
- Petrov A.N. Kompleks ekonomicheskikh modeley dlya prognozirovaniya indeksa valovogo region-al'nogo produkta Ivanovskoy oblasti [Complex of Economic Models for Forecasting the Index of the Gross Regional Product of the Ivanovo Region]. Izvestiya vysshikh uchebnykh zavedeniy. Seriya Ekonomika, finansy i upravlenie proizvodstvom [News of Higher Educational Institutions. Series Eco-nomics, Finance and Production Management], 2011, no. 1, pp. 93−101.
- Zarova E.V., Prozhivin R.A. Sbalansirovannaya sistema pokazateley razvitiya regiona: statisticheskoe obosnovanie i ekonometricheskoe modelirovanie [Balanced System of Region Development Indica-tors: Statistical Justification and Econometric Modeling]. Voprosy statistiki, 2008, no. 8, pp. 59−66.
- Shapot D.V., Osipov A.V. Dvukhsektornaya imitatsionnaya model' prognozirovaniya razvitiya ekonomiki [Two-Sector Simulation Model for Forecasting the Development of the Economy]. Otrasli i mezhotraslevye kompleksy [Branches and Interbranch Complexes], 2001, no. 7, pp. 74−88.
- Serebryakov G.R., Uzyakov M.N., Yantovsky A.A. Mezhotraslevaya model' ekonomiki Ivanovskoy ob-lasti [The Ivanovo Oblast Economy: An IO Model]. Problemy prognozirovaniya [Studies on Russian Economic Development], 2002, vol. 13, no. 5, pp. 485-494.
- Uzyakov M.N., Sapova N.N., Khersonsky A.A. Instrumentariy makrostrukturnogo regional'nogo prognozirovaniya: metodicheskie podkhody i rezul'taty raschetov [A Toolkit for Macrostructural Re-gional Forecasting: Methodological Approaches and Results of Computations]. Problemy prognozi-rovaniya [Studies on Russian Economic Development], 2010, vol. 21, no. 2, pp. 3−20.
- Chistova M.V. Metody i modeli prognozirovaniya obyemov valovogo regional'nogo produkta [Methods and Models of Gross Regional Product Volumes Forecasting]. Vestnik Adygeyskogo gosu-darstvennogo universiteta. Ser. 5: Ekonomika [Bulletin of the Adyghe State University. Ser. 5: Econ-omy], 2014, no. 1 (138), pp. 116−126.
- Lavrikova Yu.G., Suvorova A.V. Optimal'naya prostranstvennaya organizatsiya ekonomiki regiona: poisk parametrov i zavisimostey [Optimal Spatial Organisation of the Regional Economy: Search for Parameters and Dependencies]. Ekonomika regiona [Economy of Region], 2020, vol. 16, iss. 4, pp. 1017−1030. DOI: 10.17059/ekon.reg.2020-4-1
- Shirov A.A., Yantovskiy A.A. Opyt razrabotki instrumentariya dolgosrochnogo makroekonomich-eskogo prognozirovaniya [On the Development of Long-Term Macroeconomic Forecasting Tools]. Nauchnye trudy. Institut narodnokhozyaystvennogo prognozirovaniya RAN [Scientific Works. Insti-tute of Economic Forecasting RAS], 2008, vol. 6, pp. 96−110.
- Lukas R. On the Mechanism of Economics Development. Journal of Monetary Economics, 1988, vol. 22, pp. 3−42.
- Johnston J. Econometric Methods. Moscow, Nauka Publ., 1980, 444 p.
- Pyke F., Sengenberger W. Industrial Districts and Local Economic Regeneration. Geneva, ILO Publ., 1992, 294 p.
- Fritsch M., Lukas R. Innovation, Cooperation, and the Region. Innovation, Industry Evolution and Employment. Cambridge, Cambridge University Press, 1999, 321 p.
- Suvorov N.V. Razvitie metodov issledovaniya statisticheskikh zavisimostey. Regressionnye modeli s peremennymi strukturnymi parametrami [Development of Research Methods for Statistical De-pendences: Regression Models with Variable Structural Parameters]. Voprosy statistiki, 2018, no. 6, pp. 3–15.
- Cobb C., Douglas P. A Theory of Production. The American Economic Review, 1928, no. 18 (1), pp. 139–165.
- Chistova M.V. Prognozirovanie obyemov valovogo regional'nogo produkta metodom “zatraty-vypusk”: otechestvennyy i zarubezhnyy opyt [Forecasting the Volumes of the Gross Regional Prod-uct by the Method of "Input-Output": Domestic and Foreign Experience]. Vestnik Adygeyskogo gosudarstvennogo universiteta. Ser. 5: Ekonomika [Bulletin of the Adyghe State University. Ser. 5: Economy], 2013, no. 3 (127), pp. 148−157.
- Altay H., Celebioglu F. The Impacts of Political Terrorism on Gross Domestic Product in Eurasia: A Spatial Data Analysis. Eurasian Journal of Business and Economics, 2015, vol. 8, no. 15, pp. 21–37. DOI: 10.17015/ejbe.2015.015.02
