Assessment of the level of socio-economic development in municipal formations of the Vologda oblast

Author: Voroshilov Nikolai Vladimirovich, Gubanova Elena Sergeevna
Journal: Economic and Social Changes: Facts, Trends, Forecast @volnc-esc-en
Section: Development strategy
Article in issue: 6 (36) т.7, 2014.
Free access
Socio-economic development of regions depends to a great extent on the state of economy and social sphere in its constituent municipalities, because this level of government provides basic services to the population, and ensures comfortable living conditions, which determines the growth of the standard of living and quality of life. Under the conditions of the increase in the differentiation of socio-economic development of territories it becomes especially important to identify and study groups (types) of territories with similar development factors, conditions and parameters in order to implement specific measures of regional policy. The authors propose and test a methodology of comparative analysis, which used different techniques of standardization of indicators, which makes it possible to assess the level of socio-economic development of municipal and urban districts in the Vologda Oblast, and to distinguish 5 types of territories on the basis of calculation of the integral index that aggregates 18 initial statistical indicators. The article shows that the highest level of socio-economic development is characteristic of the cities of Vologda and Cherepovets and adjacent areas; the farther from the oblast center, the lower this level. The typological classification of the municipalities makes it possible to propose main directions and instruments of regional policy for territories with different levels of development.
Vologda oblast, municipality, municipal district, urban district, level of socio-economic development, territorial differentiation, grouping, typological classification of territories
Short address: https://sciup.org/147223682
IDR: 147223682 | UDC: 332.1 | DOI: 10.15838/esc/2014.6.36.5
Text of the scientific article Assessment of the level of socio-economic development in municipal formations of the Vologda oblast
One of the most important tasks of regional development is overcoming uneven socio-economic development of municipalities. Objective inequality of resources, conditions and development possibilities leads to territorial differentiation, and to significant differences by basic indicators of socio-economic development of the RF subjects and municipalities. Uneven development causes disparities in the standard of living of the population, its migration to more favorable territories, decline in development and “extinction” of communities. Such problematic areas require special support measures from the state and local governments.
The study of socio-economic processes has indicated that the differentiation of Russian regions is one of the highest in the world, and it is even more significant at the local level. The Vologda Oblast follows the trend. As of January 1, 2014, there were 283 municipal structures, including 2 urban districts (Vologda and Cherepovets), 26 municipal districts, 22 urban and 233 rural settlements. Table 1 presents a number of indicators clearly describing uneven socioeconomic development of the region’s municipalities.
The table discloses that the gap between 26 municipal districts by per capita volume has increased from 30 times in 1991 to 733 times in 2013 in industrial production, from 10 to 19 times in agricultural production, from 2.5 to 160 times in investment. During the study period the social sphere is characterized by multidirectional changes, according to a number of indicators (in particular, wage rate, provision with doctors, housing, and retail trade turnover); however, differentiation is still hindering the region’s development.
Table 1. Ratio of maximum and minimum values among the municipal districts of the Vologda Oblast, times
|
Indicator |
Year |
||||||
|
1991 |
1996 |
2001 |
2006 |
2011 |
2012 |
2013 |
|
|
Volume of industrial production per person |
29.9 |
40.6 |
78.8 |
47.7 |
537.3 |
366.2 |
733.5 |
|
Volume of agricultural production per person |
10.1 |
10.1 |
9.7 |
20.1 |
19.6 |
19.6 |
19.1 |
|
Volume of investment in fixed capital per person |
2.5 |
14.7 |
26.8 |
35.3 |
22.2 |
83.8 |
160.4 |
|
Average monthly nominal accrued wage |
1.3 |
2.2 |
2.0 |
1.5 |
2.1 |
2.9 |
1.9 |
|
Retail trade turnover per person |
1.3 |
3.0 |
2.8 |
2.5 |
1.7 |
1.8 |
1.9 |
|
Provision with doctors per 10000 people |
2.8 |
2.8 |
3.6 |
3.5 |
3.4 |
3.4 |
3.0 |
|
Provision with housing, square meters per person |
1.5 |
1.5 |
1.4 |
1.8 |
1.6 |
1.6 |
1.6 |
Note. The calculations hereafter are conducted by the authors on the basis of official statistical information on the regions and cities of Vologda region [6; 10; 11].
At the end of 2013 90% of the industrial production and 63% of all investment in value terms was concentrated in two urban districts of Vologda and Cherepovets, while 2/3 (63%) of agricultural production – in five territories surrounding these urban areas. This situation results in decreased possibilities and prospects for development of most peripheral areas, a lower life standard of the population and low investment activity.
However, the municipal government, being aware of the population’s specific needs and interests, provides the necessary conditions. Moreover, most problems of socio-economic development are geographically localized at this level (municipalities, urban and rural settlements, urban districts, intra-city areas of federal cities) [3]. Therefore, the development of municipalities, where the specific features of territories, local resources and conditions can be assessed, largely determines socioeconomic development of the territorial units of a higher level (a RF subject and the country in general).
Current regional mechanisms to manage the territorial differentiation of socioeconomic development mainly aim to align the budget capacity of municipalities and they do not take into account the specifics of their socio-economic development, resources and potential. In order to ensure integrated and effective development it is necessary to elaborate a graded approach to regulatory impact, including the search for new forms and methods, on municipal formations on the part of a federation subject and on settlements on the part of municipal districts. This approach can be based on the typology of territories that identify administrative units with similar resources, characteristics, trends and problems of socio-economic development.
The analysis of Russian economists’ works has shown that there are two key approaches to make typological characterization: qualitative and quantitative. The first approach involves the selection of regions with similar quality characteristics, resources and development conditions (for example, cross-border, distressed, depressed and underdeveloped; old industrial, regions – “driving forces of growth”, strong, etc.). The second approach proposes making different integral ratings of territories 1 using a variety of socio-economic indicators and selecting groups of regions or municipal formations on this basis [1].
Nowadays the scientists have developed the method to assess the level of socioeconomic development in regions and municipalities, as well as their potential, competitiveness, investment attractiveness, life quality of the population. Their main differences lie in the composition of the indicators used and the mathematical tools of their aggregation in the integral index. The original indicators in most cases are standardized (normalized) relative to the average or best value (standard).
However, most methods have shortcomings, such as a great number of indicators used for evaluation and complexity of the mathematical tools of their processing. This can complicate the interpretation of results; cause the alignment of obvious differences between actors when making standardization of initial indicators relative to better values, which in most cases are outlying data (significantly higher than in other regions) in some raw material regions [2].
In our opinion, it is worthwhile considering the methodological approach that uses multidimensional comparative analysis to assess the level of socio-economic development. It is an average degree of the region’s (municipality’s) achievement of values relative to the average, benchmark or best values [2]. The similar approach was used in the studies carried out by ISEDT RAS, reflected in [1; 4; 9; 12; 14].
This method is more preferable as it estimates the development level of regions [2] and municipalities [1].
The method presupposes the calculation of the integral indicator characterizing the level of socio-economic development of municipalities and aggregating initial statistical indicators and on this basis selection of five groups of territories. The algorithm we suggest using [2] for municipalities development estimation is presented below.
At the first stage on the basis of available official statistical information the list and blocks of indicators reflecting different aspects of socio-economic development of territories are formed. All data for all municipalities over a long period (not less than 10 years) are collected during the stage. Table 2 presents the list and blocks of data (considered in the monograph [9]), with some changes being made.
Table 2. List and blocks and indicators to calculate the integral index of the socio-economic development level
|
Block of indicators |
Indicator |
|
R 1 Demographic indicators |
|
|
R 2 Provision of amenities |
|
|
R 3 Standard of living |
|
|
R 4 Economy |
|
At the second stage the indicators that make up the blocks content are standardized relative to the average:
k i =x i /x cpi , (1)
k i = x cpi /x i , (2)
where ki is a standardized coefficient, which is calculated by Formula 1 for direct indicators 2 and by Formula 2 for opposite 3 ; xi is a value of the i-th indicator in the municipality; Xcpi is an average value of the i-th indicator for all municipal districts and urban districts in the region (regional average) or municipal districts.
The indicators can be standardized
(normalized) relative to the best and worst value for all studied territories:
= xi - xmin i X -x max min
= xi — xmax i X -X min max
k i =x i /x max , (5)
k i = x min /x i ,
where ki is a standardized coefficient, which is calculated by formulas 3 or 5 for direct indicators and by formulas 4 or 6 for opposite; xi is a value of the i-th indicator in the municipality; xmax is a maximum value of the i-th indicator for all analyzed municipalities in the region; xmin is an average value of the i-th indicator for all municipalities.
When normalizing the values of standardized coefficients by formulas 3 and 4 and the synthetic indices by blocks, the integral index can be in the interval from 0 to 1.
To make different indicators comparable and eliminate “outlying data” (extreme minimum and maximum values) it is possible to use the z-transformation:
ki =
x i - x
О
where xi is a value of the i-th indicator in the municipality; xcpi is an average value of the i-th indicator for all municipalities; σ is standard (RMS) deviation by the indicator.
On the basis of standardized indicators the synthetic index was defined for each of the blocks (Rj) by the following formula:
n
R j = ( 2 k i >/n, (8)
where n is s number of indicators in the block.
At the third stage the integral index of the level of the RF subject’s socio-economic development is calculated (I total ):
I total = (R 1 + R 2 + R 3 + R 4 )/4 , (9)
where R1 is an integral index by the block “Demographic indicators”; R2 is an integral index by the block “Provision of amenities”; R3 is an integral index by the block “standard of living”; R4 is an integral index by the block “Economy”.
At the fourth (final) stage the municipalities are grouped according to socio-economic development, which is defined by the following interval estimates of the integral indicator I :
total
|
Level |
Range I total |
|
|
standardization by formulas 1 and 2 |
standardization by formulas 3 and 4 |
|
|
High |
I ≥ 1.15 |
0.8 ≤ I ≤ 1.0 |
|
Above average |
1.05 ≤ I < 1.15 |
0.6 ≤ I < 0.8 |
|
Average |
0.95 ≤ I < 1.05 |
0.4 ≤ I < 0.6 |
|
Below average |
0.85 ≤ I < 0.95 |
0.2 ≤ I < 0.4 |
|
Low |
I < 0.85 |
0.0 ≤ I < 0.2 |
The selection of five gradations of the development level helps simplify the results interpretation and identify the similarities and differences in the development of municipalities. The interval span of 0.1 units (for standardization by formulas 1 and 2), in our opinion, is fairly optimal, since the regions of each group in this case are different from the regions of the neighboring groups by 10% on average by all indicators (for example, by the wage rate the districts differed by 25127 rubles on average in 2013. 0.1 is equal to 2513 rubles that amounts to one third of subsistence minimum in the region, which is rather significant).
This method was tested by means of state statistics of the Vologda Oblast; it gave the opportunity to evaluate the socioeconomic development level (hereinafter SEDL) as a whole. The study results are presented in figures 1–3, tables 3 and 4. Figure 1 shows the grouping of municipal districts and urban districts (Vologda and Cherepovets) region as of year-end 2013 (18 initial indicators are standardized relative to the regional average by formulas 1 and 2), which again clearly confirms the fact that the main economic activity is concentrated in two urban areas and their surrounding areas. Nineteen out of twenty-six districts were in the group with the low level of development (the majority of the indicators in these areas lag behind the regional average and the urban districts values significantly). It gives the opportunity not to consider these cities in the study and focus only on municipal districts.
Figure 2 (see also tab. 4) presents the grouping of the Vologda Oblast municipal districts by SEDL in 2000 and in 2013 (18 initial indicators are standardized relative to the regional average by formulas 1 and 2).
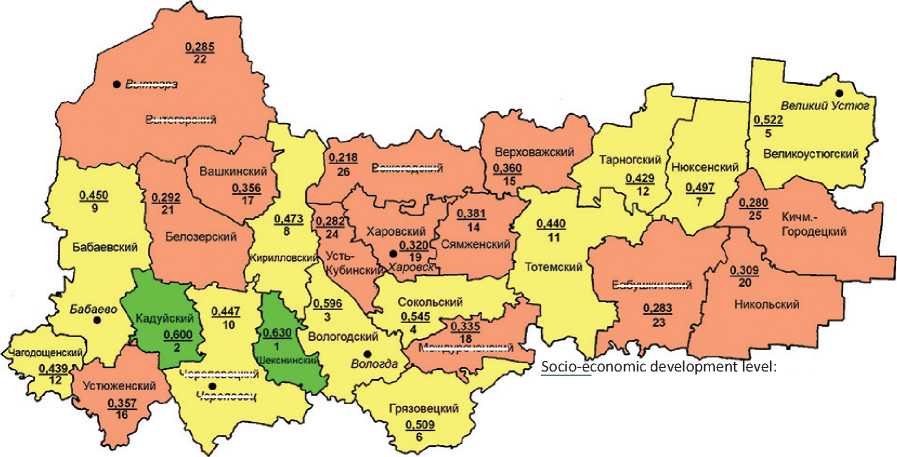
Figure 3 shows the grouping of municipal districts in 2013 (18 initial indicators are standardized relative to the maximum and minimum values by formulas 3 and 4). So, there are no regions in the group with high and low level of socio-economic development. The leaders of the industrial production, Sheksninsky District and Kaduysky District are in the group with the above average development level, 11 districts – in the group with the average level, 13 – in the group with the below average level.
Table 3 shows the grouping of the Vologda Oblast municipal districts by SEDL. The initial 18 indicators are standardized using the z-transformation by Formula 7.
The integral index characterizing the socio-economic development level of the Vologda Oblast districts (by 18 initial statistical indicators, standardized relative to the regional average) discloses that, in general, the situation has deteriorated in the region for 2000–2013. If in 2000 the group with the low level of development consisted of 8 regions, in 2013 – of 12 ( tab. 4 , see fig. 2). The number of districts with the high level of development remained unchanged; there were 6 districts in the group.
Figure 1. Grouping of municipal districts and urban districts of the Vologda Oblast in terms of socio-economic development in 2013 (standardization of the initial indicators relative to the regional average)
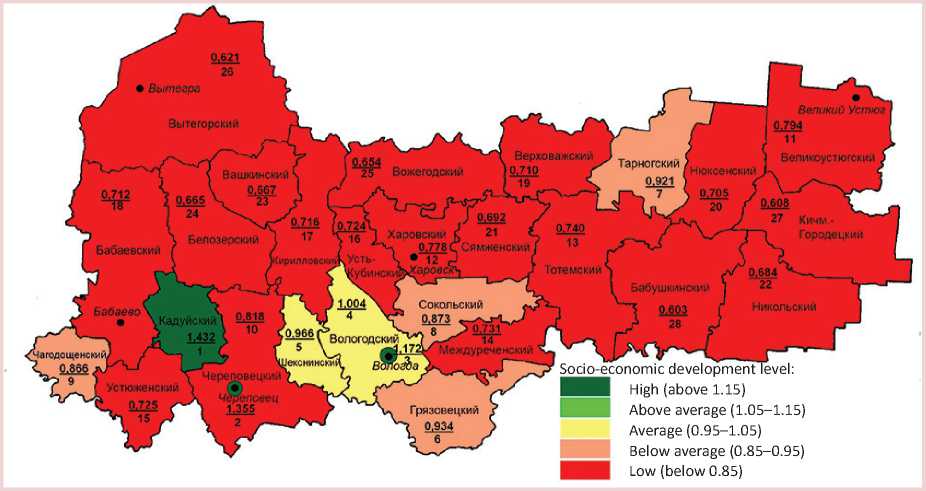
Figure 2. Grouping of the Vologda Oblast municipal districts in terms of socio-economic development in 2013 (standardization of the initial indicators relative to the region average)
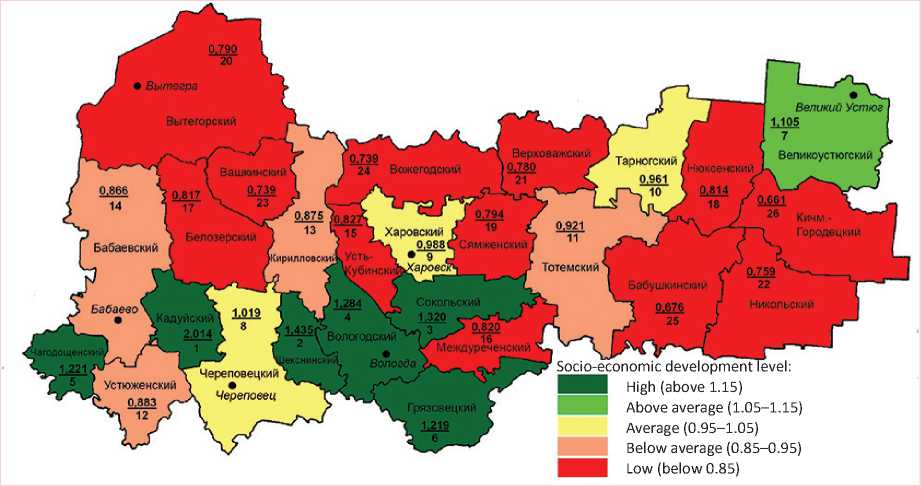

Figure 3. Grouping of the Vologda Oblast municipal districts in terms of socio-economic development in 2013 (standardization of the initial indicators relative to the maximum and minimum values)
Вытегра
Зыте горским
Вожегодскии
Бабушки некий междуреченскии
Череповецким
Череповец
High (above 0.8)
Above average (0.6–0.8)
Average (0.4–0.6)
Below average (0.2–0.4)
Low (below 0.2)
As a whole, during the study period the deterioration of the socio-economic situation was observed in 6 municipalities (Cherepovetsky District, Totemsky District, Belozersky District, Nyuksensky District, Vytegorsky District, Vashkinsky District). Three districts (Gryazovetsky District, Kharovsky District, Tarnogsky District) moved to the group with the higher level of development.
In 2013 the group with the high level of socio-economic development consisted of Kaduysky District, Sheksninsky District, Sokolsky District, Chagodoshensky District, Vologdsky District and Gryazovetsky District. The first 4 districts are the region’s leaders by per capita volume of industrial production (the value is 2.5 times higher than the regional average).
Vologdsky District, Gryazovetsky District and Sheksninsky District are leaders in the agricultural production.
All municipalities, included in this group, are quite attractive for investment; Kaduysky District, Chagodoshensky District and Gryazovetsky District range the 1st, 3rd and 4th, respectively, among the districts in terms of investment per person. In these areas the unemployment rate is low (except for Chagodoshensky District where it is above average). The share of housing equipped with water supply, sewerage and central heating (provision of amenities is above average), all the districts of this group take places not lower than tenth.
In 2013 the group with the above average level consisted of Velikoustyugsky District, with the values of individual indicators
Table 3. Grouping of the Vologda Oblast municipal districts by SEDL in 2013 (standardization of the initial indicators is carried out using the z-transformation)
|
SEDL |
Municipal district |
|
High |
1. Sheksninsky (0.627); 2. Kaduysky (0.599); 3. Sokolsky (0.433); 4. Vologodsky (0.403) |
|
Above average |
5. Velikoustyugsky (0.359); 6. Gryazovetsky (0.333); 7. Tarnogsky (0.164) |
|
Average |
8. Kirillovsky (0.049); 9. Nyuksensky (0.046); 10. Totemsky (0.042); 11. Babaevsky (-0.019); 12. Cherepovetsky (-0.048) |
|
Below average |
13. Chagodoshchensky (-0.098); 14. Kharovsky (-0.171); 15. Syamzhensky (-0.184); 16. Verkhovazhsky (-0.248); 17. Ustyuzhensky (-0.275); 18. Nikolsky (-0.292) |
|
Low |
19. Mezhdurechensky (-0.380); 20. Belozersky (-0.380); 21. Vashkinsky (-0.395); 22. Ust-Kubinsky (-0.454); 23. Vytegorsky (-0.463); 24. Kichmengsko-Gorodetsky (-0.506); 25. Babushkinsky (-0.525); 26. Vozhegodsky (-0.556) |
|
Note. In brackets next to the district name there is an integral index value indicating the level of socio-economic development. |
|
Table 4. Distribution of the Vologda Oblast by the value of the integral index of socio-economic development
In 2013 Cherepovetsky District, Kharovsky District and Tarnogsky District areas belonged to the group with the average level of socio-economic development. The per capita volume of industrial and agricultural production in these municipalities (except for Cherepovetsky District) is below the regional average. In Kharovsky District per capita investment in fixed capital of the district’s enterprises is one of the highest (2nd place) among the districts. The economic situation in this district is characterized by a high unemployment rate – 1.8% in 2012, with the regional average being 1.7%.
The demographic situation in Cherepovetsky District, Kharovsky District and Tarnogsky District areas remains poor. Thus, the mortality rate in Kharovsky District and Tarnogsky District is above average (18.0‰). The provision of the population with doctors and hospital beds per 10 thousand people is above average there. However, the provision of houses with water in Cherepovetsky District and Kharovsky District, sewerage in Kharovsky District and central heating in Tarnogsky District area does not exceed the regional average. In this group in 2013 the wage rate amounted to 1.9–2.6 of the subsistence minimum value of the working age population (the regional average – 2.3 times).
The situation in Totemsky District, Ustyuzhensky District, Kirillovsky District and Babaevsky District is a little worse. As of year-end 2013 they had the level below average . The per capita volume of industrial and agricultural production (except for Ustyuzhensky District) and investment in fixed capital is lower than the regional average. In two municipal formations in this group the registered unemployment rate is above average: 1.8% in Kirillovsky District and 2.0% in Ustyuzhensky District. Three districts out of these four (except for Totemsky District) are characterized by a low level of amenities provision: the share of housing equipped with water supply, sewerage and central heating is less than 43%.
The group with the low level of socioeconomic development consisted of 12 districts (Ust-Kubinsky District, Mezhdurechensky District, Belozersky District, Nyuksensky District, Syamzhensky District, Vytegorsky District, Verkhovazhsky District, Nikolsky District, Vashkinsky District, Vozhegodsky District, Babushkinsky District, Kichmengsko-Gorodetsky District) in 2013. In these municipalities the per capita volume of industrial production does not exceed 23% of the index value, characteristic for the leading region. In ten districts the agricultural production and investment per person are also below average. In these areas the mortality rate is the highest (above 18.0‰); the provision of amenities and the per capita volume of paid services are low. The wage rate in all the districts (except for Nyuksensky and Vytegorsky) does not exceed 2.5 of the subsistence minimum value, indicating a low living standard.
It should be noted that the districts with low and below average levels of socioeconomic development have a number of problems. However, by some indicators, several municipal formations of these groups were among the leaders. For example, in 2013 Mezhdurechensky District ranged the 1st in terms of housing equipped with running water and Ust-Kubinsky District – 4th in terms of per capita investment, Nyuksensky District – the 1st by the wage rate and Verkhovazhsky District, Nikolsky District and Kichmengsko-Gorodetsky District areas – the 1st–3rd by the fertility rate.
To identify the spatial differentiation of development of the Vologda Oblast territories we have studied the radial dependence of the socio-economic development (the integral index value, calculated by the ISEDT RAS method; see fig. 2) on the distance from a district center to the city of Vologda (by the shortest route by road).
Thus, the average correlation index between the distance from district centers to Vologda and the 2000–2013 average integral index value is very insignificant (less than 0.4). There are districts with the high and above average level of development located at a considerable distance from the regional center (Velikoustyugsky District, Chagodoshensky District) and, on the contrary, there are districts with the low development level (Ust-Kubinsky District and Mezhdurechensky District) located at a short distance (less than 100 km). Though the general pattern is confirmed: the integral index value decreases if the district is located further from Vologda ( fig. 4 ). A similar study has been carried out, for example, in the Moscow Oblast [5], where this dependence is much higher.
Figure 5 presents the dependence of the slope of the integral index trend (a slope coefficient of the linear trend for each district for 2000–2013) on the distance to the regional center. It should be noted that the relationship between the dynamics of the integral index in the districts and the distance from the district center to Vologda is practically absent.
Thus, the used methodological approaches reveal roughly the same picture: the level of socio-economic development and life quality is above average in the territories, “tending” to the emerging agglomeration “Vologda – Cherepovets”. The trends of these areas development are positive.
The districts are characterized by a significant proportion of the region’s production, investment and immigration. Most peripheral areas of the region (except for Velikoustyugsky District) have a low level of development and low investment attractiveness. Thus, the development is hindered and the population’s migration to cities and more favorable districts is encouraged.
To sum it up, the typology of the Vologda Oblast municipal formations in terms of socio-economic development helps identify the problem areas and determine the reserves, which can improve the sustainability of municipalities’ development.
We believe that the districts with different level and potential of socio-economic development require differentiated measures of support from regional authorities.
It will give the opportunity to outline priorities clearly, use allocated funds more efficiently and take into account the development specifics of such areas.
Figure 4. Dependence of the level of socio-economic development of the Vologda Oblast districts on the distance to the regional center
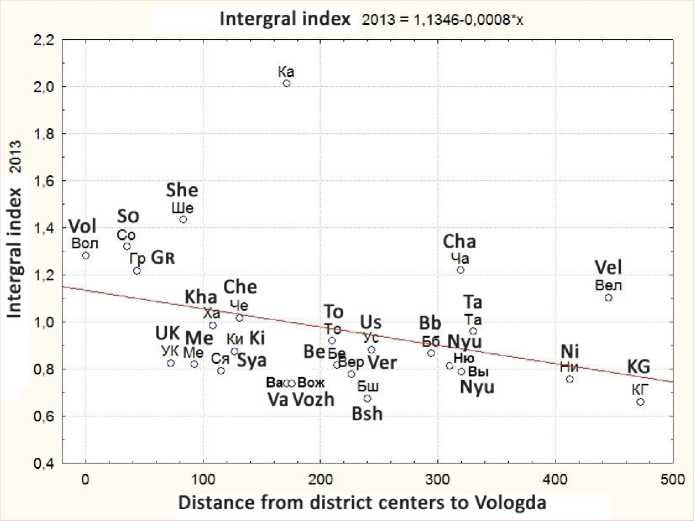
Note. Symbolic notations are given in table 4.
Figure 5. Dependence of the dynamics of the district centers’ development level on the distance to the regional center
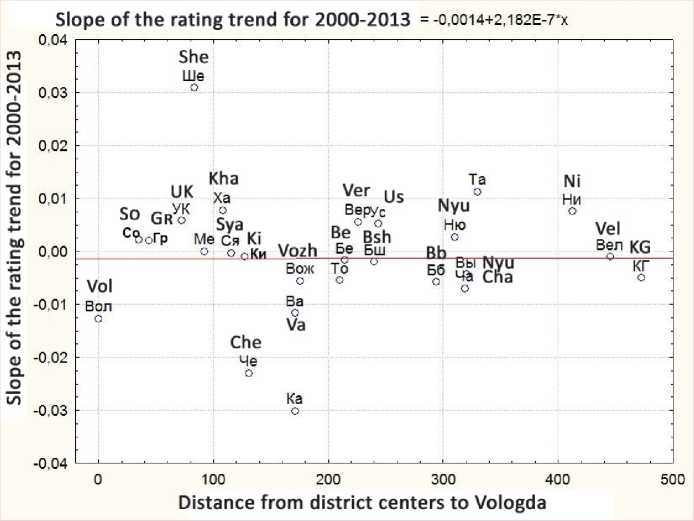
Table 5. Directions and tools of the state influence on the development of municipal formations
|
Е |
Е Е Е Я ГО § 15 го и и g ” га VI га g 2 Ц га Е £ га — ^ 2 8 § £ S’ S ш F Ё £ Ё га ГО з ” си z9 "го 'го 8 § 2 га "о 2 5= 8 СТ ГО го ^ о Е £ ° 8 |
° z в cd E ro ra ro ^ .2 2
ГО CD ГО о = = ° ст ^ "P о ra g1 ■= с с E □ T-’ (N co ^r о |
E Ё га E Я E 1 5 i I ~ CO C 5 ra ro cd 5 g E ~ ГО ra С О О ,22 . о CD 2 ё | 5га = .Е CD ш £ CD . Е о О я & 2 £ £ CD "8 Id О Е 8 g ё 5 f - 2 £ 8 8 ^ “ е ш а-^ .Е И Р $£ ст .Е о .2 ст га §■ 2 га ° X 2 о со о S ш о Н -Е cxj CO rar UD СО |
1 Е Е 3 со" .2 Ё "G Е о “ СТ р ■£ Ё 'Ё -Ё ^ Ё | 2 5-го У Ё 2 со о |
Е о § 'га Е _сл Ё Ё га 2 га го § 5 ""го ,2 ~ о га а га о СО О DC Ш СО 1— т— CN СО rar UO |
Ё Е Ё Ё га 9" го о
| g га 2 о £ > о "га u га га Ё ~ £ > о | га сл га -ь-i го га го 5 Г 5 5 = а 1 g" ° га Е го ^ 5 ^ ГО СП Ё i Ё го D_ ^ ^ГО со О т- cxi 'га со |
Е Ё 70 Е ГО ~ с Го го ” Ё Е Го ГО ~ tl ГО В- S Ё га га ■2 | Е - = § 8 “ i S 2 5 = У | ^ | § о S го — Ё 8 .Е г 8 го "га о п о Е го го Ё 'го ГОЛ .ГО CD СТ ГО ГО • — ^5 га ~ ~ ст Ё го го=-суГОаосУс>^ «2х£-2а„.-о^ оОАОСОшО=)СГШ Нт-схсбчгцоЕг^сдо) |
?2 Е Е су со Е Е Е о со |
|
Е | Ё о со |
< |
g ” га 1 го |
|||||
Table 5 presents the directions of support and tools for three groups of territories (this grouping simplifies the interpretation of its results).
The districts of the first group that have relative opportunities for self-development require mainly indirect support from the state authorities, while the areas of the third group require direct support and regulation.
In addition, it is advisable to elaborate specific tools and mechanisms aimed at the implementation of differentiated policy for the municipal formations development, the reduction of territorial differentiation and overcoming its consequences.
These issues will be discussed in further publications.
References Assessment of the level of socio-economic development in municipal formations of the Vologda oblast
- Voroshilov N.V. Teoreticheskie i prakticheskie aspekty otsenki urovnya sotsial’no-ekonomicheskogo razvitiya munitsipal’nykh obrazovanii . Molodye uchenye -ekonomike: sb. rabot molodezhnoi nauchnoi shkoly , 2014, no. 14, pp. 66-88.
- Voroshilov N.V., Gubanova E.S. Otsenka urovnya sotsial’no-ekonomicheskogo razvitiya regionov Rossii . Ekonomika i predprinimatel’stvo , 2013, no. 12 (part 3), pp. 325-332.
- Voroshilov N.V. Tendentsii i problemy razvitiya munitsipal’nykh raionov Vologodskoi oblasti . Voprosy territorial’nogo razvitiya , 2014, no. 1. Available at: http://vtr.isert-ran.ru/?module=Articles&action=view&aid=3489
- Gutnikova E.A., Chekavinskii A.N., Voroshilov N.V. Sotsial’no-ekonomicheskoe razvitie munitsipal’nykh raionov Vologodskoi oblasti v 2000-2010 godakh . Problemy razvitiya territorii , 2012, no. 5, pp. 23-34.
- Mitroshin A.A. Metody otsenki kachestva zhizni naseleniya i sotsial’no-ekonomicheskoi differentsiatsii territorii (na primere Moskovskoi oblasti): avtoref. dis. na soisk. uch. st. k.e.n.: 08.00.05 . Moscow, 2013. 23 p.
- Munitsipal’nye raiony i gorodskie okruga Vologodskoi oblasti. Sotsial’no-ekonomicheskie pokazateli. 2000-2013: stat. sb. . Vologdastat. Vologda, 2014. 324 p.
- O merakh po realizatsii Ukaza Prezidenta Rossiiskoi Federatsii “Ob otsenke effektivnosti deyatel’nosti organov mestnogo samoupravleniya gorodskikh okrugov i munitsipal’nykh raionov” ot 28 aprelya 2008 g. № 607 i podpunkta “i” punkta 2 Ukaza Prezidenta Rossiiskoi Federatsii “Ob osnovnykh napravleniyakh sovershenstvovaniya sistemy gosudarstvennogo upravleniya” ot 7 maya 2012 g. № 601: Postanovlenie Pravitel’stva RF ot 17.12.2012 № 1317 . Konsul’tantPlyus .
- O federal’noi tselevoi programme “Sokrashchenie razlichii v sotsial’no-ekonomicheskom razvitii regionov Rossiiskoi Federatsii (2002-2010 gody i do 2015 goda)”: postanovlenie Pravitel’stva RF ot 11 oktyabrya 2001 g. № 717 . Konsul’tantPlyus .
- Prostranstvennye aspekty razvitiya regiona . Under general editorship of Doctor of Economics, Professor V.A. Ilyin. Vologda: Vologodskii nauchno-koordinatsionnyi tsentr TsEMI RAN, 2008. 298 p.
- Raiony Vologodskoi oblasti v 1990-1999 godakh: stat. sbornik . Vologdastat. Vologda, 2001. 384 p.
- Raiony i goroda Vologodskoi oblasti. Sotsial’no-ekonomicheskie pokazateli. 2000-2010: stat. sbornik . Vologdastat. Vologda, 2011. 348 p.
- Uskova T.V., Voroshilov N.V., Gutnikova E.A., Kozhevnikov S.A. Sotsial’no-ekonomicheskie problemy lokal’nykh territorii: monografiya . Vologda: ISERT RAN, 2013. 196 p.
- Starodubrovskaya I.V., Mironova N.I. Problemy sel’skogo razvitiya v usloviyakh munitsipal’noi reformy v Rossii . Moscow: In-t Gaidara, 2010. 116 p.
- Uskova T.V. Upravlenie ustoichivym razvitiem regiona: monografiya . Vologda: ISERT RAN, 2009. 355 p.
