Assessment of the Potential for Solar Panel Implementation as Alternative Energy Sources in the City of Arkhangelsk

Author: Gromov A.A., Romanov K.A., Alekseev P.D., Maryandyshev P.A., Zhou W.
Journal: Arctic and North @arctic-and-north
Section: Social and economic development
Article in issue: 61, 2025.
Free access
The green economy is currently receiving considerable attention around the world. Alternative energy sources are replacing traditional ones and are increasingly supported by the government and investors. Large projects in the renewable energy sector are being implemented in the country and worldwide. In the northwestern part of Russia, the most well-known example of such a project is the Kola wind farm, which is the largest facility located above the Arctic Circle. Compared to other regions, the potential of this industry in the Arkhangelsk Oblast is relatively small, which has prompted local scientists and representatives of the region’s energy sector to identify ways to make the most effective use of alternative energy sources. Research and assessments of the effectiveness of implementing such energy generation methods as solar or wind power plants are constantly being carried out. This paper presents the results of a study of solar energy intensity in the central part of the city of Arkhangelsk using a solar power plant, analyses the dependence of electricity generation on external factors such as temperature and humidity, and provides data on average daily electricity generation. The economic efficiency of this experiment is calculated, and a conclusion is made about the effectiveness of using solar photovoltaic panels in the city of Arkhangelsk.
Arkhangelsk, green economy, solar photovoltaic panels, renewable energy, Arctic
Short address: https://sciup.org/148332684
IDR: 148332684 | UDC: 620.92(470.11)(045) | DOI: 10.37482/issn2221-2698.2025.61.27
Text of the scientific article Assessment of the Potential for Solar Panel Implementation as Alternative Energy Sources in the City of Arkhangelsk
DOI:
Throughout history, humanity has used and continues to use fossil fuels to provide various forms of energy. These types of fuel are the easiest to extract and use, but their continuous consumption over many years has gradually led to deterioration in the overall global environmental situation, as well as to a significant depletion of fossil fuel reserves. The most obvious way to influence both of the above threats is to introduce more alternative energy sources into the global energy supply system [1, Al-Okbi A., Vankov Y., Hussain H.M., p. 1; 2, Upadhyay S., Sharma M.P., pp. 48–50; 3, pp. 26–32]. One of such energy sources is solar energy.
Solar energy also has a number of quite significant disadvantages: low efficiency, dependence on weather conditions, and the complexity of conversion into other types of energy. This form of energy is becoming increasingly widespread due to one factor alone: the absence of any obvious impact on the environment and any emissions during the production of one of the simplest types of energy — electricity [4, Xinghui Z., Jiaojiao Y., Yi F. at al., p. 214; 5, Filippo P., Nelson S., Francesca L. at al., p. 4].
Solar photovoltaic panels are used to convert solar energy into electrical energy. Such panels have a significant advantage over other alternative energy sources — they can be used in various geographical locations and landscapes without reducing efficiency: in mountains, plains and forests, the efficiency of this energy source will be equivalent under equal conditions of solar activity [6, Oleynikov A.M., Kanov L.N., pp. 62–63]. The scale of their application is also wide: solar panels are used both in large power plants supplying entire regions, and in individual mode — they are installed in summer cottages, cottage settlements, industrial workshops and enterprises [7, Gloeckler M., Sankin I., Zhao Z., pp. 1390–1391; 8, Ali N., Hussain A., Ahmed R. at al., p. 727].
Taking into account the climatic features of the Arkhangelsk Oblast, the use of energy sources such as wind or solar can be considered on a small scale to provide electricity to individual households or enterprises [9, Yu L., Yixiang S., Ningsheng, pp. 43–44; 10, Pandey A., Tyagi V., Jeyraj A. at al., p. 862].
In order to correctly assess the potential of a specific area for solar energy production, many factors should be taken into account: solar activity and its variation by month and season, the landscape of the area, humidity in the region of use, and temperature conditions, which also affect the efficiency of solar panels. All of the above characteristics can be obtained using official meteorological sources, but the data from these sources is often exaggerated compared to the actual indicators in the study area.
The purpose of this study is to obtain and process data from a photovoltaic solar power plant (hereinafter referred to as SPP) installed on the university campus. Based on the data obtained, a conclusion is made about the efficiency of this solar panel when used as a source of electrical energy for one of the educational and laboratory buildings of the Northern (Arctic) Federal University named after M.V. Lomonosov (hereinafter referred to as NArFU).
Materials and methods
In order to determine the total solar radiation values for the coordinates 64°53′02″ north latitude and 40°55′17″ east longitude (location of the NArFU SPP), a DAVIS Instruments Vantage Pro 2 ground-based weather station (hereinafter referred to as the NArFU weather station) and a PCE-SPM 1 solar radiation detector (hereinafter referred to as the solar radiation detector) were used. Data on the level of electrical energy generation by the SB array depending on the amount of solar radiation were recorded in the NArFU SPP system.
The total solar radiation reaching the horizontal surface of the Earth was measured using a solar radiation sensor installed at a right angle to the Earth’s surface, as shown in Figure 1, which is part of the weather station shown in Figure 2. This weather station kit also includes: a weather station control unit, a temperature sensor, a relative humidity sensor, an atmospheric pressure sensor, a precipitation sensor, and an anemometer. The weather station measures atmospheric pressure, outdoor and indoor air temperature, outdoor and indoor relative humidity, wind speed and direction, dew point temperature, precipitation amount and intensity, date and time, weather forecast, moon phase, sunrise and sunset times.
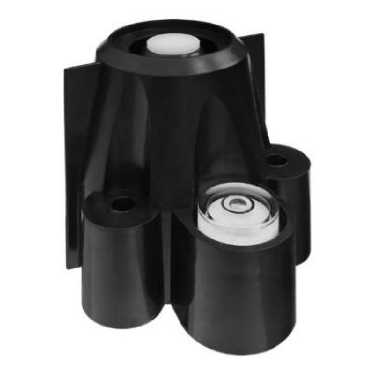
Fig. 1. Total solar radiation sensor.
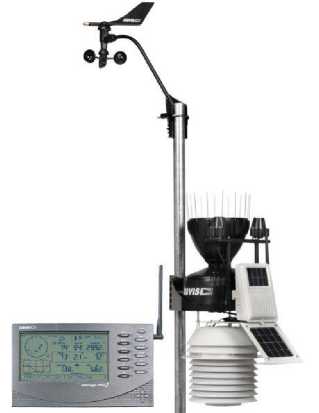
Fig. 2. DAVIS Instruments Vantage Pro 2 weather station with control unit.
The PCE-SPM 1 detector, shown in Fig. 3, was used to measure reflected solar radiation [11, Kafetzis A., Ziogou C., Panopoulos K.D. et al., p. 14; 12, Elmohlawy A.E., Ochkov V.F., Kazandzhan B.I., p. 3]. The detector recorded total solar radiation, including direct, diffuse, and reflected radiation. To assess the contribution of reflected radiation, additional measurements were taken at various sensor tilt angles (-90°, -45°, 0°, 45°, and 90°), which allowed for recording reflected radiation from various surface types, including snow cover and soil.
The data obtained showed that snow cover significantly increases the proportion of reflected radiation in the total radiation, which is especially relevant for high latitudes in spring. However, this research did not distinguish between the individual components (direct, diffuse, and reflected radiation), which is planned for future studies using appropriate models and analysis methods. Taking these factors into account will improve the accuracy of assessing the impact of reflected radiation on the performance of solar photovoltaic cells.

Fig. 3. PCE-SPM 1 solar radiation detector.
The SB array under study is part of the NArFU SPP. The SPP is integrated into the general power supply system of the laboratory building of the Department of Thermal Power Engineering and Heat Engineering. The power supply circuit is designed in such a way that the SPP can be completely disconnected from the laboratory’s power supply system for conducting research without loss of power to the load [13, Alramlawi M., Li P., p. 2025].
The developed circuit ensures the operation of the load devices in three configurations:
-
• the load is powered only by alternative energy sources;
-
• the load is powered only by the building’s switchgear;
-
• the load is powered by alternative energy sources with the possibility of supplementing the missing power from the grid.
The parameters studied by the SB were monitored and recorded using the Malina-2 software and hardware complex based on a microcomputer for remote monitoring of power grids and control of inverters, MPPT controllers and batteries. This software was used to record the main operating parameters of the solar power plant, in particular the power and current generated by the solar panels, the state of charge and voltage of the batteries, and the power consumption [14, Romanov K., p. 247].
The SPP configuration is presented in Table 1 [14, p. 246]. The main characteristics of the SPP are presented in Table 2 [14, p. 246]. The technical characteristics of the components are presented in Tables 3–6 [14, pp. 246–247]. Figure 4 shows the location of the weather station and the SPP components.
The solar photovoltaic cells were installed at an angle of 30° to the horizontal surface and oriented to the south (azimuth 0°). This choice was based on recommendations for maximum panel efficiency in northern latitudes.
Table 1
Configuration of the SPP
|
Name of component |
Number of pcs |
|
SB |
6 |
|
Inverter |
1 |
|
MPPT controller |
1 |
|
Battery |
8 |
Table 2
Main parameters of the SPP
|
Parameter |
Value |
|
Rated power |
1200 W |
|
Output voltage |
220 V |
|
Frequency |
50 Hz |
Table 3
Technical characteristics of the solar panel
|
Parameter |
Value |
|
Rated voltage |
24 V |
|
Rated power |
200 W |
|
Peak power |
30 V |
|
Open circuit voltage |
36,5 V |
|
Short-circuit current |
7.13 А |
|
Current on peak power |
6.67 А |
|
Maximum voltage in the system |
1000 V |
|
Connector |
MC4 |
|
Size (LхWхD) |
1326 x 990 x 35 mm |
|
Weight |
16 kg |
|
Operating temperature |
-40 to +85°С |
|
Rate of germination |
IP 65 |
|
Light transmittance of the glass |
97% |
|
Glass |
Tempered, with anti-glare coating |
|
Wind load |
to 60 m/s (200 kg per square meter) |
|
Photovoltaic conversion efficiency (COP) |
to 17.3% |
|
Photocell type |
polycrystalline |
Table 4
Technical characteristics of the battery
|
Parameter |
Value |
|
Battery model |
GST 12-100 SOLAR 12V 100 Ampere-hour |
|
Service life |
To 12 years |
|
Capacity |
100 Ampere-hour |
|
Electrolyte |
Sulphuric acid, condensed in gel |
Table 5
Technical characteristics of the inverter
|
Parameter |
Value |
|
Rated power |
6000 W |
|
COP |
93 % |
|
Battery voltage |
24 V |
|
Output voltage |
220 V |
|
Frequency |
50 Hz |
|
Peak power |
9000 W |
|
Maximum power |
6000 W |
|
Own consumption on idle |
9.6-14.4 W |
Table 6
Technical characteristics of the MPPT controller
|
Parameter |
Value |
|
Battery voltage |
12, 24, 36, 48, 96 V |
|
Maximum of charge current |
100 A |
|
Maximum power of solar panel |
12V – 1350 W, 24V – 2750 W, 48V – 5500 W, 96V – 1100 W |
|
Maximum voltage of solar panel |
185 V |
|
Standby power consumption |
to 1,9 W |
|
Maximum COP |
12 V - 95 %, 24 V - 96,5 % |
|
Type of battery |
Gelitic, lead-acid, alkaline |
|
Operating temperature |
-40 °C to 60 °C |
|
Humidity (non-condensing) |
95% |
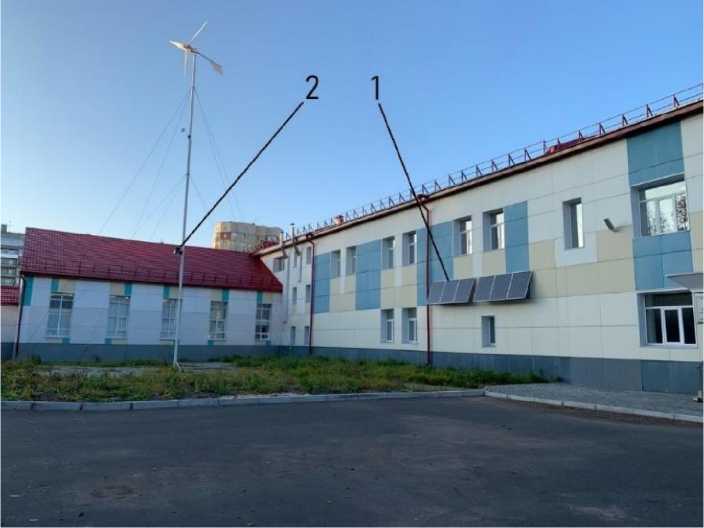
Fig. 4. Location of the SPP and weather station.
Total solar radiation has been measured since 2019 using a meteorological station installed perpendicular to the Earth’s surface. Measurements of radiation reflected from snow cover and total solar radiation using a solar radiation detector were carried out in specific cases to determine the instantaneous radiation value in the spring months.
Results and discussion
As a result of the study, data on solar activity, humidity, ambient temperature, and electricity generation were obtained and processed using a photovoltaic station installed on the university campus.
Information on the data obtained is shown in Figures 5–7. This study presents results acquired throughout 2023, excluding months where weather conditions affected measurement accuracy. The ice crust that formed during January, February, November, and December did not allow for maximum accuracy in data sensing. The experiment is currently ongoing.
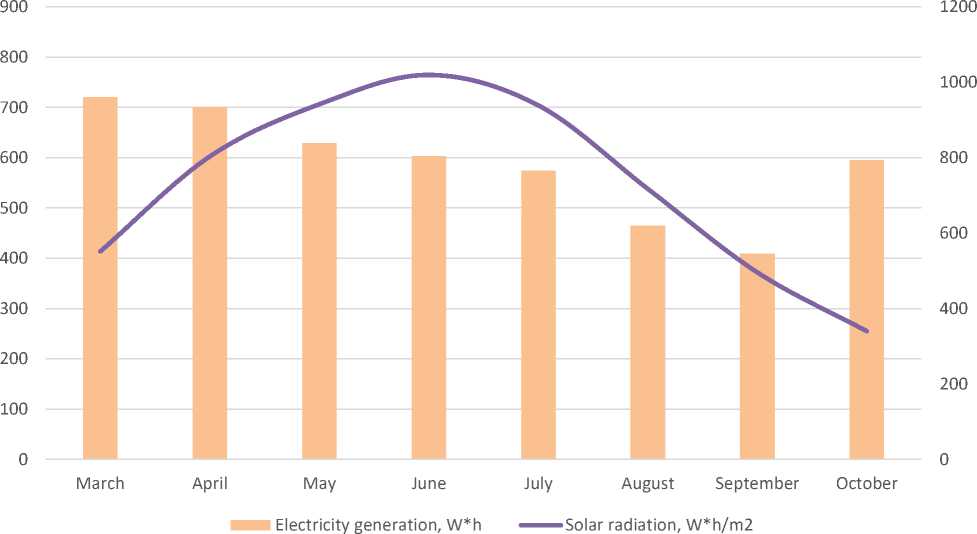
Fig. 5. Dependence of electricity generation on solar radiation during 2023.
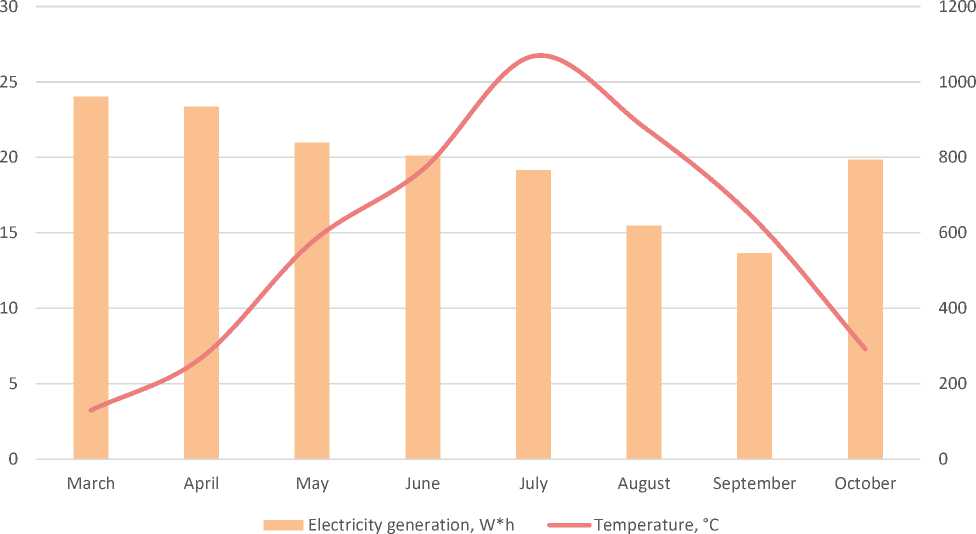
Fig. 6. Dependence of electricity generation on ambient temperature during 2023.
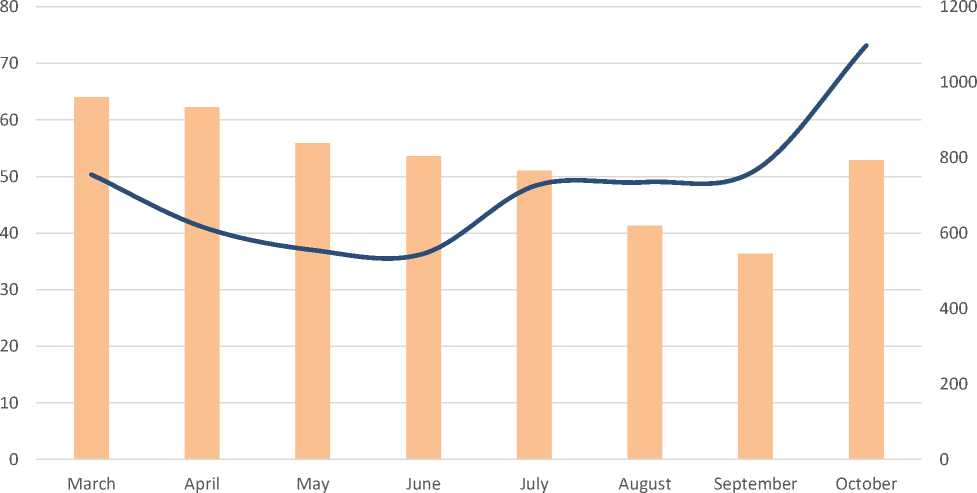
Electricity generation, W*h Humidity, %
Fig. 7. Dependence of electricity generation on humidity during 2023.
One of the important factors affecting the generation of electrical energy by solar photovoltaic cells is the temperature of the environment and of the modules themselves. To analyze the influence of temperature in the city of Arkhangelsk, an assessment was made of the dependence of energy production on the module temperature recorded during the experiment. According to the data obtained, an increase in module temperature led to a decrease in energy production, which corresponds to the known temperature coefficients of reduction in the efficiency of photovoltaic cells specified in the technical documentation. For example, in the temperature range from -7°C to +25°C, the decrease in energy production was up to 8% for every 10°C increase in temperature. This confirms the need to take temperature fluctuations into account when designing solar energy systems in regions with diverse climatic conditions. At the same time, humidity and solar activity affect electrical energy generation in direct ratio.
Analyzing the experimental results presented in Figures 5–7, it was noted that in the spring months, the amount of energy generated by the SPP exceeds similar values in the summer months, despite lower solar insolation. The two factors that influence efficient generation in the spring months are the ambient temperature and the zenith angle of the Sun. As part of the study, solar panels were installed at a fixed angle of 30° to the horizontal surface and pointed strictly south (azimuth 0°). This orientation was chosen to maximize energy generation efficiency in northern latitudes.
During the experiments, the influence of reflected solar radiation was identified, which was not taken into account in the regression models, but affects the operation of the photovoltaic cells.
Let us consider the operation of the SPP on selected spring and summer days. Tables 7–8 present the main data on the operation on April 7 and July 15, 2023.
Table 7
Experimental data on the operation of the SPP on April 7, 2023
|
Time |
SPP generation, W∙h |
Insolation, W∙h /m2 |
Temperature, °C |
Humidity, % |
Zenith angle, ° |
|
0:00 |
0 |
0 |
-4 |
46 |
90 |
|
1:00 |
0 |
0 |
-5 |
43 |
90 |
|
2:00 |
0 |
0 |
-5 |
44 |
90 |
|
3:00 |
0 |
0 |
-6 |
45 |
90 |
|
4:00 |
0 |
0 |
-7 |
47 |
90 |
|
5:00 |
1 |
8 |
-7 |
49 |
89 |
|
6:00 |
17 |
65 |
-7 |
49 |
83 |
|
7:00 |
47 |
178 |
-6 |
46 |
76 |
|
8:00 |
104 |
274 |
-4 |
43 |
70 |
|
9:00 |
347 |
432 |
-2 |
39 |
65 |
|
10:00 |
547 |
512 |
2 |
28 |
61 |
|
11:00 |
643 |
555 |
4 |
23 |
58 |
|
12:00 |
762 |
573 |
4 |
24 |
58 |
|
13:00 |
906 |
549 |
5 |
20 |
59 |
|
14:00 |
829 |
492 |
6 |
19 |
62 |
|
15:00 |
498 |
393 |
6 |
18 |
66 |
|
16:00 |
448 |
291 |
8 |
16 |
72 |
|
17:00 |
249 |
208 |
8 |
17 |
78 |
|
18:00 |
18 |
91 |
8 |
25 |
84 |
|
19:00 |
0 |
23 |
7 |
31 |
90 |
|
20:00 |
0 |
0 |
5 |
36 |
90 |
|
21:00 |
0 |
0 |
3 |
37 |
90 |
|
22:00 |
0 |
0 |
1 |
39 |
90 |
|
23:00 |
0 |
0 |
0 |
41 |
90 |
Table 8
Experimental data on the operation of the SPP on July 15, 2023
|
Time |
SPP generation, W-h |
Insolation, W-h /m 2 |
Temperature, °C |
Humidity, % |
Zenith angle, ° |
|
0:00 |
0 |
0 |
18 |
64 |
90 |
|
1:00 |
0 |
0 |
18 |
66 |
90 |
|
2:00 |
0 |
2 |
18 |
68 |
90 |
|
3:00 |
2 |
17 |
17 |
68 |
87 |
|
4:00 |
12 |
32 |
17 |
70 |
82 |
|
5:00 |
22 |
127 |
18 |
69 |
76 |
|
6:00 |
22 |
293 |
19 |
66 |
70 |
|
7:00 |
99 |
415 |
21 |
64 |
64 |
|
8:00 |
157 |
415 |
22 |
60 |
57 |
|
9:00 |
223 |
553 |
23 |
55 |
52 |
|
10:00 |
498 |
618 |
24 |
50 |
47 |
|
11:00 |
490 |
666 |
25 |
46 |
44 |
|
12:00 |
620 |
626 |
25 |
38 |
43 |
|
13:00 |
614 |
587 |
26 |
37 |
45 |
|
14:00 |
423 |
473 |
26 |
39 |
48 |
|
15:00 |
160 |
257 |
26 |
39 |
53 |
|
16:00 |
61 |
129 |
25 |
44 |
59 |
|
17:00 |
38 |
88 |
25 |
49 |
65 |
|
18:00 |
7 |
30 |
24 |
51 |
71 |
|
19:00 |
0 |
13 |
18 |
78 |
78 |
|
20:00 |
0 |
9 |
18 |
82 |
83 |
|
21:00 |
0 |
6 |
18 |
78 |
88 |
|
22:00 |
0 |
0 |
18 |
78 |
90 |
|
23:00 |
0 |
0 |
18 |
79 |
90 |
It should be noted that the results of the comparison of SPP operating modes presented in Tables 7 and 8 can be refined for different tilt angles and azimuths, as these parameters significantly affect the volume of incoming solar radiation.
Based on the data obtained on April 7, it can be established that the level of energy generation by the solar power plant was significantly higher than could be expected based on direct insolation alone. This effect is explained by the additional contribution of reflected solar radiation from the snow cover, which increases the total amount of energy reaching the surface of the solar panels. It has been established that in spring conditions, reflected radiation can account for a significant proportion of total solar radiation, which is confirmed by measurements at various panel tilt angles.
Figure 8 shows the SPP operating conditions on April 7. Snow cover located under the SB array is capable of reflecting solar radiation onto the surface of the photovoltaic cells. It is evident that on July 15, the main reflective surfaces were paving stones and grass, which have much lower reflection coefficients than snow cover. Reflected solar radiation was measured using a radiation sensor according to the diagram: figure 9 shows the tilt angles at which measurements were taken by the solar radiation detector. Reflected solar radiation was recorded at detector positions of -90° and -45°.
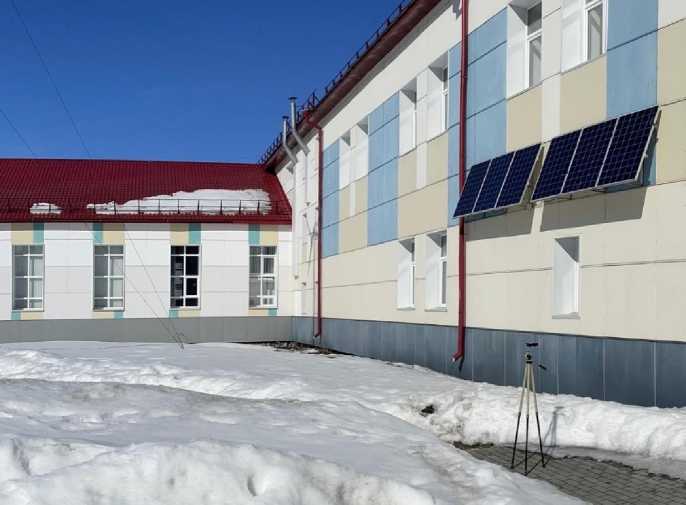
Fig. 8. Conditions for conducting the experiment on April 7, 2023.
-90° -45° 0° 45° 90°
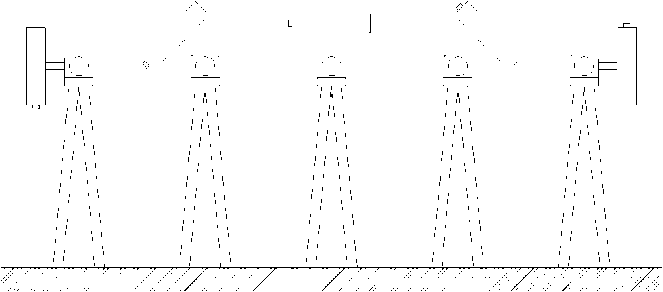
Fig. 9. Solar radiation measurement scheme.
The results of solar radiation measurements on April 7 and July 15 are presented in Tables 9 and 10.
Table 9
Results of solar radiation measurements on April 7, 2023
|
Time |
Solar radiation at different detector tilt angles, W/m2 |
||||
|
-90° |
-45° |
0° |
-45° |
90° |
|
|
11:50 |
294 |
455 |
1047 |
998 |
599 |
|
13:30 |
317 |
500 |
1098 |
951 |
604 |
|
15:56 |
227 |
385 |
802 |
770 |
324 |
Table 10
Results of solar radiation measurements on July 15, 2023
|
Time |
Solar radiation at different detector tilt angles, W/m2 |
||||
|
-90° |
-45° |
0° |
45° |
90° |
|
|
12:50 |
95 |
96 |
341 |
1046 |
654 |
The measurement results showed that during the snowy period, reflected solar radiation accounts for a significant portion of the total radiation recorded on the panel surfaces. For example, at tilt angles of -90° and -45°, the radiation level from the snow cover exceeds that values from the ground. This is explained by the high reflectivity of the snow surface.
However, the data were obtained on the basis of total radiation measurements, without distinguishing its individual components (direct, diffuse, and reflected). In order to accurately assess the contribution of reflected radiation and its exact impact on energy production, additional measurements are planned, taking into account the spatial orientation of the panels, weather conditions, and the spectral composition of the reflected radiation.
To increase the efficiency of photovoltaic stations operating in high latitudes by reflecting solar radiation, it is recommended to cascade SBs on structures closer to the ground surface, up to the permissible wind load values for the solar panel array area, at an angle to the Earth’s surface equal to the zenith angle of the Sun.
A technical and economic calculation was performed to assess the economic efficiency of the SPP. The cost of the equipment is shown in Table 11.
Table 11
Cost of the SPP equipment
|
Name of component |
Number of pcs |
Cost, rubles |
|
Polycrystalline SB, 200W, 24V |
6 |
73 200 |
|
Battery, 12V, 100Ah |
8 |
104 000 |
|
Solar MPPT controller |
1 |
40 900 |
|
Inverter 6 kW, 24V |
1 |
89 900 |
|
Total |
308 000 |
The cost of hiring specialists to install the equipment is estimated at 20% of the cost of the equipment being installed, which in this case amounts to 61,600 rubles.
To assess the economic efficiency of using a solar power plant in Arkhangelsk, data on average seasonal electricity generation was analyzed. The level of insolation in high latitudes varies depending on the season, so calculations of the average annual energy production were based on seasonal insolation data obtained during the experiment.
The average seasonal production was:
-
• Winter (December–February): 200 kWh;
-
• Spring (March–May): 1,200 kWh;
-
• Summer (June–August): 1,800 kWh;
-
• Autumn (September–November): 800 kWh.
The average monthly energy production was calculated for each season and then summed up to determine the annual value. This approach made it possible to take into account the difference in insolation levels characteristic of high latitudes, where daylight hours and solar activity are significantly lower in winter than in summer. The total annual output was 4,000 kWh, which corresponds to the data obtained during the experiment.
This value was used to calculate economic efficiency instead of the average value based on daily output. This approach allows for a more accurate assessment of the impact of seasonal changes in insolation on economic indicators.
Taking into account these data and the current electricity tariff (6 rubles 59 kopecks per 1 kWh), the annual savings will amount to 26,360 rubles. Calculations based on a 20-year system service life, rising electricity tariffs, and component replacement costs show that the system will pay for itself over its service life, providing savings of approximately 12% on electricity costs.
When calculating tariff rates and, accordingly, annual savings, it is necessary to take into account the discount rate, which is taken as the average annual growth in electricity tariffs for residents of Arkhangelsk (8%). The calculation is made using the formula [15, Kuryakova N., p. 73]:
FV = ^0=iPV-(1 + 0n (1), where FV — economic benefit from use during the calculation period, reduced to present value;
PV — economic benefit in the first year of service, 23,065 rubles;
n — calculation period, 20 years;
i — average annual increase in electricity tariffs in the Arkhangelsk Oblast, 8%.
The calculation shows that over 20 years of operation, the solar battery set will save 1,055,500 rubles.
According to equipment manufacturers, the average service life of batteries is 9 years, and the average service life of controllers and inverters is 14 years. Accordingly, the batteries will be replaced in the 9th and 18th years of operation, and the controller and inverter — in the 14th year of operation. We assume an inflation rate of 4%. Replacement costs are calculated using the formula [15, Kuryakova N., p. 73]:
З = За • (1 + i)9 + За ■ (1 + О18 + Зк/и • (1 + О14 (2), where За — batteries replacement costs, 104,000 rubles;
З к/и — controller and inverter replacement costs, 130,800 rubles;
i — inflation rate, 4%.
The overall economic efficiency of using solar batteries as a source of electrical energy [15, Kuryakova N., p. 73]:
Я = F7 - Зпр - З, (3), where FV— economic benefit from using solar batteries over the calculation period, reduced to present value, 1,055,500 rubles;
З пр — cost of purchasing a set of solar panels, 369,600 rubles;
З — total cost of replacing components, 585,212 rubles.
Calculations using the above method showed that 20 years of operation of the equipment used for the experiment will result in savings of 100,687 rubles. This amount is approximately 10% of the cost of electricity for the calculation period, adjusted for inflation.
Conclusion
As a result of the study of solar panel operating parameters under various weather conditions, a conclusion was made about the most effective months for using this installation. To increase the efficiency of the SPP in northern latitudes, further analysis of the spatial orientation of the panels and its impact on energy production is required. It is worth noting that the efficiency of SPPs is highest in snowy weather due to reflected solar radiation.
Based on the results of the experiment, an assessment of the economic efficiency of using SPP in Arkhangelsk was conducted, taking into account seasonal variations in solar insolation. Calculations showed that annual electricity generation is approximately 4,000 kWh, which takes into account differences in solar activity levels in winter, spring, summer and autumn. This approach provides a more accurate representation of the SPP’s efficiency in high-latitude conditions.
The economic benefit of using SPP over a 20-year operating period, taking into account the cost of replacing components and the increase in electricity tariffs, will be approximately 12% of the total electricity costs for the specified period.
Further research is planned using a more detailed accounting model, including the impact of cloud cover, panel tilt angle and other climatic factors in order to more accurately assess the efficiency of SPPs under various operating conditions.
