Assessment of the regional development strategy implementation

Author: Uskova Tamara Vitalevna, Selimenkov Roman Yurevich, Asanovich Valerii Yakovlevich
Journal: Economic and Social Changes: Facts, Trends, Forecast @volnc-esc-en
Section: Socio-economic development strategy
Article in issue: 1 (37) т.8, 2015.
Free access
The article considers the issue concerning the formation of an effective mechanism to implement the strategies for socio-economic development in the region. The authors focus on the imperfection of the regional strategic planning system. This problem has become critical in the time of the global financial and economic crisis at the end of 2008. The article indicates the importance of monitoring as a tool to assess the implementation of the strategy on the basis of analyzed consequences of the global financial crisis for the regional economy. The authors present their own approach to estimating the strategy implementation according to the dynamic normal method. The method presupposes that it is possible to carry out the assessment on the basis of comparison of the achieved level with the reference model (matrix of domination) of the economic system functioning. Testing of the authors’ method has helped assess the implementation of the strategy for the Vologda Oblast development at the tactical and strategic level and identify the main problems of socio-economic development.
Region, dynamic normal, matrix of domination, strategy, socio-economic development
Short address: https://sciup.org/147223698
IDR: 147223698 | UDC: 332.1(470.12) | DOI: 10.15838/esc/2015.1.37.2
Text of the scientific article Assessment of the regional development strategy implementation
In the regional management system strategic planning becomes the necessary tool not only to respond to the increasing speed of current economic and social changes and grown competition in all spheres of life, but also to create competitive advantages. Traditional planning is not able to cope with these challenges. The strategy’s priority over tactics is fully confirmed by the international practice. The sustainability of the regional socio-economic system and, as a consequence, the welfare of the populationб depends on set strategic objectives, used resources and consistent activities to achieve them. Therefore, in the conditions of unstable market environment, regional strategic planning is the key tool of public management and territorial development [14].
Nowadays in the Russian Federation the system of regional strategic planning is being formed within the new legislative framework: the Framework of strategic planning in the Russian Federation was approved in 2009 [13], the Federal Law “On strategic planning in the Russian Federation” – in 2014 [16].
The modern practice of regional strategic planning indicates positive trends in its use for solving socio-economic problems, especially in those regions that have taken the path of the forced crisis recovery and structural modernization of their regional economy.
At the same time, the analysis of the actual practice of regional strategic planning suggests that it is far from perfect. In the Russian regions, as the author stresses [9], the methodological schemes and methods are often outdated, do not take into account key differences between strategic and traditional long-term planning and specific features of regional systems as objects of strategic planning; strategic planning is not supported by real and effective strategic management; the effectiveness of strategies implementation is not monitored; the modern possibilities of information technologies are used inadequately, etc.
The lack of the effective monitoring system to assess the effectiveness of strategies implementation and take timely decisions ensuring qualitative changes in the situation and forecasting their consequences reduces the efficiency of the adopted strategies dramatically. This problem was particularly acute for the Russian economy during the 2008 global financial and economic crisis. Most regions of the RF Northwestern Federal District could not adjust the strategies to crisis conditions quickly that ultimately worsened the economic situation, aggravated investment activity and led to the decline in industrial and agricultural production [15].
The Vologda Oblast was not an exception. In 2009 due to the crisis the region experienced a significant decrease in the growth rate of physical volume of GDP and even in 2012 the pre-crisis growth rate was not achieved ( fig. 1 ).
This situation is partly caused by the monostructure of the industrial sector, which plays a significant role in the creation of gross regional product.
In the 2008 crisis in the region there was a significant decline in the volume of industrial production (95.3% of the previous year), in 2009 the situation deteriorated further (90.5%). The regional industrial production began to grow only in 2010, but in 2012 it had a downward trend again (tab. 1).
The similar situation was observed in the regional agriculture. At the same time, this crisis contributed to a general decline in the agricultural production of the region ( tab. 2 ).
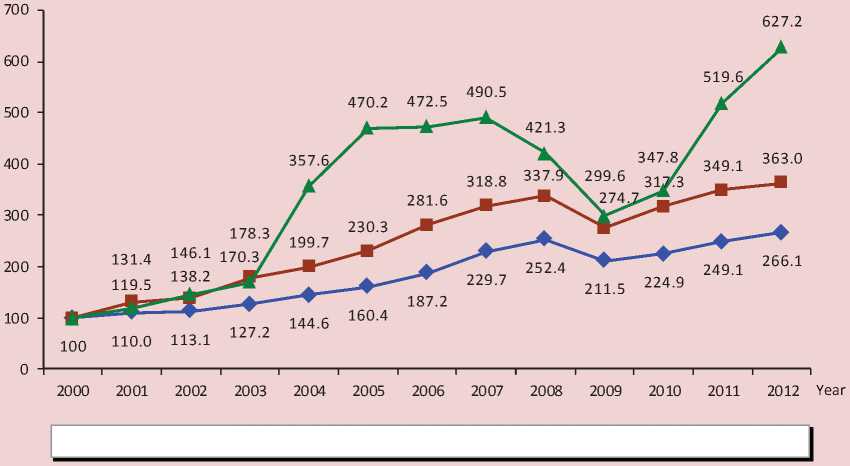
The crisis also affected the amount of investment in production. If in the precrisis period investment grew most rapidly in the Vologda Oblast compared to the Northwestern Federal District and the Russian Federation, in the crisis period its decline was also more significant in the region. The pre-crisis level of investment was recovered in 2011 ( fig. 2 ).
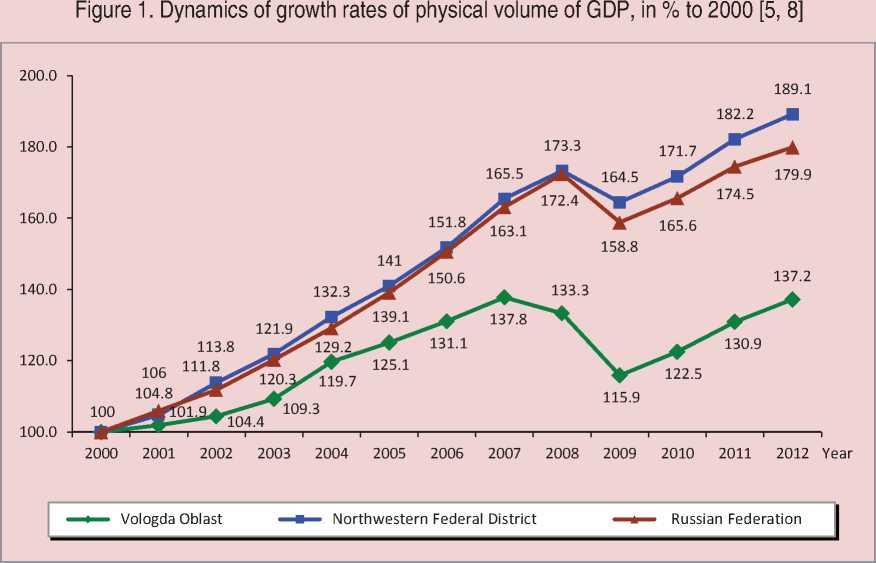
Table 1. Industrial production index in the NWFD regions in 2001–2012, in % to the previous year [5, 8]
|
Region |
2001 |
2005 |
2008 |
2009 |
2010 |
2011 |
2012 |
2012 to 2000, % |
|
Kaliningrad Oblast |
110.1 |
127.4 |
101.8 |
95.3 |
117 |
118 |
101.9 |
570.5 |
|
Leningrad Oblast |
104.78 |
108.1 |
101 |
96.9 |
113.8 |
106.2 |
105.7 |
335.8 |
|
Arkhangelsk Oblast |
98.85 |
117.3 |
105.5 |
115.4 |
102.1 |
82.1 |
95.1 |
254.8 |
|
Saint-Petersburg |
106.97 |
105.7 |
103.6 |
83.4 |
109.4 |
113.8 |
104.7 |
230.1 |
|
Novgorod oblast |
104.8 |
108.3 |
102.3 |
87.7 |
113.9 |
110 |
104.4 |
193.6 |
|
Pskov Oblast |
105.2 |
98.7 |
105.1 |
89.6 |
116.9 |
109.8 |
99.6 |
179.8 |
|
Komi Republic |
108 |
104.1 |
102.9 |
98.3 |
100.4 |
104.3 |
102.1 |
150.7 |
|
Vologda Oblast |
96.9 |
106.5 |
95.3 |
90.5 |
111.1 |
104.6 |
101.3 |
148.0 |
|
Republic of Karelia |
98.8 |
118.7 |
97 |
78.5 |
110.2 |
99.4 |
102 |
146.6 |
|
Murmansk Oblast |
101.1 |
100.2 |
94.6 |
96.5 |
105.2 |
98.7 |
102.7 |
108.1 |
|
NWFD |
103.7 |
108.5 |
100.6 |
92.6 |
108.4 |
105.5 |
102.6 |
210.4 |
Table 2. Agricultural production index in the NWFD regions in 2001–2012, in % to the previous year [5, 8]
|
Region |
2001 |
2005 |
2008 |
2009 |
2010 |
2011 |
2012 |
2012 to 2000, % |
|
Novgorod Oblast |
105.8 |
98.7 |
106.1 |
117.7 |
125.8 |
117.3 |
105 |
161.1 |
|
Leningrad Oblast |
104.4 |
102 |
101.8 |
104.5 |
102.6 |
108.8 |
108.1 |
135.2 |
|
Kaliningrad Oblast |
93.5 |
100.5 |
119.8 |
109.9 |
100.1 |
100.1 |
105.3 |
129.4 |
|
Komi Republic |
100.3 |
97.6 |
107.9 |
97.2 |
103.3 |
108.9 |
101.4 |
94.5 |
|
Murmansk Oblast |
95.5 |
105.5 |
103.5 |
100.7 |
97.7 |
101.8 |
99.9 |
88.3 |
|
Republic of Karelia |
111 |
97.7 |
104.9 |
96.2 |
99.2 |
99.8 |
94.4 |
79.5 |
|
Vologda Oblast |
102.3 |
100.3 |
100.5 |
97.6 |
92.5 |
110.6 |
95 |
75.7 |
|
Pskov Oblast |
98.1 |
86.9 |
98.7 |
101.9 |
100.8 |
105.3 |
105.8 |
69.3 |
|
Arkhangelsk Oblast |
94.9 |
93.6 |
96 |
105 |
97.8 |
107.9 |
100.9 |
65.2 |
|
NWFD |
101.4 |
98.7 |
103.8 |
104.2 |
101.9 |
108.3 |
103.9 |
106.2 |
It should be noted that the reduction of budgetary provision testifies the existence of economic problems in the Vologda Oblast. The crisis influencing the financial situation of the industrial enterprises “undermined” one of the main sources of budget revenues – profit tax.
Their amount decreased by more than 20%, and the region ranked 9th by the rate of budgetary provision among the regions of the Northwestern Federal District ( tab. 3 ). Since 2011 the region has been receiving subsidizes [10].
Obviously, in these circumstances the task of economy diversification, innovative development and creation of developed industrial and social infrastructure as a basis for economic growth and improved standard of life of the population become strategically important. Therefore, the implementation of the strategy for the region’s socioeconomic development should be focused on the concentration of investment resources according to the priority directions and identification of “growth points”, which will bring the greatest effect.
Figure 2. Index of physical volume of investment in fixed capital (in constant prices, in % to 2000) [5, 8]
|
— ♦ — Russian Federation |
||
|
— ■ — Northwe-stern Federal District |
—*— Vologda Oblast |
Table 3. Consolidated budget execution by revenue per capita (thousand rubles in current prices) [5, 10]
|
Region |
2000 |
2005 |
2008 |
2009 |
2010 |
2011 |
2012 |
2012 to 2000, times |
|
Saint Petersburg |
8.1 |
31.3 |
74.9 |
69.8 |
72.4 |
83.1 |
76.1 |
9.4 |
|
Murmansk Oblast |
9.9 |
24.9 |
45.8 |
47.7 |
55 |
64.4 |
75.8 |
7.7 |
|
Komi Republic |
6.8 |
19.9 |
55.9 |
55.4 |
65.4 |
71.2 |
67.7 |
10.0 |
|
Republic of Karelia |
4.8 |
17.4 |
42 |
40.5 |
51.4 |
53 |
56.5 |
11.8 |
|
Arkhangelsk Oblast |
4.7 |
16.7 |
33.7 |
36.9 |
36.4 |
44.4 |
55.1 |
11.7 |
|
Kaliningrad Oblast |
4.6 |
16.1 |
39.7 |
44.9 |
40.9 |
51.6 |
52.0 |
11.3 |
|
Leningrad Oblast |
7.1 |
25.6 |
39.3 |
37.5 |
49.4 |
55.8 |
51.9 |
7.3 |
|
Novgorod Oblast |
5.6 |
20.3 |
38.8 |
38.2 |
41.7 |
47.9 |
51.3 |
9.2 |
|
Vologda Oblast |
7.4 |
21.4 |
41.7 |
33.1 |
38.4 |
42.2 |
45.6 |
6.2 |
|
Pskov Oblast |
4.1 |
12.6 |
26 |
28.8 |
33.4 |
41.3 |
40.7 |
9.9 |
|
NWFD |
5.5 |
23.1 |
53 |
50.8 |
55.8 |
63.8 |
63.5 |
11.5 |
|
RF |
7.3 |
21 |
43.7 |
41.8 |
45.7 |
53.5 |
56.3 |
7.7 |
In this regard, the evaluation of strategy implementation is an important methodological task. In our opinion, the method of dynamic normals can be used for it.
The idea to build dynamic normals was first expressed in the works of Professor I.M. Syroezhin, particularly in the concept of measuring performance. I.M. Syroezhin used the idea to arrange indicators in order for the simulation of effective implementation and functioning of the system [12].
The mode of the economic system activity can be represented by a set of economic indicators. Ranking the indicators by growth rates, one can get such an order, which is able to express the requirements to the best activity mode and act as a reference. This order is called a dynamic normal.
The dynamic normal (DN) is a model reference mode of the economic system functioning. Obviously, the strategy for the system development can serve as a reference mode. Such a DN can be considered as strategic [12]. It is possible to compare any actual order of indicators with a standard, thereby assessing the level of the reference mode implementation (in particular, the level of system strategy implementation).
The integrated assessment of the strategy implementation level can be obtained on the basis of comparison of the normative order of indicators movement and the actual order by means of Spearman and Kendall’ rank correlation coefficients:
Spearman’s coefficient takes into account the differences in variance and is calculated by the formula (1).
R dev
6 - D S n x (n 2 — 1 )
where
Ds is a difference between actual and optimal ranks;
n is a number of indicators.
Kendal’s coefficient is calculated on the basis of inversion by the formula (2).
Rinv
■— — 1, n x (n — 1)
where
Rs is inversion of the S-th indicator.
The assessment of R varies in the range from 0 to 1. The coincidence of the actual and specified order of indices indicates the highest level of system strategy implementation, when all regulatory ratios of growth rates indicators are fulfilled and R = 1. The actual order of indicators, completely opposite to the reference one, gives the value of R equal to 0.
It should be noted that the quality of DN depends primarily on the composition of the indicators included. They should meet the following requirements:
– the list of indicators should reflect the comprehensive nature of the system’s activity;
– the indicators should be available in the current reporting and have a single observation period;
– the DN should include not secondary, but primary indicators;
– the number of indicators should be reasonable.
Table 4. Matrix of domination of strategy implementation in the region
|
Indicator |
1 |
2 |
3 |
4 |
5 |
6 |
7 |
8 |
9 |
10 |
|
1. GRP |
1 |
1 |
1 |
1 |
||||||
|
2. Personal income |
1 |
|||||||||
|
3. Budget revenues |
1 |
1 |
||||||||
|
4. Retail turnover |
-1 |
-1 |
||||||||
|
5. Industrial production |
-1 |
1 |
1 |
|||||||
|
6. Agricultural products |
-1 |
|||||||||
|
7. Investment |
-1 |
-1 |
-1 |
1 |
||||||
|
8. Population size |
-1 |
-1 |
1 |
|||||||
|
9. Natural resources (FER) |
-1 |
|||||||||
|
10. Number of unemployed |
-1 |
|||||||||
|
Source: developed by the authors on the basis of [12]. |
||||||||||
Having defined the list of indicators to include in the DN, we rank them on the basis of the indicators movement with the help of expert methods, or pairwise comparisons.
To present the DN we can use the preference graph or the corresponding matrix, with each element revealing the normative ratio of indicators. This matrix is called a matrix of preferences or matrix of domination:
In this case, the matrix elements define the normative dynamics of indicators pairs that reflect the level of implementation of the following regional development objectives. To identify the dynamics of the indicators we use basic chain growth rates (T):
T b = (x,/x) x 100%, (3)
where Tb is a basic growth rate of;
xi is a value of the indicator in the i-th period;
x0 is a value of the indicator in the base period.
T c = (X i /x -i ) x 100%, (4)
TC is a chain growth rate;
xi is a value of the indicator in the i-th period;
x is a value of the indicator in the i-1-st i-1
period.
This is caused by the fact that the choice of the “reference point” to estimate the dynamic structure of indicators affects the analysis results. The application of basic growth rates characterizes the monotony of the change in the function implementation level, which reveals stable patterns and trends of the regional strategy implementation process. These estimates correspond to the strategic level of analysis and diagnosis of regional development (tab. 5) .
The strategy implementation at the tactical level should be studied by means of chain growth rates, which help estimate the change in the strategy implementation level between two adjacent periods. The chain growth rates characterize the
Table 5. Normative dynamics of indicators and objectives of the regional development
Let us consider the sequence and results of the analysis of the Vologda Oblast regional strategy implementation in the post-crisis period. Table 6 shows the initial statistical information to be analyzed.
According to the obtained results, the effectiveness of the strategy implementation at the tactical level is determined by the average indicator of rank correlation coefficients. The fluctuations during the analyzed period are caused by the inversion of regional economy subsystems while solving tactical problems of socioeconomic development (tab. 7) .
The effectiveness of the strategy implementation at the strategic level is characterized by a vivid upward trend (tab. 8). Spearman’s rank correlation coefficient was 0.59 in 2012, which was higher by
0.98 points than 2009. The positive dynamics of the effectiveness of the strategy implementation suggests that the solution of tactical problems is aimed at achieving strategic goals of socio-economic development.
The analysis of the strategy implementation level discloses the positive and negative trends that have led to this assessment. Let us construct the matrix of domination of the strategy implementation (tab. 9) .
Comparing the actual order of the matrix with the normative one, we have identified the problems to implement the strategy for socio-economic development of the region (tab. 10).
Thus, taking into account the identified problems of socio-economic development of the region, we can single out strategic objectives of the Vologda Oblast development. In our opinion, economic
Table 6. Statistical values of the indicators included in the matrix of domination (on the materials of the Vologda Oblast) [5, 8, 10]
|
Indicator |
2008 |
2009 |
2010 |
2011 |
2012 |
2012 to 2008, % |
|
Total gross regional product, billion rubles |
294.9 |
213.4 |
262.4 |
323.1 |
356.1 |
120.7 |
|
Index of physical volume of GRP, in % to previous year |
96.7 |
87.1 |
105.7 |
106.9 |
104.8 |
103.1 |
|
Personal income, total, billion rubles |
178.6 |
177.9 |
204.1 |
225.2 |
262.2 |
146.8 |
|
Revenue side of the budget, billion rubles |
50.8 |
40.1 |
46.2 |
50.7 |
54.6 |
107.4 |
|
Population size, thousand people |
1214.0 |
1208.0 |
1201.0 |
1198.0 |
1196.0 |
98.5 |
|
Number of the unemployed registered with the employment service, thousand people |
12.6 |
24.6 |
16.0 |
11.6 |
9.5 |
75.4 |
|
Volume of industrial production in current prices, billion rubles |
397.2 |
259.9 |
349.8 |
428.0 |
419.6 |
105.6 |
|
Indices of industrial production, in % to previous year |
95.3 |
90.5 |
111.1 |
104.8 |
100.5 |
105.9 |
|
Agricultural production in households of all categories, billion rubles |
20.0 |
19.3 |
20.0 |
23.3 |
21.6 |
108.3 |
|
Indices of agricultural production, in % to previous year |
100.5 |
97.6 |
92.5 |
110.6 |
95.0 |
94.9 |
|
Investment in fixed capital in 2012 comparable prices, billion rubles |
100.9 |
72.1 |
83.7 |
125.1 |
151.0 |
149.7 |
|
Retail turnover in current prices, billion rubles |
70.8 |
69.6 |
85.5 |
100.0 |
125.7 |
177.4 |
|
Indices of retail trade turnover, in % to previous year |
108.5 |
89.4 |
116.3 |
107.6 |
119.7 |
133.9 |
|
Spent fuel and energy resources, billion cubic meters |
7736.7 |
7111.3 |
6252.9 |
6244.4 |
6217.2 |
80.4 |
Table 7. Dynamics of the indicators to evaluate the effectiveness of the regional strategy in the Vologda Oblast (tactical level)
|
Indicator |
2009 |
2010 |
2011 |
2012 |
||||
|
GR (chain) |
Rank |
GR (chain) |
Rank |
GR (chain) |
Rank |
GR (chain) |
Rank |
|
|
GRP |
87.1 |
8 |
105.7 |
6 |
106.9 |
6 |
104.8 |
5 |
|
Personal income |
99.6 |
2 |
114.7 |
4 |
110.3 |
3 |
116.5 |
3 |
|
Revenue part of the budget |
79.0 |
9 |
115.1 |
3 |
109.8 |
4 |
107.7 |
4 |
|
Retail turnover |
89.4 |
7 |
116.3 |
1 |
107.6 |
5 |
119.7 |
2 |
|
Volume of industrial production |
90.5 |
6 |
111.1 |
5 |
104.8 |
7 |
100.5 |
6 |
|
Production agriculture in households of all categories |
97.6 |
4 |
92.5 |
8 |
110.6 |
2 |
95 |
9 |
|
Investment in fixed capital |
71.5 |
10 |
116.1 |
2 |
149.4 |
1 |
120.7 |
1 |
|
Population size |
99.5 |
3 |
99.4 |
7 |
99.8 |
9 |
99.8 |
7 |
|
Use of fuel and energy resources |
91.9 |
5 |
87.9 |
9 |
99.9 |
8 |
99.6 |
8 |
|
Number of the unemployed |
195.2 |
1 |
65.0 |
10 |
72.5 |
10 |
81.9 |
10 |
|
R dev. |
-0.39 |
0.59 |
0.48 |
0.58 |
||||
|
R inv. |
-0.33 |
0.42 |
0.33 |
0.42 |
||||
Table 8. Dynamics of indicators to evaluate the effectiveness of the regional strategy in the Vologda Oblast (strategic level)
|
Indicator |
2009 |
2010 |
2011 |
2012 |
||||
|
GR (basic) |
Rank |
GR (basic) |
Rank |
GR (basic) |
Rank |
GR (basic) |
Rank |
|
|
GRP |
87.1 |
8 |
92.1 |
6 |
98.4 |
8 |
103.1 |
6 |
|
Personal income |
99.6 |
2 |
114.3 |
2 |
126.1 |
1 |
146.8 |
2 |
|
Revenue part of the budget |
79.0 |
9 |
90.9 |
7 |
99.7 |
6 |
107.4 |
4 |
|
Retail turnover |
89.4 |
7 |
104.0 |
3 |
111.9 |
3 |
133.9 |
3 |
|
Volume of industrial production |
90.5 |
6 |
100.5 |
4 |
105.4 |
4 |
105.9 |
5 |
|
Production agriculture in households of all categories |
97.6 |
4 |
90.3 |
8 |
99.8 |
5 |
94.9 |
8 |
|
Investment in fixed capital |
71.5 |
10 |
83.0 |
9 |
124.0 |
2 |
149.7 |
1 |
|
Population size |
99.5 |
3 |
98.9 |
5 |
98.7 |
7 |
98.5 |
7 |
|
Use of fuel and energy resources |
91.9 |
5 |
80.8 |
10 |
80.7 |
10 |
80.4 |
9 |
|
Number of the unemployed |
195.2 |
1 |
127.0 |
1 |
92.1 |
9 |
75.4 |
10 |
|
Rdev. |
-0.39 |
0.14 |
0.45 |
0.59 |
||||
|
Rinv. |
-0.33 |
0.20 |
0.33 |
0.47 |
||||
|
Source: compiled by the authors. |
||||||||
Table 9. Matrix of domination of the strategy implementation (strategic level)
|
Indicator |
1 |
2 |
3 |
4 |
5 |
6 |
7 |
8 |
9 |
10 |
|
1. GRP |
-1 |
1 |
-1 |
1 |
||||||
|
2. Personal income |
1 |
|||||||||
|
3. Budget revenues |
-1 |
-1 |
||||||||
|
4. Retail turnover |
-1 |
1 |
||||||||
|
5. Industrial production |
1 |
-1 |
1 |
|||||||
|
6. Agricultural production |
-1 |
|||||||||
|
7. Investment |
1 |
1 |
1 |
1 |
||||||
|
8. Population size |
-1 |
-1 |
1 |
|||||||
|
9. Natural resources (FER) |
-1 |
|||||||||
|
10. Number of the unemployed |
-1 |
Table 10. Analysis of the region’s development problems
|
Normative order of indicators |
Actual order of indicators |
Strategic issues |
|
T (gross regional product) > T (volume of industrial production) |
T (gross regional product) < T (volume of industrial production) |
Reduced industrial output of the region |
|
T (gross regional product) > T (investment) |
T (gross regional product) < T (investment) |
Decreased effectiveness of investment in the region’s economy |
|
T (budget revenues) > T (retail turnover) |
T (budget revenues) < T (retail turnover) |
Reduced social orientation of the regional budget |
|
T (budget revenues) > T (investment) |
T (budget revenues) < T (investment) |
Reduced investment yield in the region’s economy |
|
T (volume of industrial production) > T (investment) |
T (volume of industrial production) < T (investment) |
Decreased effectiveness of capital investment |
References Assessment of the regional development strategy implementation
- Analiticheskaya otsenka i prognozirovanie ekonomicheskoi i sotsial’noi effektivnosti regional’nogo razvitiya . Ekonomicheskii analiz: teoriya i praktika , 2006, no. 6 (63), pp. 22-27.
- Granberg A.G. Osnovy regional’noi ekonomiki . Moscow, 2004. 495 p.
- Grinberg A.S., Shestakov V.M. Informatsionnye tekhnologii modelirovaniya protsessov upravleniya ekonomikoi: ucheb. posobie dlya studentov vuzov . Moscow: YuNITI, 2003. 399 p.
- Kul’ba V.V., Kononov D.A., Kosyachenko S.A., Shubin A.V. Metody formirovaniya stsenariev razvitiya sotsial’no-ekonomicheskikh sistem . Moscow: SINTEG, 2004. 296 p.
- Ofitsial’nyi sait Federal’noi sluzhby gosudarstvennoi statistiki . Available at: http://www.gks.ru
- Prognozirovanie ekonomicheskogo potentsiala regionov . Ekonomika i matematicheskie metody , 2006, vol. 42, no.1, pp. 32-50.
- Regional’nye problemy razvitiya infrastruktury i mezhotraslevykh proizvodstv . Under editorship of L.V. Kozlovskaya. Minsk: Nauka i tekhnika, 1985. 246 p.
- Regiony Rossii. Sotsial’no-ekonomicheskie pokazateli. 2013: stat. sb. . Rosstat . Moscow, 2013, p. 990.
- Seliverstov V.E. Regional’noe strategicheskoe planirovanie: ot metodologii k praktike . Novosibirsk: IEOPP SO RAN, 2013. 436 p.
- Statisticheskii ezhegodnik Vologodskoi oblasti 2013: stat. sb. . Vologdastat . Vologda, 2013. 373 p.
- Sokolov D.V., Motyshina M.S. Strategiya regional’nogo razvitiya: formirovanie i upravlenie . Saint Petersburg: Izd-vo SPbGUEF, 2002. 153 p.
- Syroezhin I.M. Sovershenstvo sistemy pokazatelei effektivnosti i kachestva . Moscow: Ekonomika, 1980. 192 p.
- Ukaz prezidenta “Ob osnovakh strategicheskogo planirovaniya v RF” . Available at: http://lj.rossia.org/users/anticompromat/587675.html
- Uskova T. V. Upravlenie ustoichivym razvitiem regiona: monografiya . Vologda: ISERT RAN, 2009. 355 p.
- Uskova T.V., Selimenkov R.Yu. K voprosu o formirovanii institutov razvitiya v regione . Ekonomicheskie i sotsial’nye peremeny: fakty, tendentsii, prognoz , 2013, no. 2, p. 18.
- Federal’nyi zakon Rossiiskoi Federatsii “O strategicheskom planirovanii v Rossiiskoi Federatsii” ot 28 iyunya 2014 g. № 172-FZ . Available at: http://www.rg.ru/2014/07/03/strategia-dok.html
