Assessment of the regions' socio-economic development levels (in the case of the Komi Republic, the Arkhangelsk and Vologda oblasts)
")
Author: Lazhentsev Vitaliy Nikolaevich
Journal: Economic and Social Changes: Facts, Trends, Forecast @volnc-esc-en
Section: Branch-wise and regional economy
Article in issue: 6 (18) т.4, 2011.
Free access
The author made an attempt to enhance the reliability of indicators that reflect the regions' development levels and their analysis linkage with actual problems of socio-economic policy and spatial integration. In order to increase the objectivity of assessing the level of the regions' socio-economic development it is proposed to use indicator of value added per person employed taking into account the regional economy. The level of social development, according to the author, most aptly reflects the ratio of per capita income with the subsistence minimum. This, ultimately, will determine the vector of regional policy in the direction of social justice and sustainable development. The paper agreed the need for harmonization of the Russian Federation subjects and the formation of inter-regional programs of development of “transit” infrastructure “related” municipalities.
Spatial standards, economic dimensions, social stratification, consolidation of resources and concerted action
Short address: https://sciup.org/147223310
IDR: 147223310 | UDC: 338.984
Text of the scientific article Assessment of the regions' socio-economic development levels (in the case of the Komi Republic, the Arkhangelsk and Vologda oblasts)
Comparison of countries’ and regions’ development levels is a topic the history of which is as old as socio-economic geography, and government statistics. Prerequisites for comparisons were at first informative and analytical, then practical to regional policy and corporate strategies formation. These general grounds of comparison are now added with the following important issues:
-
• territorial scale search, appropriate for the requirements of sustainable development;
-
• creating a system of indicators that present the financial results and social progress reliably;
-
• the need to enhance spatial integration within Russia, including in the framework of emerging macro-and mesoeconomic structures.
If the organization of social ties and relationships is considered from the perspective of sustainable development of countries and regions, it is quite legitimate to ask the following question: what kind of territorial and economic system possesses the greatest stability? In our opinion, it is the one that matches (or nearly matches) the content of the standard (ideal) socio-economic area [3, 4, 6]. The Dvina-Pechora region is “nearly matching”, and therefore it is a supporting unit of macroeconomic zoning. I should note that regional policy of most states is based precisely in the areas not designed as administrative units [7]. In a region that is not endowed with the rights of administration, the problems of sustainable development are implemented through the joint efforts of the central (federal) and regional governments, municipalities and businesses within the scope of targeted programs, and general land use planning.
The second prerequisite to the actualization of assessing the state and levels of regional development is related to understanding the essence of statistics and bringing it into line with modern social and economic processes. Here it is appropriate to refer to the Report of the economic performance and social progress assessment Commission, founded on the initiative of French President Nicolas Sarkozy in 2008 [2]. Critical attitude to a number of economic indicators of production growth (including GDP) and a shift of emphasis on social aspects of life, noted in the report, cannot pass unnoticed by the Russian Statistics Service and Economic science.
The third position is actualizing the problems of internal Russian spatial integration; the solution is elevated to national security. Integration as the final stage of all other forms of social organization of the economy – concentration, specialization, combining and cooperation – is useful for practice in a consistent sequence of steps: first vertical link on the technological basis, then its horizontal adjustment on the basis of consolidation of the territories’ potential for the solution of common business problems, and further development and implementation of joint projects [6].
The Dvina-Pechora region as territorial and economic system
Territorial and economic system is the interconnection of two or more administrative centers on the use of shared natural and social resources. It may be systems of local, regional and interregional levels. The most complete alignment of the natural resource, settlement, infrastructure subsystems occurs within the major socio-economic regions, available as statistical and spatial planning (design) units without requiring the administrative clearance.
The specific of the North is that no real TES reaches here the level of basic socio-economic district (tab. 1) .
The differences in spatial norms between the standard and the northern TES are due to the fact that the North is characterized by focal-ity and dispersion of the production and population location, the exclusion of certain parts of the territory of the statutory conditions of life, their loss due to the lack of territorial capital from socio-economic relations and processes of regional development and inter-regional integration [1].
Table 1. Spatial norms of standard (1) and Northern (2) TES [6, 8]
|
Centers |
Availability radius, km |
TES territory, th. km 2 |
TES population, th. people |
|||
|
1 |
2 |
1 |
2 |
1 |
2 |
|
|
Local |
30-50 |
100-140 |
3-8 |
30-60 |
35-55 |
10-15 |
|
Basic |
80-100 |
200-250 |
20-30 |
125-200 |
400-600 |
200-350 |
|
Supporting |
250-300 |
700-800 |
200-300 |
1500-2000 |
4000-6000 |
1500-3000 |
Table 2. Territory, population and GRP volume of the Dvina-Pechora region
|
Administrative-territorial units |
Territory, th. km 2 |
Population thousand people* |
GRP, 2008, bln. rub.** |
|
The Komi Republic |
416.8 |
901.6 |
295.6 |
|
Arkhangelsk Oblast including Nenets AO |
589.9 176.8 |
1228.1 42.7 |
298.1 91.5 |
|
Vologda Oblast |
144.5 |
1202.3 |
298.1 |
|
Total |
1151.2 |
3332.0 |
891.8 |
|
Dvina-Pechora region’s share in Russia, % |
6.73 |
2.33 |
2.60 |
|
* Based on the Census. ** Here and in other tables the information is given according to the collection “Regions of Russia. Socio-economic indicators” 2010: stat. coll. / Rosstat. – M., 2010. – 996 p. In analyzing the dynamics of a living wage and some other indicators we used stat. coll. “Regions of Russia” of other years, since 2005. |
|||
Perhaps the only northern macro-regions approaching to the “standard” is the Dvina-Pechora region in the Komi Republic, the Arkhangelsk and Vologda oblasts (tab. 2) .
Relative to a standard economic region the Dvina-Pechora region has a territory approximately 4 times more, but the population is 2-fold less, and GDP is at the level of 80 – 90%. In the formation of the properties and qualities of its systemacy a special role is played by the rivers, boreal forests and the unity of timber resources bases, a unified system of fuel and energy, transit and distribution pipelines, road building: railway “Belkomur” (in the future “Barentskomur”), Syktyvkar road – Kotlas, Usinsk – Naryan-Mar, etc. We should also note the “historical memory” of Zavolochye, Biarmia, Pomorye, the Northern Territory.
Economic indicators
The Republic of Komi, the Arkhangelsk and Vologda oblasts in the system of the Dvina-Pechora region are estimated to be equivalent in economic potential, with their own strengths and weaknesses of the development. Their spatial integration under certain environmental conditions could serve as a significant factor in increasing the positive effects and smoothing the negative ones. External conditions in this case are the conditions in the framework of a common regional policy aimed at strengthening national security, creating a single market space, improving the quality of life, taking into account the natural features of places of residence, ethnic cultures and economic structures.
Regional policy requires, first of all, an objective assessment of socio-economic development levels. For this purpose the indicator of “domestic regional product” (GRP) is widely used which reflects the absolute and per capita relative amount of economic activity. For any other measurement it is necessary to use GRP adjusted to specific circumstances. For example, the dynamics is evaluated, usually on the basis of constant prices. However, if there is interest in elucidating the role of the price factor, the dynamics can be considered at current prices compared with constant prices.
In Russia, for the period of 2000 – 2008 at current prices, gross domestic product (GDP) grew 3.3 times greater than in the constant, indicating the prohibitively high inflation. In addition, economic growth is influenced significantly by structural changes in GDP (GRP) in the direction of services, most of all the financial and banking ones, including those not connected with real production and turnover. The guideline of the country’s political leadership for doubling GDP in ten years is nearly completed, but is also possible due to these shifts.
If it is necessary to highlight the differences in labor efficiency when evaluating the levels of socio-economic development of the country and its regions, it is reasonable to assume GRP per person employed in economic activity.
However, it is well known that its certain types are very much different in cost effect, as if putting the regions of various specializations in an unequal position in advance. Therefore, comparison of the regions will be more reliable and fair, taking into account these structural differences. This is done by determining the level of each economic activity and “weighing” this level share on the same activity in the total GRP (tab. 3 and 4) 1 .
As is shown in tables the structural component has a significant impact on the development level performance. Let us note the most significant points.
In the Komi Republic, one-third of value added is accounted for mineral extraction, which gives a positive effect in terms of employment, income2, tax, social development of labor collectives and territories. But in the Komi it (extraction) is not an increment to the average level of development, as in many other regions it has better results. Moreover, the decline of coal mining, oil and gas in the country is non-refundable by the equal amount of new mineral deposits development.
On the other hand, manufacturing activity has here a higher effect than the average in the country due to the pulp and paper industry, oil and gas processing. Syktyvkar, Ukhta and Sosnogorsk oil and gas processing plants after the reconstruction carried out in 2004 – 2009, occupied leading positions in their sectors of the economy. The Komi Republic has a relatively high position on the value added in construction. This is due to large capitalintensive core industries and transport, as well as the northern appreciation.The Arkhangelsk Oblast’s GDP per capita is slightly lower than the average for Russia, but significantly higher with the structure of its economy, mainly due to the development of new oil fields in the Nenets Autonomous District3. The Oblast has a high added value in construction for the same reasons as in the Komi Republic.
Differences in the assessment of economic development levels in different figures are vividly illustrated by the Vologda Oblast. Here, as opposed to the Komi Republic and the Arkhangelsk Oblast, agriculture has a performance level even slightly above the average.
The most significant addition is provided by manufacturing activity, which includes metallurgy and chemical industry I the city of Cherepovets, machinery and textiles in the city of Vologda, woodworking in Sokol and other places, as well as construction. The remaining industries show estimates lowering the Oblast’s position in the country’s economy.
The result of dividing the region’s share in Russia in added value in specific activity into a share of the region in terms of population is presented by localization coefficient : the number of times the region’s activity is represented more or less in comparison with Russia as a whole (figure) .
Table 3. Assessment of development levels of the Republic of Komi, the Arkhangelsk and Vologda oblasts on economic activities based on the measure of “value added per employee” with regard to economic structure, 2008, in % (Russia – 100%)
|
Types of activities |
The Komi Republic |
Arkhangelsk Oblast |
Vologda Oblast |
Dvina-Pechora Region in general |
||||||||
|
2? |
Е |
5 1 о Е о g ^ Ц -S ^ s 1 |
Е |
5 ® о Е о Ц ^ Ц ^ s 1 |
Е |
5 S о Е о 5 ^ s 1 |
е" |
Е |
5 S о Е о 1 ^ 5 ^ s 1 |
|||
|
Agriculture, timbering, fisheries and hunting |
2.2 |
0.68 |
1.496 |
3.7 |
0.90 |
3.33 |
5.4 |
1.09 |
5.886 |
3.8 |
0.92 |
3.496 |
|
Extraction of useful minerals |
31.9 |
0.94 |
29.986 |
20.7 |
2.20 |
45.54 |
17.5 |
1.19 |
20.825 |
|||
|
Processing production |
10.8 |
1.29 |
13.932 |
16.4 |
0.78 |
12.792 |
50.0 |
1.93 |
96.5 |
25.8 |
1.43 |
36.894 |
|
Production and electricity, gas and water distribution |
4.5 |
0.99 |
4.455 |
1.7 |
0.38 |
0.646 |
3.3 |
0.86 |
2.838 |
3.2 |
0.74 |
2.368 |
|
Construction |
7.8 |
1.80 |
14.04 |
9.6 |
2.26 |
21.696 |
6.5 |
1.59 |
10.335 |
8.0 |
1.89 |
15.12 |
|
Trade and repairs |
9.8 |
1.00 |
9.8 |
12.6 |
0.68 |
8.568 |
8.0 |
0.42 |
3.36 |
10.1 |
0.64 |
6.464 |
|
Hotels and restaurants |
0.4 |
0.71 |
0.284 |
0.8 |
0.80 |
0.64 |
0.5 |
0.46 |
0.23 |
0.6 |
0.64 |
0.384 |
|
Transport and communication |
9.6 |
0.87 |
8.352 |
13.4 |
0.97 |
12.998 |
9.8 |
0.90 |
8.82 |
11.0 |
0.92 |
10.12 |
|
Real estate transactions |
9.7 |
0.99 |
9.603 |
5.2 |
0.59 |
3.068 |
4.5 |
0.61 |
2.745 |
6.5 |
0.74 |
4.81 |
|
Education |
2.6 |
0.94 |
2.444 |
3.4 |
1.00 |
3.4 |
2.4 |
0.78 |
1.872 |
2.8 |
0.90 |
2.52 |
|
Health and Social Services |
3.5 |
1.05 |
3.675 |
4.4 |
0.99 |
4.356 |
3.8 |
0.98 |
3.724 |
3.9 |
1.00 |
3.9 |
|
Other services, including public utilities |
0.9 |
0.59 |
0.531 |
0.9 |
0.56 |
0.504 |
1.0 |
0.63 |
0.63 |
0.9 |
0.59 |
0.531 |
|
Other activities |
6.3 |
1.13 |
7.119 |
7.2 |
1.10 |
7.92 |
4.8 |
0.85 |
4.08 |
5.9 |
1.02 |
6.018 |
|
The overall level taking into account the economy structure |
100.0 |
- |
105.7 |
100.0 |
- |
125.5 |
100.0 |
- |
141.0 |
100.0 |
- |
113.5 |
* The level is multiplied by the «share» in the economy structure.
Table 4. Assessment of economic development levels in the Republic of Komi, the Arkhangelsk and Vologda oblasts in 2008, % (Russia – 100%)
|
Regions |
GRP per capita |
GRP per person employed in the economy |
GRP (value added) per employee, taking into account the economic structure |
|
Komi Republic |
127.5 |
124.0 |
105.7 |
|
Arkhangelsk Oblast |
97.7 |
96.0 |
125.5 |
|
Vologda Oblast |
101.2 |
98.3 |
141.0 |
|
Dvina-Pechora region as a whole |
107.2 |
104.7 |
113.5 |
The coefficient of economic activity localization relative to the the population (Russia 1.0)
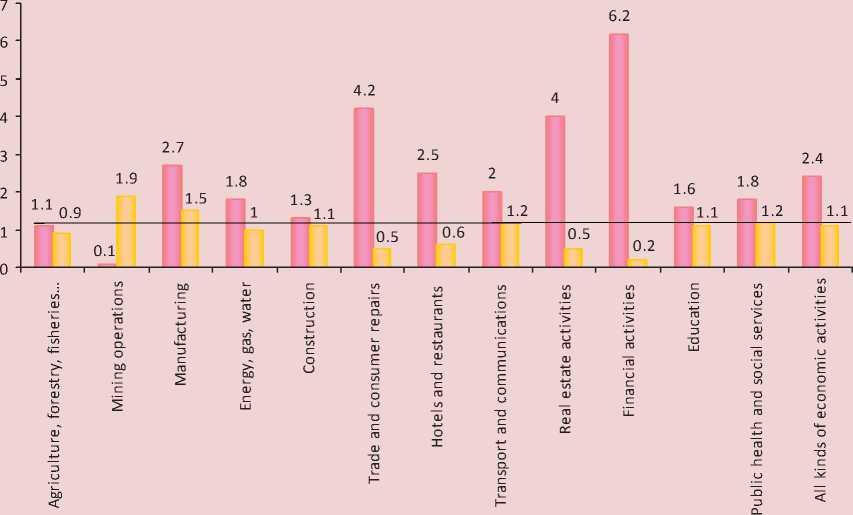
□ Moscow and the Moscow Oblast □ Dvina-Pechora region
Significant differences in the localization of material production rather faithfully reflect the specialization of regions. In the Dvina-Pechora region (total) it relates to mining, manufacturing, construction, transport and communications. European North is different from the Asian by a wide range of specialization sectors. But here, many local utility systems are single-industry that is fraught with danger of unemployment, especially in times of economic crisis4.
In the context of single-industry it is worth recalling the classical economic-geographical comparison of region with the image of twofaced Janus, one face of which is oriented to the external, the second is to the internal needs and interests. It is essential to develop the economy for the needs of the “own” population that smoothes out the disadvantages of narrow specialization, but with the corresponding potentials of neighboring cities and territories.
The coefficient of localization of education, health and social services in the Dvina-Pechora region as a whole, the Komi Republic and the Arkhangelsk Oblast is above unity. This can be evaluated positively, and explained by the presence of large university complexes and specialized medical centers in Arkhangelsk and Syktyvkar. However, one must bear in mind the explanation concerning the high cost of budget and paid services, partly caused by additional expenses on salaries in line with regional coefficients and experience allowances for the Far North and territories equated to them.
For comparison, we present the localization coefficients for Moscow and the Moscow Oblast, taken as a single region. The level of localization of all kinds of economic reality here is 2.4 times higher than the average for Russia. This is quite normal, especially for manufacturing industries (2.7), hotels and restaurants (2.5), education (1.6), health (1.8), but too much for trade (4.2), real estate activities (4.0) and financial activities (6.2). Out of the 1058 credit institutions registered in Russia at the beginning of 2010, 522 (49.3%) are located in Moscow, 42.7% of ruble deposits of legal entities and individuals are concentrated there, and 70% in foreign currency. Of course, it is natural that the capital region has high levels of concentration of market infrastructure. Negative in this case is the fact that this level is obtained mainly due to its underdevelopment in most other parts of the country. One of the basic principles of distribution of productive forces is not observed – it is national security, which applies to all economic activities, including finance and banking.
Social indicators
In the socio-economic development the social component is estimated multi-faceted: form the organization of jobs to the “economy of happiness”, from absolute poverty to almost complete well-being. At the same time every social stratum of the population understands happiness and prosperity of in their own way.
Without going into sociology, we will try to select those statistical indicators out numerous that most accurately characterize the social aspects of life from the perspective of assessing levels of regional development.
Among cash income such indicators include the average per capita amount and the correlation with the subsistence minimum (tab. 5) .
It is evident that high incomes do not always correspond to the same level of availability of money relative to the subsistence minimum level. It is the ratio of income and the minimum of subsistence that reflects the real situation in the regions’ social development. Only in the light of this fact can be seen on the dynamics of real income growth (tab. 6) .
Table 5. Average per capita income and the subsistence minimum in 2008 and 2009
|
Russia and regions |
Average monthly per capita income |
Subsistence minimum in IV quarter |
Ratio of income and subsistence minimum in IV quarter |
|||||||||
|
rubles |
% to Russia |
rubles |
% to Russia |
% |
% to Russia |
|||||||
|
2008 |
2009 |
2008 |
2009 |
2008 |
2009 |
2008 |
2009 |
2008 |
2009 |
2008 |
2009 |
|
|
Russia |
14941 |
16857 |
100.0 |
100.0 |
4693 |
5144 |
100.0 |
100.0 |
364.7 |
386.1 |
100.0 |
100.0 |
|
The Republic of Komi |
18636 |
20125 |
124.7 |
119.4 |
6198 |
6798 |
132.1 |
132.1 |
321.3 |
319.4 |
88.1 |
82.7 |
|
Arkhangelsk Oblast |
14824 |
17218 |
99.2 |
102.1 |
5661 |
6210 |
120.6 |
120.7 |
292.9 * |
301.7 * |
80.3 |
78.1 |
|
Vologda Oblast |
12193 |
12125 |
81.6 |
72.0 |
4851 |
5270 |
103.4 |
102.4 |
276.8 |
259.2 |
75.9 |
67.1 |
|
Dvina-Pechora region total |
14905 |
16169 |
99.8 |
95.9 |
5513 |
5801 |
117.5 |
112.8 |
294.8 |
291.2 |
80.8 |
75.4 |
* The statistics do not reflect the ratio of per capita income and the subsistence minimum in the IV quarter in to the Arkhangelsk oblast, so the ratio is shown to the value of gross wages and salaries.
Table 6. Population’s money incomes growth in real terms and their relation to the subsistence minimum, %
|
Russia and regions |
Growth of average per capita real earnings |
Growth of real income and subsistence minimum ratio |
||
|
2005 – 2009 |
2009 to 2008 |
IV quarter 2004 – IV quarter 2009 |
IV quarter 2008 – IV quarter 2009 |
|
|
Russia |
148.7 |
101.0 |
120.2 |
105.8 |
|
The Republic of Komi |
119.4 |
95.5 |
110.6 |
99.4 |
|
Arkhangelsk Oblast |
155.8 |
103.3 |
122.0 |
109.0 |
|
Vologda Oblast |
128.6 |
89.6 |
125.9 |
93.6 |
|
Dvina-Pechora region total |
136.2 |
102.7 |
120.2 |
100.9 |
The information in tables 5 and 6 represents the following.
-
• The cost of living wage increases faster than real incomes. This is because the price indexes taken into account per capita real income and the subsistence minimum encompass the set of goods different in size: in the first case it is quite wide, in the second it is relatively narrow and includes food, clothing and housing services. Essential commodities prices, especially in housing and communal services, are growing at a faster pace, but they determine the degree of material well-being of most of the population.
-
• In the ratio of real income and living wage northern regions yield many others that affect the outflow of the population.
Only to the Komi Republic yields in the dynamics of this ratio of the all-Russian relations among the three considered regions, its population has decreased quite substantially, from 1240 thousand in 1990 to 906 thousand in 2010.
The financial crisis had a negative impact on the provision of public money in the Republic of Komi and the Vologda Oblast whose leading enterprises are largely export oriented, the Arkhangelsk Oblast in this aspect of social development was more stable.
Distribution of total income by population groups reflects the degree of social stratification of society (tab. 7). In Russia it is excessive everywhere, especially in the regions with large capitalization of oil and gas resources, for example, in the Komi Republic and Nenets Autonomous Okrug. Science has claimed long ago that this situation does not match the image of a socially just state. However, the positive shifts in the direction of social justice in recent years are not observed, stratification in income even increased. But there is a positive trend: the proportion of people with incomes below the subsistence minimum in the total population has decreased over the period 2000-2009 in Russia from 29.0 to 13.2%, in the Komi Republic from 26.3 to 16.6, the Arkhangelsk Oblast from 33.5 to 14.0, including the NAO – from 37.9 to 7.3, the Vologda Oblast – from 28.5 to 18.4, in the Dvina-Pechora region in general from 28.7 to 16.1%. In principle, the specified percentage should be reduced to zero.
Imagine a desired state when:
-
• the coefficient of income inequality is no more than 10 times which the maximum permissible in terms of keeping social stability;
-
• a population group with the lowest incomes will have a per capita income not below the subsistence level;
-
• the ratio of per capita income and wage living in the compared regions is not lower than the average for Russia, except Moscow, which is about 333%.
Under given conditions and their projections on the situation in 2009 per capita income would have to make in a month: in the Komi Republic – 20.6 thousand rubles, the Arkhangelsk Oblast – 18.6, the Vologda Oblast – 16,0 thousand rubles. Deviation from the actual income is from 2 (Komi Republic) to 32% (Vologda Oblast).
It seems to us that the estimates presented in table 8 are a vector of regional policy in the direction of social justice and sustainable development. It is clear that it will not be possible by
Table 7. Distribution of total cash income for 20 percent population groups in 2005 – 2009
|
Russia and the regions |
Share of population groups, % |
||||
|
First (lowest-income) |
Second |
Third |
Fourth |
Fifth (highest-income) |
|
|
Russia |
5.5 – 5.1 |
10.2 – 9.8 |
15.2 – 14.8 |
22.7 – 22.5 |
46.4 – 47.8 |
|
The Republic of Komi |
5.0 – 5.0 |
9.6 – 9.8 |
14.7 – 14.7 |
22.5 – 22.5 |
48.2 – 48.1 |
|
Arkhangelsk Oblast |
6.5 – 5.9 |
11.3 – 10.8 |
16.1 – 15.6 |
23.0 – 22.9 |
43.1 – 44.8 |
|
including Nenets AO |
5.3 – 4.6 |
9.9 – 9.2 |
15.0 – 14.2 |
22.6 – 22.3 |
47.2 – 49.7 |
|
Vologda Oblast |
6.4 – 6.3 |
11.3 – 11.2 |
16.0 – 16.0 |
23.0 – 23.0 |
43.3 – 43.5 |
|
Dvina-Pechora region total |
6.1 – 5.8 |
10.8 – 10.6 |
15.7 – 15.5 |
23.0 – 22.8 |
44.5 – 45.3 |
Table 8. The distribution of cash income for 10 percent population groups, taking into account subsistence level in IV quarter 2009 and for a given (desired) conditions, thous. rub.
|
Regions |
5 |
Population groups |
Monthly per capita income |
|||||||||||
|
1 |
2 |
3 |
4 |
5 |
6 |
7 |
8 |
9 |
10 |
О |
CD О ^ |
ч- ™ g О О ° Ь У “ н-Г СС g О |
||
|
The Komi Republic |
6.8 |
7.0 |
8.2 |
10.3 |
12.6 |
13.4 |
16.5 |
20.6 |
24.7 |
31.0 |
62.0 |
20.6 |
20.1 |
1.02 |
|
Arkhangelsk Oblast |
6.2 |
6.5 |
7.6 |
10.8 |
12.1 |
13.2 |
15.8 |
17.7 |
22.3 |
26.0 |
54.0 |
18.6 |
17.2 |
1.08 |
|
Vologda Oblast |
5.3 |
5.5 |
6.4 |
9.5 |
10.7 |
12.0 |
13.6 |
16.2 |
19.4 |
22.1 |
44.8 |
16.0 |
12.1 |
1.32 |
|
Dvina-Pechora region total |
6.0 |
6.3 |
7.2 |
10.1 |
11.8 |
12.9 |
15.4 |
17.9 |
21.7 |
25.7 |
52.0 |
18.1 |
14.9 |
1.21 |
|
The share of population groups in the distribution of the total sum of incomes, % |
- |
3.4 3.5 |
4.0 4.1 |
5.0 5.9 |
6.1 6.7 |
6.5 7.5 |
8.0 8.5 |
9.5 10.1 |
12.0 12.1 |
13.8 15.0 |
28.0 30.0 |
- |
- |
- |
* The terms are marked in the text
Table 9. Indicators of social stratification: de facto in 2009 and calculated under given (desired) conditions
The proposed proportions in the distribution of the total real incomes hardly affect the interests of groups with middle and high income, although the social gap and the overall level of income concentration (the Gini coefficient) decreased significantly (tab. 9) . To implement the proposed decision it would be required (in the general list of these measures) to enhance the role of public social security funds, which many people associate with the introduction of a progressive tax scale. However, this political decision, for obvious reasons can be blocked. In this case the tax base should be differentiated by providing a separate payroll, property income, dividends, corporate bonuses and other sources, each having a significantly higher flat tax rate than the payroll tax.
Coordinated development
Improving the management of socioeconomic development depends largely on the coordinated initiatives of the Federation subjects, especially if they represent the interests of the people, united by common social and economic space, in our case the Dvina-Pechora region. At first, the regional governments should focus attention on the rationalization of intergovernmental relations, normalization of involvement of each region in the implementation of general federal programs and national projects, the formation of inter-regional development programs, “transit” infrastructure and “adjacent” regional and district municipalities.
Certain entities are interested in the coordinated development of the Vologda, Arkhangelsk Oblasts and the Komi Republic, in particular such as the Office of the Northern Railway (Yaroslavl), JSC “Belkomur” (Syktyvkar), Vologda forest management organization “Northern Branch of the National Forest Inventory of Federal State Unitary Enterprise “Roslesinfort”, Dvina-Pechora Basin Water Management of the Federal Water Resources Agency (Arkhangelsk), Arkhangelsk Center for Hydrometeorology and Environmental Monitoring, almost all oil, gas and exploration organizations working in the north of the Komi Republic and Nenets Autonomous District. A significant role in coordinating policies and programs of socio-economic development is given to regional governments and the “related” municipalities. However, we should note that this role is implemented sluggishly yet, limiting with cooperation agreements, without the creation of common investment institutions and holding large-scale economic activities.
A territory under the code name “ five corners ” could be considered as a long-term spatial integration object: south of the Arkhangelsk Oblast (Kotlas, Solvychegodsk, Koryazhma, Vychegda), south of the Komi Republic (Oby-achevo, Spasporub, Loyma, Letka), east of the Vologda Oblast (Veliky Ustyug, Kichmensky Gorodok, Nikolsk, Permas), north of the Kirov Oblast (Luza, Pinyug, Oparino, Murashi), east of the Kostroma Oblast (Vokhma, Pischug, Pavino). This should be the object of special territorial planning, regional projecting and program-oriented management. The problematic nature of these areas is beyond any doubt because in these very “corners” the poor condition of the periphery is particularly evident. Doubt arises only with respect to the integration desires and abilities of state and municipal government to implement them.
References Assessment of the regions' socio-economic development levels (in the case of the Komi Republic, the Arkhangelsk and Vologda oblasts)
- Dmitrieva, T.E. Methodological context of spatial development of the northern region/T.E. Dmitrieva//Economy of the Northwest. Problems and prospects. -2009. -№ 1 (39). -Pp. 22-29.
- Report of the Commission for economic performance and social progress assessment//Problems of Statistics. -2010. -№ 11. -Pp. 12-29; № 12. -Pp. 13-46.
- Zimin, B.N. Small advanced countries of Western Europe, the theoretical results of the study/B.N. Zimin//Proceedings of the Russian Academy of Sciences. -1993. -№ 2. -Pp. 95-104.
- Kolosovsky, N.N. Selected Works/N.N. Kolosovsky. -Smolensk: Oikumena, 2006. -336 p.
- Lazhentsev, V.N. Theory and practice of spatial integration of inter-regional cooperation/V.N. Lazhentsev//Horizons of economic and cultural development: Proceedings of the Plenary Session of the Second North socio-environmental Congress/chief editor V.A. Chereshnev. -M.: Nauka, 2007. -Pp. 64-68.
- Lazhentsev, V.N. The relationship of theory and practice (an example of the methodology of economic and geographical research)/V.N. Lazhentsev//Proceedings of the Komi Scientific Centre, UD of RAS. -2010. -№ 3. -Pp. 99-105.
- The Russian regions: the economic crisis and the problems of modernization/ed. by L.M. Grigoriev, N.V. Zubarevitch, G.R. Hasaeva. -M.: TEIS, 2011. -347 p.
- The northern city. -L.: Stroiizdat, 1984. -168 p.
