Assessment of the State of the Information and Communication Technology Sector in the Northern Regions of Russia Using Multidimensional Grouping

Author: Timushev E.N.
Journal: Arctic and North @arctic-and-north
Section: Social and economic development
Article in issue: 58, 2025.
Free access
The paper analyzes the state of the information and communication technologies (ICT) sector in the northern regions of Russia. The main research methods are multidimensional grouping and comparative analysis of ICT development. The relevance of the study is due to the lack of knowledge about the state of information and communication technologies in the northern regions of Russia. At the same time, ICT has a great potential to stimulate the economic development of the North of Russia and the Arctic in particular. The novelty of the work lies in the development of a methodological approach to the comparative analysis of the ICT sector in the Russian regions, aimed at identifying problem areas of development. An original set of indicators is created — criteria for the state of ICT at the regional level. The validity of this set is proved by the method of factor analysis. Multidimensional grouping of all subjects of the Russian Federation according to the selected indicators is performed with an emphasis on the northern regions. It is revealed that the northern regions have higher values of ICT indicators compared to other regions of Russia due to the social sphere and the state of ICT at the household level. The leaders are the Yamalo-Nenets Autonomous Okrug, the Khanty-Mansi Autonomous Okrug and the Republic of Karelia. Practical recommendations for ICT development in the northern regions are formulated. The main reserves of ICT development in the North are identified — growth of state and municipal services provision in electronic form and digitalization of health care institutions.
Clustering, information society, digital technologies, social infrastructure, interregional analysis
Short address: https://sciup.org/148330876
IDR: 148330876 | UDC: [330.3+332.05](985)(045) | DOI: 10.37482/issn2221-2698.2025.58.65
Text of the scientific article Assessment of the State of the Information and Communication Technology Sector in the Northern Regions of Russia Using Multidimensional Grouping
DOI:
The development of the ICT sector is given considerable attention at the federal level of government. This is largely due to the concern of government bodies about the low demand for ICT in terms of human capital development and the relatively small role it plays in the national economy as a whole. At the same time, the successful implementation of the whole set of measures is closely related to understanding the depth of interregional differences in ICT development in Russia and the degree of importance of this sector for the country’s socio-economic development.
In this paper, the study of the ICT sector within the framework of the analysis of individual indicators is focused on examining its state in the subjects of the Russian Federation that belong to the northern group. These are the territories that, in accordance with the current Resolution of the Government of the Russian Federation No. 1946 1, which replaced the previous Resolution of the Council of Ministers of the USSR No. 12, are classified as the Far North or equated to the North areas 2.
The ICT sector, gradually forming a full-fledged virtual (information) infrastructure, becomes part of the supporting production infrastructure, which ensures the transition to a new technological mode in the Arctic zone of Russia [6, Pilyasov A.N., Tsukerman V.A.]. This is accompanied by an increase in information flows, digitalization of production processes, creation of the supporting physical underwater and air telecommunications infrastructure. At the same time, the demographic situation in the North continues to deteriorate [7, Fauzer V.V., Smirnov A.V., Fauzer G.N.]. The ambiguity of the qualitative assessment of the development of the northern territories of Russia, along with their special climatic conditions and strategic importance, actualizes a comparative interregional analysis in the North.
The relevance of ICT development determined the purpose of the work, formulated in its initial form earlier [8, Timushev E.N.] — to determine the state and problems of the information and communication technology sector in the northern regions of Russia. The assessment is carried out in comparison with the average Russian indicators and within the northern regions themselves, identifying the leading regions and those ones that are still lagging behind in terms of certain indicators.
Quite a lot of studies have been devoted to assessing the level of digitalization and ICT development in the regions of Russia. An increasing number of works are focused on the analysis of digital traces of objects of interest, especially on the Internet. Modern works increasingly use research methods that rely on the use of modern data processing technologies (see, for example, [9, Kurilo A.E., Prokopyev E.A., Shkiperova G.T.; 10, Mikhailova A.A., Khvalei D.V.]). However, the analysis of scientific databases allows us to draw conclusions, also shown earlier (see [8, Timushev E.N.]), that a comparative assessment of the degree of ICT development among the northern regions of Russia, as well as an attempt to group them by the level of development specifically in the aspect of ICT development and with an emphasis on identifying the main problem areas, have not yet received sufficient attention in the literature. This paper is intended to supplement the theoretical and methodological base of ICT research in the northern regions of Russia, presenting an original methodological approach to comparative analysis aimed at identifying problem areas for development [11, Timushev E.N.]. This distinguishes this work from already published studies. L. Kuratova [12], for example, analyzes the process of digitalization of the economy and social sphere in the northern regions of the Russian Federation, thereby complementing the still small group of works on this topic. What this study and the cited work have in common is a fundamental approach to the problem of identifying emerging trends in the ICT sector in the North, as well as the coverage of statistical indicators. However, this work differs in the methodology of calculating the integral indicator and the set of primary data. In this paper, there is no explicit integral indicator (although it is calculated by software to determine the Euclidean distance and clusters) and a smaller number of indicators are used, but such indicators, which, in our opinion, cover the main aspects of ICT development in the region. This article differs from other works on a similar topic by comparative analysis of indicators not only for the northern regions, but also for Russia as a whole, i.e. taking into account the main federal problems. In addition, its peculiarity is the breadth of the objects of analysis (the number of regions), in contrast, for example, to the work of A.V. Kozlov [13], where only the Murmansk Oblast and the Yamalo-Nenets Autonomous Okrug are analyzed. But the main difference still lies in the composition of the analyzed indicators. For example, R.R. Sadyrtdinov [14] examines only the use of the Internet, software, and electronic data exchange.
A.V. Kozlov, A.B. Teslya, and A.A. Ivaschenko [15], in addition to the corporate and social spheres, also consider the external conditions for the development of ICT (for example, income level), but do not pay sufficient attention to ICT in public administration and at the household level. V.V. Kamneva and D.A. Baeva [16] also pay much attention to the external environment of the development of ICT and the availability of digital technologies, but almost do not touch upon the sphere of households. In this work, the ICT sector is presented in different aspects to ensure the comprehensiveness of its characteristics.
Research methodology
In order to conduct an interregional analysis of the ICT sector in the northern regions, as in [8, Timushev E.N.], multifactor cluster analysis (multidimensional grouping) is applied using the Euclidean distance method based on the selected indicators. The object of application of this method is a certain integral non-dimensional indicator that is not explicitly taken into account and is calculated as a conditional distance for all selected indicators, taking into account the proximity of the values of the indicator vector for each region. Calculations are performed using the R computing environment, version 4.0.4. As in [11, Timushev E.N.], built-in calculation packages are used, including the functions that calculate the Euclidean distance — "dist()" and divide objects into clusters — "hclust()". A standard package for plotting graphs — "plot()" is also used. Preliminary, a factor analysis of the indicators is carried out on the basis of the built-in calculation packages using the "factanal()" function. Statistical verification of sufficiency of groups of indicators is carried out.
The peculiarity of the approach is the primary assessment of the state of ICT in all regions of Russia, since relatively homogeneous groups are identified among all subjects of the Russian Federation, and the analysis continues exclusively for the regions of the North among the selected groups. Multidimensional grouping significantly simplifies and provides the necessary basis for conducting an analysis of ICT in each northern subject, helps to identify its strengths in terms of the development of the ICT sector and, conversely, the aspects of ICT in which it lags behind. It also allows for a reasonable grouping of regions based on a particular aspect of ICT development (at the level of households, corporations or public administration), and not on all indicators together. A similar method — multidimensional grouping — was used, for example, in the work [17, Mikheykina L.A.] when analyzing the level of training and attracting personnel in the information technology sector in Russia. For purposes similar to those of this paper, clustering is also used in the works of Yu.N. Solovieva and G.F. Feigin [18] and Yu.A. Kuznetsov et al. [19]. At the same time, the clustering results critically depend on the selected indicators, and the indicators used in the presented study differ significantly from those used previously. Thus, Yu. N. Solovieva and G. F. Feigin used the following indicators: the share of regions in investments in the ICT sector, the amount of investment in the ICT sector per capita and the share of people employed in ICT in the population. In turn, Yu. A. Kuznetsov and co-authors used such indicators as the use of computers and the Internet, the use of a website and electronic document management in organizations and ICT costs, respectively.
The originality of the work lies in the fact that the grouping/clustering method is used for a small set of collected informative indicators and in two stages: for all regions of Russia and then only for the northern regions [20, Timushev E. N.]. Without analysis for all regions of Russia, but only, for example, for the northern regions, a different result is obtained than in the case of clustering involving all regions of Russia. As far as we know, works on the northern topics are usually limited to the analysis of data from only a few regions and do not use all-Russian data. In [8, Ti-mushev E.N.] it is emphasized that this is the methodological idea, that clustering is carried out with the participation of all regions, from which the regions of the North are then compared separately as being included into different groups. In this respect, the presented work is similar to the work of V.V. Stepanova and co-authors [21] — one of the best on this topic with a review of foreign methods and the creation of its own, and based on an original system of indicators that comprehensively characterizes the development of ICT. But, unlike the cited work, this work, after analyzing all regions, focuses on identifying problem areas of ICT development exclusively in the regions of the North.
A number of auxiliary indicators are used to explain the quantitative values of the indicators and the relationships found, as well as to conduct a comparative analysis. The share of non-federal transfers in the budget revenues of the subject serves as an indicator of financial capabilities, fiscal capacity, and subsidization of the regional budget and, at the same time, the presence of incentives for state authorities of the subjects. For a quantitative assessment of the spatial distribution of the population and settlements in the regions, coefficients calculated by the Ministry of Finance of Russia within the framework of the distribution of federal equalizing transfers are used 3: settlement and transport accessibility coefficients. The settlement coefficient depends on the proportion of the population living in settlements with a population of up to 500 people. The transport accessibility coefficient depends on the density of railways and paved roads, the share of settlements that do not have a connection via paved roads and are not provided with a connection to the nearest station, sea or river port, airport, as well as the proportion of the population living in areas with limited delivery times for goods and in mountainous areas. Rosstat data on the level of urbanization is also used — the share of the urban population in the total population according to data for 2022.
Principles and procedure for data selection
For the purposes of this study, the Rosstat database “Monitoring of information society development in the Russian Federation” is of interest 4. It is quite in-depth, although in general the problem of information support for the development of ICT, especially at the level of municipalities, is acute [22, Voroshilov N.V.].
The choice of the indicators presented in this study is subjective, but at the same time it is conditioned by the contribution of the phenomena reflected by them to the overall socioeconomic development (Table 1) [11, Timushev E.N.]. Thus, the use of computers and the Internet in organizations reduces transaction costs, which has a positive effect on labor productivity. In households, in turn, the use of computers and access to the World Wide Web increase the availability of education and allow spending leisure time in a useful and diverse way. Despite the fact that there are certain risks associated with some digital content, the use of ICT achievements is extremely important for the accumulation of human capital. Due to the rapid development of specialized portals (marketplaces), delivery services and the overall growth of digital content consumption, household computerization contributes to the development of retail trade. Finally, the state of human capital depends on the development of communications with government agencies and the amount of costs in the social sphere.
Table 1
Indicators 5
|
Indicator |
с О с |
Е Е с 2 |
CD ею го ф < |
Е Е 'х га 2 |
ч- ° (U ° ^ ^ С с ™ о “ — ГО о Z £ ^ ГО го |
|
Corporate sector |
|||||
|
Share of organizations using personal computers, % |
corp_1 |
48.7 |
90.5 |
100.0 |
8 |
|
Share of organizations using Internet access, % |
corp_2 |
29.0 |
79.1 |
97.7 |
13 |
|
Number of personal computers with Internet access, units/100 people |
corp_3 |
14.0 |
31.9 |
77.0 |
22 |
|
Share of organizations using electronic document management systems, % |
corp_4 |
5.8 |
65.6 |
99.1 |
14 |
|
Households |
|||||
|
Share of households with a personal computer, % |
house_1 |
18.9 |
69.9 |
96.5 |
12 |
|
Share of households with access to the Internet, % |
house_2 |
52.2 |
75.5 |
98.5 |
11 |
|
Share of households using the Internet every day or almost every day, % |
house_3 |
29.3 |
64.2 |
94.9 |
19 |
|
Public administration (public sphere) |
|||||
|
Share of state authorities and local governments using fixed (wired and wireless) Internet, % |
public_1 |
65.6 |
93.5 |
100.0 |
6 |
|
Share of population aged 15–72 years using the |
public_2 |
1.8 |
58.3 |
97.5 |
39 |
4 Information society. URL: (accessed 20 April 2023).
5 Source: Rosstat. Note: in [8, Timushev E.N.] a similar set of indicators was described.
|
Internet to receive state and municipal services in electronic form, % of the population receiving state and municipal services |
|||||
|
Social sphere |
|||||
|
Number of computers used for educational purposes in general education institutions, units/100 students |
social_1 |
3.0 |
14.4 |
83.0 |
54 |
|
Share of healthcare institutions using the Internet, % |
social_2 |
56.4 |
96.5 |
100.0 |
5 |
|
Volume of the library’s electronic catalog available on the Internet, units/thousand people |
social_3 |
0.0 |
1.3 |
34.3 |
126 |
|
Share of the number of computerized places with access to the library’s electronic resources, % |
social_4 |
0.0 |
9.4 |
41.7 |
69 |
|
Number of museum items included in the electronic catalog, units/thousand people |
social_5 |
0.0 |
0.3 |
2.0 |
124 |
For the purpose of the work, a summary analytical table was created containing data for each region for 2014-2021 [8, Timushev E.N.]. The exceptions were the indicators “corp_4” and “social_4” in Table 1 — data for them are available only for 2014-2019 and 2015-2021, respectively. Table 1 presents their quantitative characteristics in the form of descriptive statistics.
Based on the results of the correlation analysis, “corp_2” — the share of organizations using the Internet, and “house_2” — the share of households with access to the Internet were excluded from further work. These indicators had the highest correlation with others within their group. After the above-mentioned adjustment of the composition, the strongest paired linear relationship acceptable for the purposes of further analysis remained between “corp_1” and “corp_4” (the correlation coefficient is +0.62).
In general, the choice of indicators is determined by two principles: minimizing their number and reflecting the main aspects of information and communication technologies. Since more than a hundred indicators are available for both groups in “Monitoring of information society development...”, the choice of individual indicators for subsequent analysis ensures not only the “debatability” of the selection made, but also the originality of this study.
Results and discussion
The implementation of factor analysis allows identifying homogeneous groups of indicators. The results show that a total of four groups of (artificial) indicators can be distinguished from the twelve considered ones (Table 2). Together, they explain more than 58.1% of the total variation in the values of the twelve indicators.
First of all, the indicators of computer equipment with Internet access among employees (“corp_3”) and in social institutions — culture (“social_3”, “social_5”) and vocational education (“social_4”) — have a similar variation. They cover the largest share of variability (16.6%). The indicators of the share of organizations that use computers and electronic document management (“corp_1” and “corp_4”), and the share of government bodies that use the Internet (“public_1”) (16.1%); the share of households that have computers and use the Internet (“house_1” and
“house_3”), and the degree of equipment of general education with personal computers (“so-cial_1”) (15.0%) are close in the distribution of values among Russian regions. The share of the population that uses the Internet to receive services in electronic form (“public_2”) stands out, which explains 10.3% of the total variation.
Thus, the factor analysis made it possible to determine the interrelated indicators.
Table 2
Results of factor analysis 6
|
Indicator |
Factor 1 |
Factor 2 |
Factor 3 |
Factor 4 |
|
corp_3 |
0.61 * |
0.23 |
||
|
social_3 |
0.73 * |
0.14 |
-0.14 |
|
|
social_4 |
0.59 * |
0.10 |
0.26 |
0.25 |
|
social_5 |
0.59 * |
0.22 |
0.27 |
-0.14 |
|
corp_1 |
0.94 * |
-0.11 |
||
|
corp_4 |
0.75 * |
-0.13 |
0.23 |
|
|
public_1 |
0.31 |
0.56 * |
||
|
house_1 |
0.39 |
0.11 |
0.69 * |
0.15 |
|
house_3 |
0.30 |
0.76 * |
||
|
social_1 |
0.11 |
0.13 |
0.63 * |
0.18 |
|
public_2 |
0.14 |
0.15 |
0.97 * |
|
|
social_2 |
0.23 |
-0.40 |
0.12 |
|
|
Share of the factor in the total variation of indicators |
16.6% |
16.1% |
15.0% |
10.3% |
|
Accumulated proportion of variation |
16.6% |
32.7% |
47.7% |
58.1% |
Multifactor cluster analysis for indicators characterizing the ICT sector (see Table 1) allows grouping regions of Russia on the basis of the integral value of their deviations from the average value for each indicator, taking into account the proximity of individual values of indicators in regions. In this paper, the Euclidean distance between indicators is calculated (Fig. 1). Let us explain this figure. The numbers on the vertical axis are data on the Euclidean distance between indicators for each region. They denote the units of distance between regions by the selected features, while the mutual arrangement of regions on the dendrogram depends on the similarity of the vector of values for the corresponding indicators (see Table 1). In multidimensional grouping, the square root of the sum of squared differences is calculated to assess proximity, and the resulting value is the Euclidean distance.
-
6 Source: author’s calculations. Note: * — the most influential indicators of the corresponding factor.
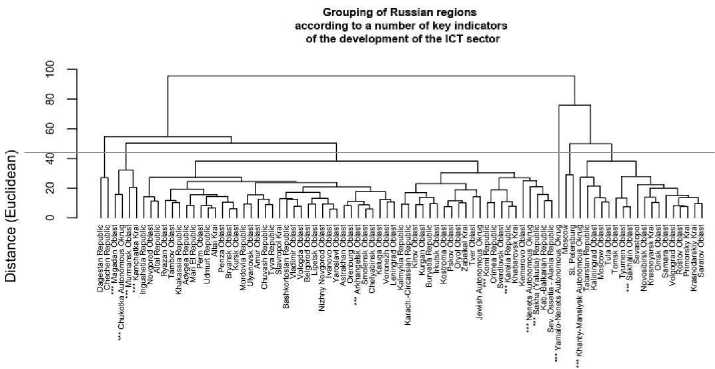
Fig. 1. Results of multidimensional grouping of subjects of the Russian Federation by the main indicators of the ICT sector7.
In total, three groups of northern regions can be distinguished, the values of the selected indicators for which are approximately the same, and separately — the Yamalo-Nenets Autonomous Okrug. The results of multidimensional grouping are confirmed by the analysis of actual statistics (Table 3).
First, let us consider the general picture of the state of ICT in the North. In general, in the northern regions of Russia, the information and communication technology sector is formally more developed than on average in other regions [8, Timushev E.N.]. This is due to the high values of the indicators in the Yamalo-Nenets Autonomous Okrug, the Khanty-Mansi Autonomous Okrug and the Republic of Karelia. In fact, this is due to the high urbanization in the North, the ICT sector is much more developed in cities than in rural settlements [12, Kuratova L.A.].
Table 3
Average values of ICT indicators in the northern regions 8
|
Region / Indicator |
о |
m о |
о |
H| ф о JZ |
m ф о JZ |
u1 |
J ro о |
ro о |
ro о |
^1 .5 о |
LT) |
|
|
Russia as a whole |
90.5 |
31.9 |
65.6 |
70.0 |
64.2 |
93.5 |
58.3 |
14.4 |
96.5 |
1.3 |
9.4 |
0.3 |
|
Northern regions |
92.3 |
31.7 |
64.3 |
77.3 |
72.6 |
94.0 |
55.0 |
22.8 |
94.8 |
2.3 |
12.5 |
0.5 |
|
Yamalo-Nenets Autonomous Okrug |
89.7 |
27.4 |
70.7 |
91.2 |
84.0 |
94.5 |
77.2 |
70.7 |
91.1 |
2.5 |
23.7 |
0.7 |
|
General group of regions 1 |
||||||||||||
|
Khanty-Mansi Autonomous Okrug - Yugra |
91.5 |
25.3 |
64.7 |
86.0 |
81.5 |
95.0 |
71.2 |
20.5 |
96.7 |
1.6 |
19.6 |
0.4 |
|
Sakhalin Oblast |
92.4 |
38.4 |
65.0 |
69.3 |
65.0 |
94.2 |
64.8 |
15.1 |
98.2 |
1.7 |
21.3 |
0.5 |
|
General group of regions 2 |
||||||||||||
|
Republic of Karelia |
94.3 |
37.0 |
72.9 |
74.0 |
69.8 |
95.2 |
51.7 |
16.5 |
99.7 |
5.1 |
9.7 |
0.4 |
|
Komi Republic |
90.2 |
30.8 |
63.0 |
76.0 |
68.5 |
93.6 |
49.3 |
15.2 |
97.1 |
2.1 |
12.3 |
0.3 |
7 Source: author's calculations based on data on the indicators used, based on average data for 2014–2021. Note: *** — northern regions of Russia.
8 Source: author's calculations. Note: based on data for 2014–2021.
|
Nenets Autonomous Okrug |
90.7 |
30.9 |
53.7 |
71.7 |
60.9 |
93.8 |
48.9 |
21.1 |
96.9 |
1.7 |
8.1 |
0.1 |
|
Arkhangelsk Oblast |
91.5 |
27.4 |
68.9 |
74.1 |
68.7 |
94.7 |
64.1 |
14.2 |
97.0 |
1.5 |
5.7 |
0.4 |
|
Sakha Republic (Yakutia) |
92.9 |
33.3 |
59.5 |
66.6 |
75.6 |
93.7 |
53.2 |
13.9 |
91.6 |
1.2 |
12.9 |
0.2 |
|
General group of regions 3 |
||||||||||||
|
Murmansk Oblast |
91.5 |
32.5 |
66.1 |
82.7 |
77.9 |
90.2 |
51.3 |
16.2 |
87.6 |
3.1 |
10.2 |
0.2 |
|
Kamchatka Krai |
95.2 |
35.3 |
66.4 |
72.4 |
71.8 |
94.8 |
57.6 |
28.6 |
89.7 |
1.0 |
12.7 |
0.2 |
|
Magadan Oblast |
94.1 |
33.8 |
64.4 |
79.4 |
71.3 |
93.8 |
34.9 |
18.7 |
92.6 |
4.0 |
4.6 |
0.9 |
|
Chukotka Autonomous Okrug |
93.9 |
28.6 |
56.8 |
84.9 |
76.2 |
94.0 |
35.8 |
22.5 |
100.0 |
1.8 |
8.7 |
1.5 |
Next, let us consider the obtained results of the clustering of regions in terms of groups of indicators.
In the corporate sector , the regions of group 3 have the highest value of indicators, although the spread of values here is very small. Approximately the same indicator values for Russia as a whole and on average for the northern regions indicate that organizations and enterprises located in the North do not have clear incentives to strengthen digitalization or, on the contrary, maintain low levels of computerization of activities, use of the Internet or electronic document management. Nevertheless, interregional differentiation is present. Among the northern regions, the leader in ICT development is the Republic of Karelia, which has high values for all indicators. Largely because of this, the average values for group 2 are also high, especially for the equipment of employees with computers with Internet access (“corp_3”) and the share of organizations with electronic document management (“corp_4”). Enterprises in the Sakhalin Oblast, the Republic of Sakha (Yakutia), the Kamchatka Krai and the Magadan Oblast, where there is a relatively high concentration of entrepreneurial activity with a focus on the extractive industry, use a greater number of computerized workstations and have above-average access to the Internet. In terms of the use of electronic document management, a high level of ICT use, in addition to the Republic of Karelia, is observed in the Yamalo-Nenets Autonomous Okrug and the Arkhangelsk Oblast. This may be due to the development of enterprises not only in the extractive industry, but also in the pulp and paper industry, many of which use a modern enterprise management model. Thus, in the area of ICT development in the corporate sector, the task of government bodies of the constituent entities is to create an attractive environment for the growth of private investment and use other methods of stimulating the entrepreneurial sector to apply modern methods of conducting business processes based on the introduction of digital technologies. In general, the relationship between the sectoral structure of the regional economy and the degree of ICT development in various aspects of the corporate sector may become a promising area of future research.
At the household level, the regions of the North have the highest level of ICT development compared to other regions of Russia. This can be explained by the large share of the urban population in the total population (high urbanization) (Table 4). Regions of group 3 have high values of the indicators. These are regions in the Asian part of Russia: the Kamchatka Krai, the Magadan Oblast, the Chukotka Autonomous Okrug and separately — the Murmansk Oblast. These regions are distinguished by a particularly high level of urbanization even by the standards of northern regions (except for the Chukotka Autonomous Okrug), as well as a low settlement coefficient, which means that a relatively small share of the population lives in settlements with a small population (up to 500 people). In contrast, regions of group 2 — regions of the European North, as well as the Sakha Republic (Yakutia) — have low values of ICT development indicators at the household level. This is due to the nature of settlement — a high settlement coefficient indicates a relatively large share of the population living in settlements with a small population. We are talking about such regions as the Republic of Karelia, the Komi Republic, the Nenets Autonomous Okrug and the Arkhangelsk Oblast. This confirms the results obtained earlier [20, Timushev E.N.]. As in the aspect of corporate development, the Khanty-Mansi Autonomous Okrug also occupies a leading position. It has a low settlement coefficient, which confirms the found pattern: the higher the urbanization and the lower the share of the population living in sparsely populated areas, the higher the ICT development at the household level and vice versa. This pattern is applicable to all northern regions, except for the Sakhalin Oblast and the Chukotka Autonomous Okrug. The former is characterized by a low share of the population living in sparsely populated areas and very low ICT development indicators, while the latter is characterized by a high share of the population living in sparsely populated areas and fairly high ICT development indicators. It is worth noting that the ICT development indicators in the Sakhalin Oblast, although lower than the average for the North, are at the level of the Russian average. Thus, the development of information and communication technologies at the household level will be facilitated by both general measures that promote an increase in population density and the creation of Internet infrastructure in a larger area of the region.
Table 4
Auxiliary indicators 9
|
Region / Indicator |
ф 4-1 с 34 го о- с £ в с 22 5 25 1 ° го £ О ГО ^ со |
о с с Id с 8 25 с Е ф СУ) |
с % о й го .Е о с го н |
£ о ич ш % ш ГО 1_ О\ 1^ ф СП го ею гм | Б S О о 8 К со 1/1 |
|
Russia as a whole |
70.9 |
1.00 |
1.00 |
34.4% |
|
Northern regions |
81.1 |
1.00 |
2.19 |
28.1% |
|
Yamalo-Nenets Autonomous Okrug |
84.7 |
0.95 |
1.59 |
9.1% |
|
General group of regions 1 |
||||
Source: Rosstat, Ministry of Finance of Russia, Electronic Budget portal (for data for 2023). URL:
|
Khanty-Mansi Autonomous Okrug - Yugra |
92.2 |
0.95 |
0.25 |
11.3% |
|
Sakhalin Oblast |
82.6 |
0.97 |
0.33 |
8.2% |
|
General group of regions 2 |
||||
|
Republic of Karelia |
79.7 |
1.02 |
0.02 |
43.0% |
|
Komi Republic |
77.7 |
1.02 |
0.38 |
13.7% |
|
Nenets Autonomous Okrug |
74.5 |
1.06 |
3.54 |
13.4% |
|
Arkhangelsk Oblast |
77.8 |
1.04 |
0.22 |
33.3% |
|
Sakha Republic (Yakutia) |
67.2 |
1.00 |
3.14 |
35.4% |
|
General group of regions 3 |
||||
|
Murmansk Oblast |
93.0 |
0.95 |
0.07 |
13.7% |
|
Kamchatka Krai |
78.0 |
0.97 |
3.74 |
65.0% |
|
Magadan Oblast |
96.5 |
0.97 |
3.41 |
32.5% |
|
Chukotka Autonomous Okrug |
69.1 |
1.09 |
9.63 |
59.0% |
In public administration , the northern regions have high values of the indicator in terms of Internet use in public institutions and low values in terms of Internet use by the population to receive government services. High rates of Internet use at the level of government agencies can be partially explained by the high fiscal capacity and lower transfer-dependence of most northern regions. The Yamalo-Nenets and Khanty-Mansi Autonomous Okrugs can be an example of this [11, Timushev E.N.]. The popularity of Internet use by the population to receive government services in electronic form can be influenced by problems with access to the network and the ICT infrastructure in general in rural areas. This is confirmed by the low values of “public_2” for the regions of group 2 with a high settlement coefficient and high values of “public_2” for the Yamalo-Nenets, Khanty-Mansi Autonomous Okrug and the Sakhalin Oblast, which have a low settlement coefficient, that is, a relatively small share of the population living in small settlements. The density of transport routes and the share of settlements with low transport accessibility (reflected in the transport accessibility coefficient) also play a role. Theoretically, the infrastructure for providing and receiving government services in electronic form could become an alternative to personal visits to government agencies in remote areas. However, among regions with low density of transport routes, only the Kamchatka Krai has a higher than average share of the population that use the Internet to receive public services; in the Nenets Autonomous Okrug, the Republic of Sakha (Yakutia), the Magadan Oblast and the Chukotka Autonomous Okrug, it is very low. Thus, overcoming the lag in information support for the provision of government services creates a significant reserve for the growth of the ICT sector in the North. This could be facilitated by measures similar to the development of ICT at the household level: creating an Internet infrastructure in a larger area of the region, informing citizens about the availability of relevant services, stimulating their use, including through reduced tariffs for paid services. This will also optimize the stationary network of institutions providing public services in a “physical” form.
In the social sphere , one of the leaders among all regions of Russia is the Yamalo-Nenets Autonomous Okrug. However, it is very difficult to form an overall picture here.
In the sphere of general education (indicator “social_1”), the scale of computerization is the highest in the Yamalo-Nenets Autonomous Okrug, as well as in the Khanty-Mansik Autonomous Okrug, the Nenets Autonomous Okrug, the Kamchatka Krai and the Chukotka Autonomous Okrug. The distribution of the indicator obviously does not depend on the level of fiscal capacity of the region, which may be associated with the federal policy of increasing digitalization in general education schools, co-financed through federal intergovernmental transfers. In general, the value of the indicator of the number of computers per student in almost all northern regions is higher than the average for Russia as a whole.
In the sphere of healthcare (indicator “social_2”), in contrast to education, the level of ICT development in the North is much lower. Among a very large number of regions, a relatively low value is observed for the share of healthcare institutions that use the Internet, including in the Yamalo-Nenets Autonomous Okrug. Thus, in the Yamalo-Nenets Autonomous Okrug, the Sakha Republic (Yakutia), the Kamchatka Krai and the Magadan Oblast — regions with low transport accessibility of a large number of populated areas, according to the transport accessibility coefficient — there is a low share of healthcare institutions using the Internet. This may be due to insufficient funding for the transition to digital healthcare institutions, especially in rural areas where feldsher-obstetric stations operate. This situation is unfavorable in all northern regions with a low value of the indicator, including the Murmansk Oblast, but it is most critical in the selected regions due to the nature of the spatial organization of the population distribution. At the same time, the Chukotka Autonomous Okrug is the leader in this indicator among all regions of Russia. Government authorities of the northern regions need to pay special attention to equipping healthcare institutions in sparsely populated areas with digital technologies, which will contribute not only to an increase in the quality of services, but also to the demand for jobs for specialized specialists.
The indicators of digitalization of the cultural sphere — the volume of digitized library catalogues and museum items (“social_3” and “social_5”) — show that ICT penetration is higher in regions such as the Yamalo-Nenets Autonomous Okrug, the Magadan Oblast, and the Chukotka Autonomous Okrug. This may be due to the low transport accessibility of settlements in these regions, which encourages the transition “to digital”, but, probably, to a greater extent — to the results of the work of regional departments of culture. At the same time, the situation in the cultural sphere is not so unambiguous. The already mentioned Magadan Oblast and Chukotka Autonomous Okrug have rather low values of the related indicator — the share of places with access to electronic library resources (“social_4”). Thus, the northern regions, except for the most financially secure ones, such as the Yamalo-Nenets Autonomous Okrug, are not leaders in all aspects of digitalization of the cultural sphere. Nevertheless, in some aspects, the examples of these subjects can become a reference point for other northern regions in popularization and growth of accessibility of cultural facilities among the population.
Conclusion
The scientific novelty of the paper lies in the development of a methodological approach to the comparative analysis of the information and communication technology (ICT) sector in the regions of Russia, aimed at identifying problem areas of development. This approach includes the creation of an original set of indicators that allow making reasonable conclusions about the state of ICT at the regional level, and the implementation of multidimensional grouping (clustering) of all subjects of the Russian Federation by the selected indicators, and then a comparative analysis of the state of ICT in individual regions with the provision of actual values of primary indicators in the context of the selected clusters. In continuation of the work [8, Timushev E.N.], the state of ICT in the northern regions of Russia is assessed using the method of multivariate cluster analysis by Euclidean distance. Using the developed methodological approach, an analysis of the development of information and communication technologies in the northern regions is carried out, problems are identified and recommendations are proposed.
It was determined that the northern regions have higher average values of ICT development indicators compared to other regions of Russia, which is mainly due to high urbanization in the North. The leaders among the northern regions are the Yamalo-Nenets Autonomous Okrug, as well as the Khanty-Mansi Autonomous Okrug and the Republic of Karelia. The greatest advantage is observed in the social sphere and in the household sector, while the leadership of the northern regions in terms of ICT development in the corporate sector is minimal.
It was found that in the North, the development of digital technologies in the corporate sector is similar to the average Russian level, and the further development of ICT here will be facilitated by the creation of an attractive environment for the growth of private investment in the development of modern business processes. The following pattern was revealed: the higher the urbanization and the lower the proportion of the population living in sparsely populated areas, the higher the development of ICT at the household level, and vice versa. At the same time, the development of digitalization at the household level will be facilitated by the creation of Internet infrastructure in the region. It was concluded that in the field of general education and culture, some northern regions have high indicators in a number of areas and can serve as an example of the introduction of digitalization for other regions.
The practical significance of the study is to identify the main reserves for further ICT development in the North — growth in the provision of state and municipal services in electronic form, increased digitalization and provision of the Internet in healthcare institutions. To increase the provision of state services in electronic form, it is necessary to promote the Internet infrastructure throughout the region and a set of measures to encourage citizens to use them. To improve the quality and accessibility of healthcare in the northern regions, it is necessary to take measures to increase the use of information and communication technologies and the Internet in healthcare institutions, paying special attention to rural institutions with a small population and those that are hard to reach. It is important to record the relevant measures in regional state programs.
Further research directions include expanding the object of analysis in the direction of clarifying the relationship between the selected ICT development indicators and general economic indicators of the regional economy development.
