Assessment of the stress-strain state of a prestressed steel-concrete beam

Author: Zamaliev Farit Sakhapovich, Filippov Denis Yurievich
Journal: Строительство уникальных зданий и сооружений @unistroy
Section: Строительные конструкции, здания и сооружения
Article in issue: 2 (116), 2025.
Free access
The object of research is the behavior of a prestressed composite beam with a cross-section composed of an I-shaped steel profile and concrete. The relevance of the research lies in the insufficient theoretical and experimental understanding of the flexural performance of such structures under prestressing conditions. In the examined configuration, the reinforcement is isolated from the main concrete section. Method. The research methodology includes full-scale laboratory testing, numerical simulation in ANSYS, and analytical calculations adapted to the specific features of the structure. Results. Experimental results were compared with calculation outcomes. The experimentally determined maximum bending moment was 111,499.7 N·m with a deflection of 5.91 mm; the deviations from the numerical model were 6.8 % in moment and 2.5 % in deflection, while the analytical model showed 2.9 % and 12.2 % deviation, respectively. The findings highlight the need to refine the stiffness reduction coefficient ks to improve the accuracy of deformation predictions.
Prestressed beams, Steel-concrete structures, Stress-strain state, Finite element modeling, Experimental testing, Load capacity, Deflection
Short address: https://sciup.org/143184698
IDR: 143184698 | DOI: 10.4123/CUBS.116.5
Text of the scientific article Assessment of the stress-strain state of a prestressed steel-concrete beam
The application of prestressing in steel-concrete composite structures remains relatively uncommon in Russian construction practice. Currently, researchers and engineers are paying greater attention to non-prestressed steel-reinforced concrete systems. Publications [1], [2] outline the current state and development prospects of such structures. Article [3] provides a historical analysis of steelconcrete composite floor systems and discusses technical solutions protected by patents of the Russian Federation. Meanwhile, the problem of increasing the load-bearing capacity of steel-reinforced concrete elements remains relevant, particularly using high-strength concrete [4].
In recent years, the interest in prestressed steel-concrete elements has been growing due to their potential to significantly improve structural stiffness and capacity. Several studies [5], [6] present experimental and analytical investigations of prestressed reinforced concrete and steel-concrete beams, including systems with external tendons. Article [7] examines various prestressing schemes in T-shaped beams, while [8] presents a parametric numerical study of the effectiveness of external prestressing and its correlation with experimental data. Study [9] addresses shear deformations in continuous box-section composite beams, and [10] evaluates the influence of tendon layout, geometry, length, and prestressing force levels.
The interaction between prestressed composite beams and other structural components has also attracted attention. For example, [11] analyzes the composite behavior of a monolithic slab and a prestressed beam, while [12] investigates the performance of concrete-filled steel tubular sections. Multispan and prefabricated composite systems are the focus of works [13], [14]. Recent studies have also explored the use of carbon fiber reinforcement to enhance prestressed elements [15].
Despite this growing body of research, comprehensive evaluation of the stress-strain state of prestressed steel-concrete beams using a combination of experimental, analytical, and numerical methods remains an important research direction. The aim of this study is to conduct a detailed assessment of the stress-strain behavior of a prestressed steel-concrete beam. To achieve this goal, the following tasks were formulated:
– to conduct full-scale testing with measurement of strains and deflections;
– to implement finite element modeling and compare the results with experimental data;
– to perform theoretical analysis of the stress state of the structure.
-
2 Materials and Methods
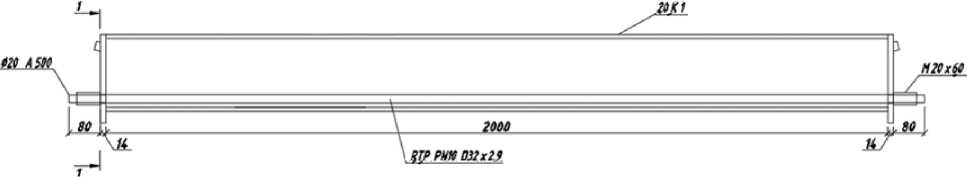
The object of the study is a prestressed steel–concrete (composite) beam based on a hot-rolled I-beam of type 20K1 with a length of 2 meters. The spatial structure consists of a steel section made of grade C245 steel and an internal volume filled with B20-class concrete. Reinforcement bars of grade A500 with a diameter of 20 mm are placed inside the beam. The reinforcement is laid in polypropylene sleeves that isolate it from direct bond with the concrete, allowing the application of prestressing force without transferring stress to the concrete at the tensioning stage. The design of the beam is shown in Figure 1, which presents its general view.
1-1
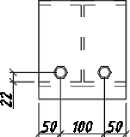
Fig. 1 - General view of the beam
Image by the author of the article
Prestressing was applied using a torque wrench that tightened the threaded ends of the reinforcement bars. To account for the relationship between the applied torque and the resulting force in the reinforcement, an experimental correlation was established in advance. It was determined that a force of 50 kN corresponds to a torque of 162.5 №m. This relationship was used to achieve the required level of prestressing. The torque–force correlation is showng in Figure 2.
(a) (b)
Fig. 2 - Prestress application accounting: (a) test setup, (b) graph of reinforcement force versus applied torque
Image by the author of the article
The design characteristics of the materials used in the study are as follows: – Modulus of elasticity of steel: E s =2 ⋅ 105MPa;
– Modulus of elasticity of B20 concrete: E b =27500 MPa;
-
– Compressive strength of concrete: R bn =15 MPa;
-
– Tensile strength of concrete: R btn =1.62 MPa.
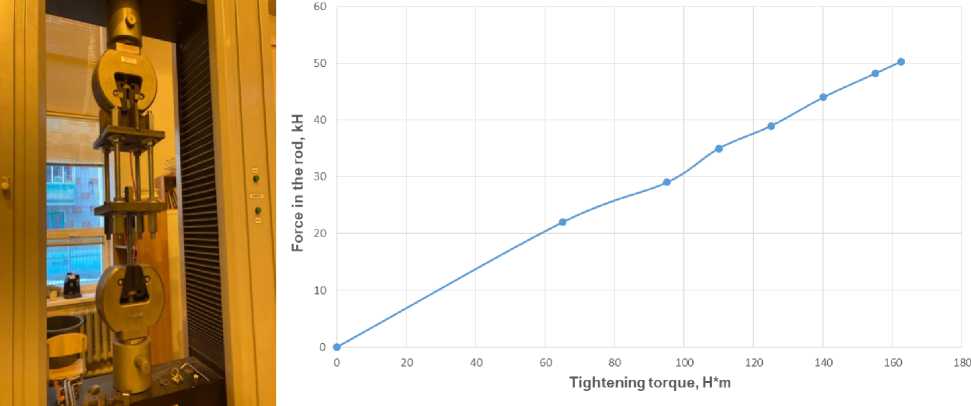
Experimental investigations were carried out on a full-scale specimen of the prestressed steel– concrete beam under laboratory conditions. Loading was applied using an IPS-200 hydraulic press. The beam was supported on two hinged supports with a calculated span of 1.95 m. A four-point loading scheme was employed, in which two concentrated forces were positioned at one-third of the span from each support. This configuration ensured a constant bending moment in the central region of the beam. The general view of the beam installed on the test stand is shown in Figure 3, and the schematic diagram of the test setup is presented in Figure 4.
Fig. 3 - General view of the beam installed on the test stand Image by the author of the article
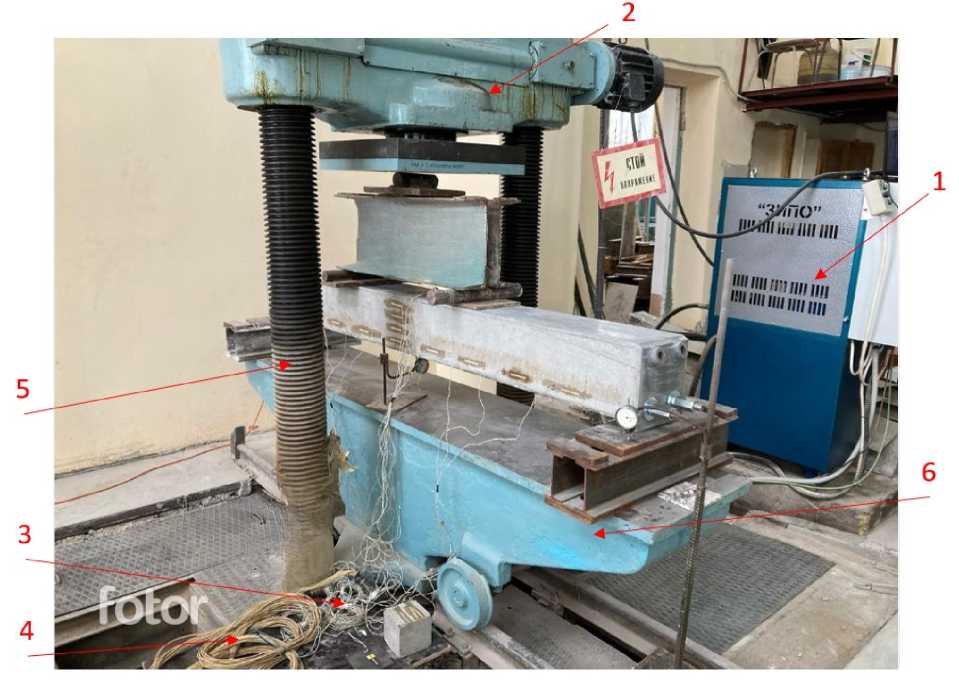
Fig. 4 - Schematic diagram of the test setup: 1 — loading unit of the press; 2 — fixed support; 3 — signal switchboard; 4 — cable; 5 — press columns; 6 — press base
Image by the author of the article
The monitoring of the stress–strain state was carried out using strain gauges and dial indicators. Strain measurements in the steel part of the beam were conducted with a gauge length of 20 mm, while for the concrete part, a gauge length of 50 mm was used. Strain gauges were installed in both the tension and compression zones of the cross-section, as well as along the beam span. Deflections were recorded using dial indicators installed at mid-span and near the supports, with a measurement accuracy of 0.01 mm. The arrangement of the indicators is illustrated in Figure 5.
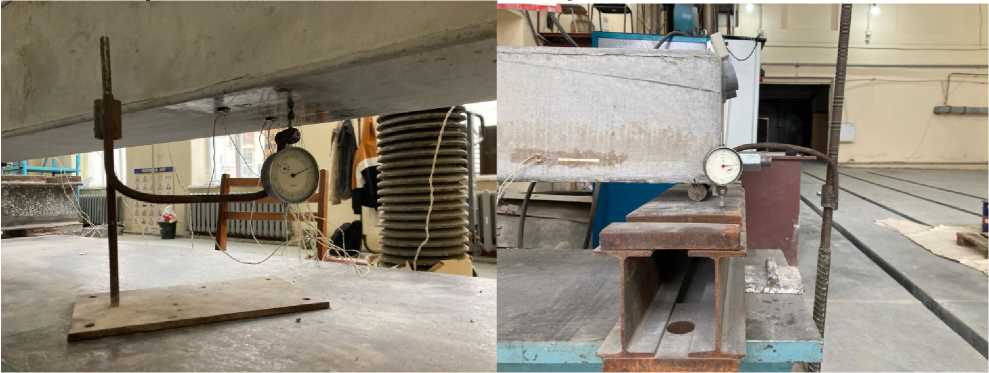
(a)
(b)
Fig. 5 - Arrangement of dial indicators: (a) mid-span deflection measurement, (b) support settlement measurement
Image by the author of the article
The loading was applied in stages: initially in increments of 20 kN up to a total of 320 kN, followed by discrete load steps of 350, 400, and 500 kN. At each stage, measurements of deflections and strains were recorded. The testing was conducted until the ultimate limit state of the structure was reached.
For the numerical analysis of the stress–strain state of the beam, the ANSYS software package was employed. The computational model was developed in a threedimensional configuration using solid bodies to represent the geometry of the steel section, concrete infill, and reinforcement bars. The general view of the geometric model is shown in Figure 6. The reinforcement was modeled as separate elements isolated from the concrete, reflecting the experimental setup, where polypropylene sleeves were used to prevent bonding between the reinforcement and the surrounding concrete.
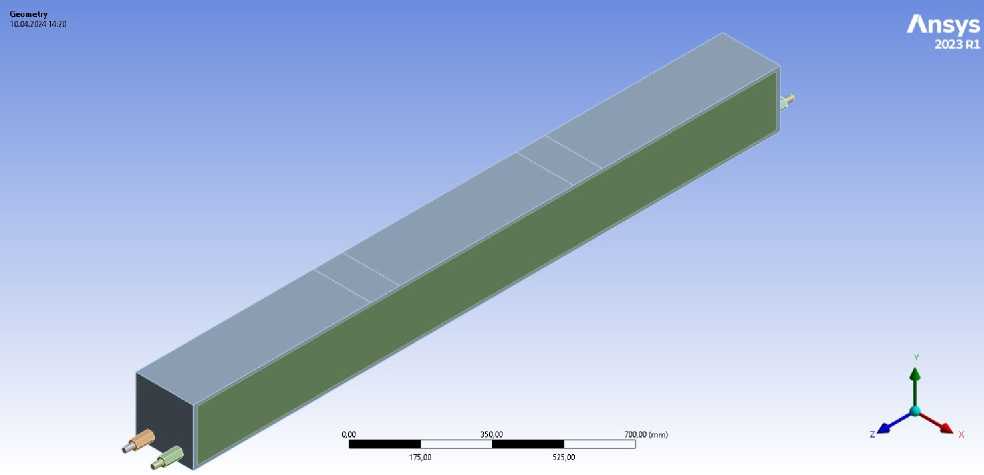
Fig. 6 - Geometric model of the beam in ANSYS environment Image by the author of the article
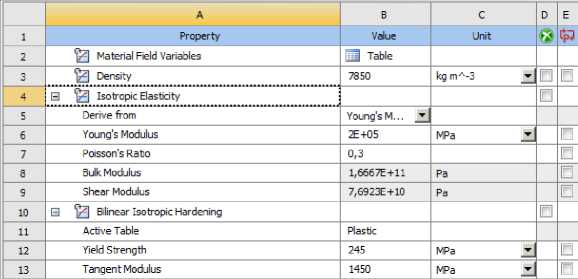
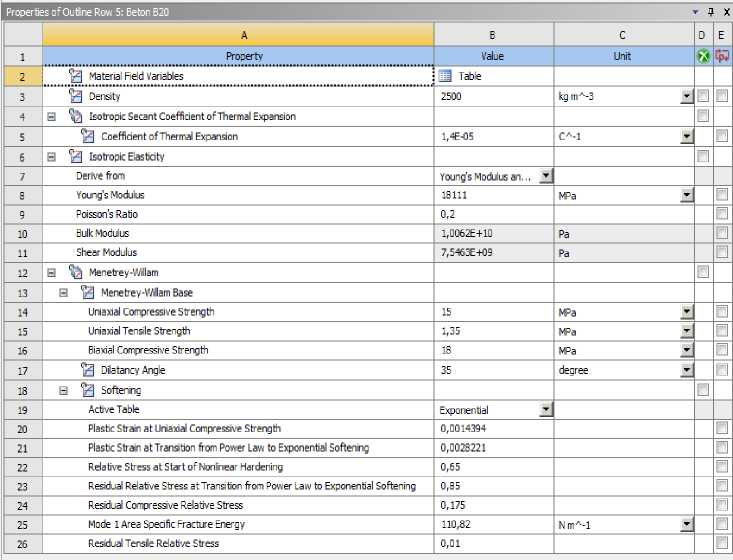
The material properties were defined with consideration of physical nonlinearity. For steel, a bilinear isotropic hardening model was used, which accounts for the transition from elastic to plastic behavior. For concrete, the Menetrey–Willam model was employed in its standard ANSYS implementation, with the softening function activated to simulate the degradation of strength parameters upon reaching ultimate stress levels. The tabulated values of the material properties used in the analysis are presented in Figure 7.
|
A |
В |
C |
D |
E |
|
|
1 |
Property |
Value |
Unit |
:■ |
fa |
|
2 |
^ Material Field Variables |
Ц Table |
|||
|
3 |
Density |
7850 |
kg mA-3 ^ |
□ |
□ |
|
4 |
□ ^| Isotropic Elasticity |
□ |
|||
|
5 |
Derive from |
Young's M... T |
|||
|
6 |
Young's Modulus |
2E+O5 |
MPa 2 |
□ |
|
|
7 |
Poisson's Ratio |
0,3 |
□ |
||
|
8 |
Bulk Modulus |
1,6667E+11 |
Pa |
□ |
|
|
9 |
Shear Modulus |
7,6923E+10 |
Pa |
||
|
10 |
В ^ Bilinear Isotropic Hardening |
□ |
|||
|
11 |
Active Table |
Plastic |
|||
|
12 |
Yield Strength |
500 |
MPa _x |
□ |
|
|
13 |
Tangent Modulus |
1450 |
MPa _x |
□ |
(a)
(b)
(c)
Fig. 7 - Tabulated material properties used in the computational model: (a) reinforcement, (b) steel I-beam, (c) concrete
Image by the author of the article
The contact interactions were modeled with consideration of the structural features of the assembly. The contact between steel components—for example, between the nut and the flange of the I-beam—was defined with a friction coefficient of 0.2. For concrete–steel interfaces, a coefficient of 0.4 was applied. The contact between the anchoring elements and the concrete was modeled as fully bonded. The interaction between the reinforcement bars and the polypropylene sleeves was defined as frictionless. This assumption was made conditionally, as the effect of this interface on the stress–strain state of the beam was not specifically investigated and is considered negligible for the purposes of the present analysis.
A solid mesh was used to construct the finite element model. The maximum element size was set to 20 mm for the concrete parts and 40 mm for the steel components. This level of discretization ensured the necessary accuracy while maintaining reasonable computation time. A visualization of the finite element mesh is presented in Figure 8.
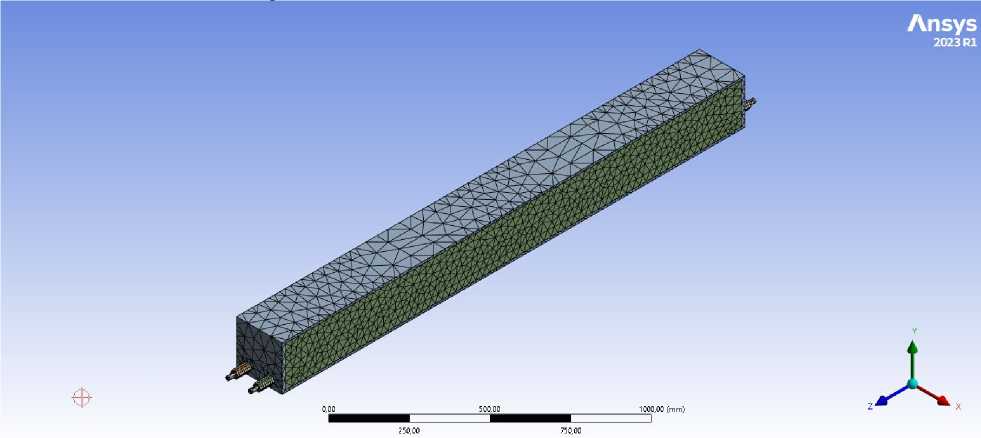
Fig. 8 - Finite element mesh of the computational model
Image by the author of the article
The boundary conditions included the support of the beam on hinged bearings and the application of concentrated loads in accordance with the four-point loading scheme, identical to the experimental setup. The scheme of boundary condition implementation and loading in the numerical model is shown in Figure 9.
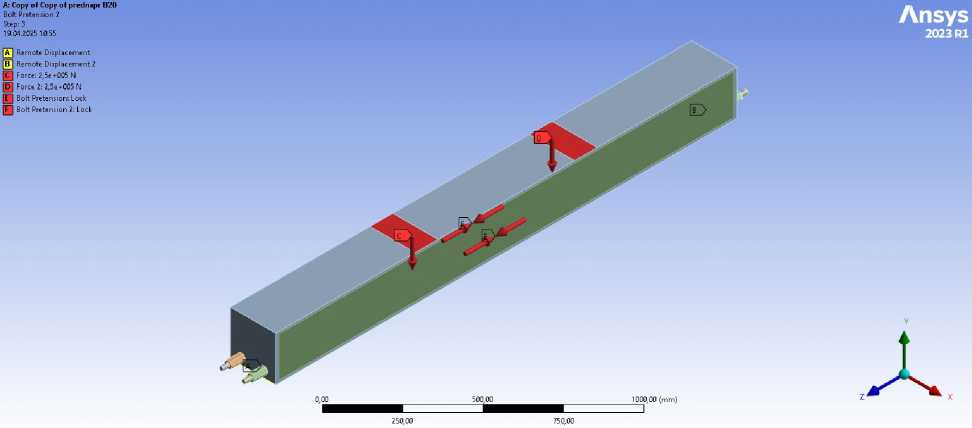
Fig. 9 - Boundary conditions and loading scheme in the numerical model Image by the author of the article
The model incorporated geometric nonlinearity by enabling the large displacement option. The simulation was carried out up to the point of failure in the compressed zone of the concrete, allowing for a comprehensive assessment of the deformation behavior up to material failure.
Based on the results of the experimental studies and numerical simulations, a theoretical evaluation of the beam’s ultimate load-bearing capacity was performed. The calculation was based on the assumption that the position of the neutral axis may vary depending on the level of prestressing force applied to the reinforcement.
In the considered design, the concrete primarily resists compressive forces and contributes minimally to the tensile strength. The introduction of a controlled prestressing force helps to compensate for the asymmetrical strength distribution across the beam’s height and shifts the neutral axis closer to the mid-depth of the section. This leads to a more uniform distribution of relative strains in the steel components, allowing both the upper and lower flanges of the I-beam to reach yield simultaneously. As a result, the steel–concrete composite cross-section operates more efficiently, maximizing its loadbearing potential.
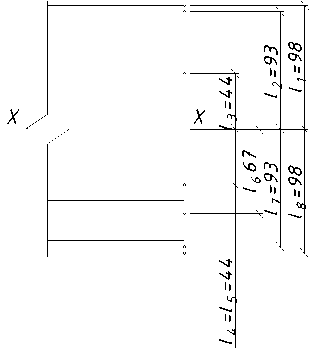
A graphical representation of the calculation scheme corresponding to the described methodology is shown in Figure 10.
A s?* £ 2*E s
A s3*£3*Es+A b3 *£з*£ь
As4*£4 *Es+A ь5*е5*Е ь„
A sj*£ j *Es
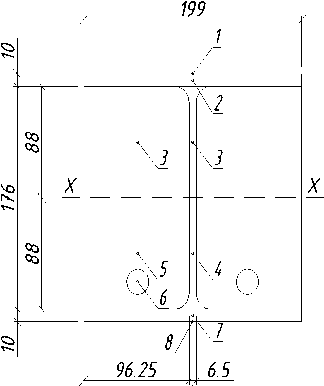
Fig. 10 - Cross-section of prestressed steel-concrete beam
Image by the author of the article
Relative strains across the height of the cross-section:
£ 1 = г ; £ 2 = £ 1 ’ "Г; £ 3 = £ 1 ’ “Г; £ 4 = £ 3 ; £ 5 = г ; £ 7 = £ 2 ; (1)
E s l 1 l 1 E b
Based on the equilibrium of internal forces within the cross-section, the following condition can be formulated:
A s 2 ■ £ 2 ■ E S ■1 2 + A s 3 ■ £ 3 ■ Es ■ l 3 + A b 3 ' £ 3 ' Eb '1 3 = As 4 ' £ 4 ' Es '1 4 + Ab 5 ' £ 5 ' Eb * '1 5 + ( Fp + Fs ) ‘ 1 6 + As7 ' £7 ' Es '17 (2)
The maximum load-bearing moment can then be determined as follows:
M max = 2 ■ ( A s 2 ■ £ 2 ■ Es ’1 2 + A s 3 ■ £ 3 ■ E s '1 3 + A b 3 ’ £ 3 ' E b 'l 3 )
From equation (2), the initial prestressing force can be expressed as follows:
F _ b3 £3 ^b 33 b5b5 £5 ^b* *5 _ F p p 1 s l6
Where: - Fs =
l 6 ■ SM
l 62 +
( I I ^
V + 7
■ L
The deflection of the beam was determined using an analytical expression corresponding to the four-point loading scheme of a simply supported beam. The curvature of the prestressed flexural element was calculated according to equation (9.42) from set of rules 63.13330.2018. The stiffness of the composite cross-section was evaluated using equation (G.11) from set of rules 266.1325800.2016. It was assumed that the empirical coefficient k s =0.7 should be applied exclusively to the stiffness of the steel I-beam, as the reinforcement in the considered design is isolated from the concrete section and does not contribute to its composite action.
3 Results and Discussion
According to the experimental data, the yield point of the steel element was reached at a load of 343.076 kN, corresponding to a bending moment of 111499.7 N^m. This value is taken as the ultimate load-bearing capacity in accordance with the adopted methodology. The measured mid-span deflection at this stage was 5.91 mm.
Failure of the compressed concrete zone was recorded at a load of 443.33 kN, corresponding to a bending moment of 144298.45 N^m. The observed damage pattern indicates that the ultimate compressive strength of the concrete was reached.
Numerical modelling performed in ANSYS showed that the onset of steel yielding occurred at a load of 366.5 kN, corresponding to a bending moment of 119112.5 N^m, which is 6.8 % higher than the experimental value. The corresponding calculated deflection was 6.06 mm, exceeding the experimental result by 2.5 %.
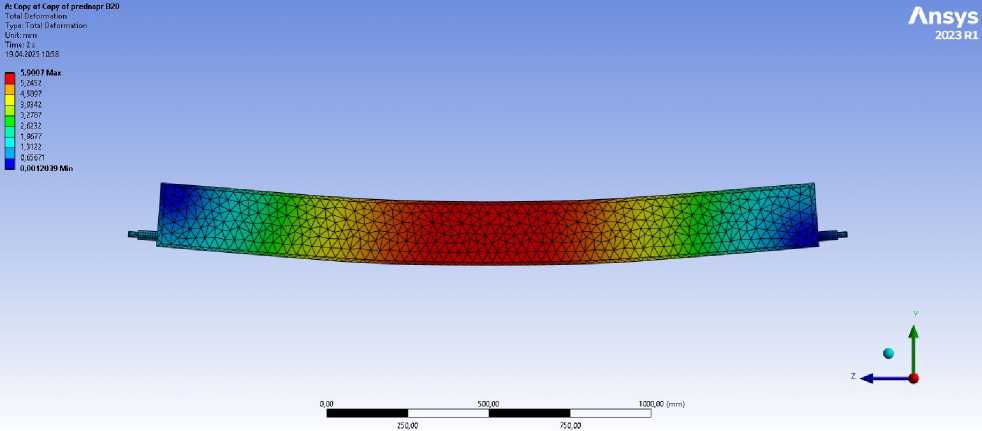
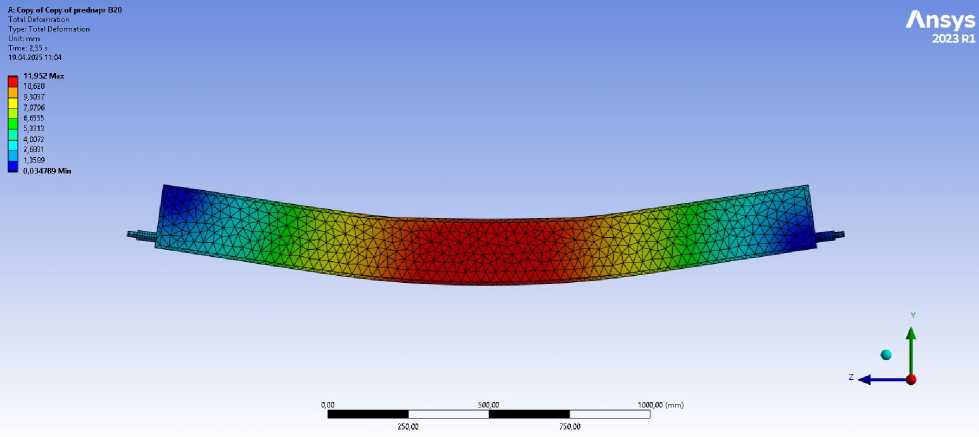
The deformation pattern of the beam under design and failure loads obtained through numerical modelling is presented in Figure 11.
(a)
(b)
Fig. 11 - Beam deformation from numerical modelling under maximum load and at concrete compression failure: (a) maximum load-bearing moment; (b) failure of the compressed concrete zone
Image by the author of the article
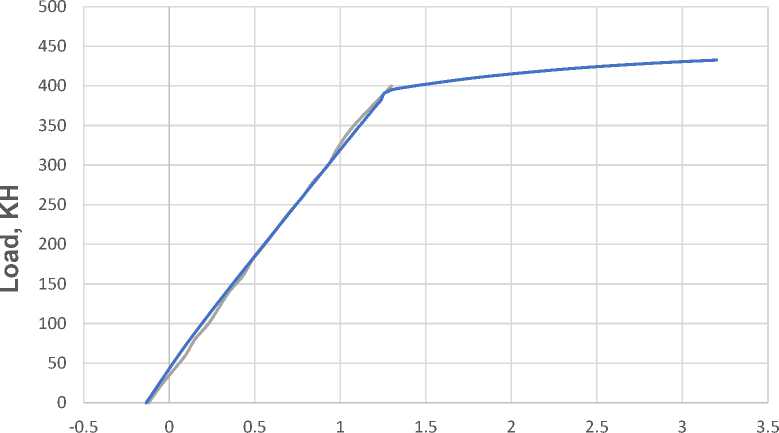
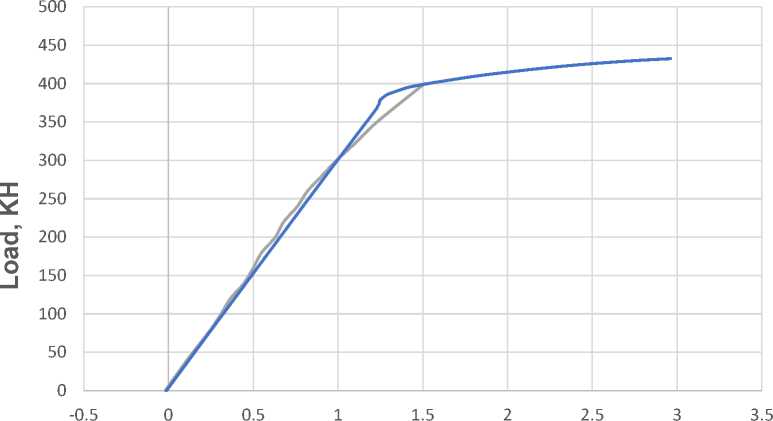
A comparison of load–deflection relationships obtained experimentally and through the ANSYS model is shown in Figure 12.
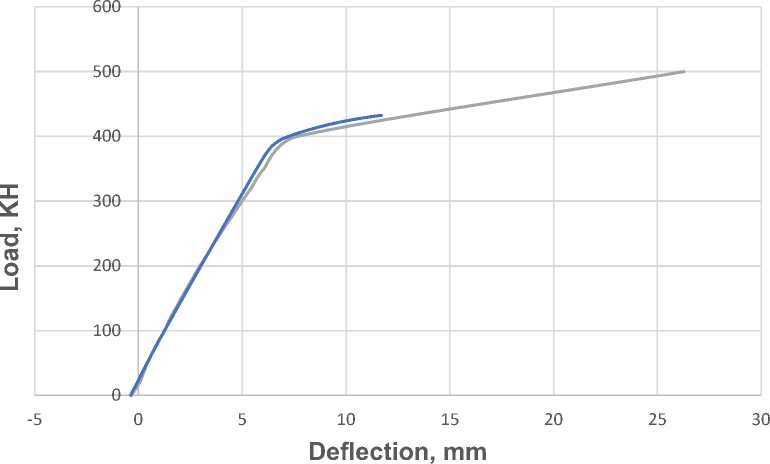
^^^^^^^^» Experiment
^^^^^^^^мANSYS
Fig. 12– Load–deflection relationship: comparison between experimental data and ANSYS results Image by the author of the article
Failure of the compressed concrete zone in the numerical model occurred at a load of 432.5 kN, corresponding to a bending moment of 140562.5 №m. Compared to the experimental value, this result is 2.44 % lower, indicating a satisfactory agreement between the numerical model and the actual structural behaviour. The resulting stress distribution and deflected shape of the beam are consistent with the experimental observations.
A comparison of strain–load relationships for the upper and lower flanges of the steel element, obtained experimentally and numerically, is presented in Figure 13.
^^^^^^^^м Experiment
^^^^^^^B ANSYS
Relative deformations along the bottom of the I-beam, mm/mm*10^3
(a)
^^^^^^^^м Experiment
^^^^^мANSYS
Relative deformations along the top of the I-beam, mm/mm*10^3
(b)
Fig. 13– Strain–load relationship: (a) lower flange of the I-beam; (b) upper flange. Comparison between experiment and ANSYS
Image by the author of the article
The analytical estimation of the ultimate moment capacity yielded a bending moment of 114747.25 N^m. The corresponding calculated load was 353.1 kN, and the deflection was 6.63 mm. Thus, the analytical bending moment exceeded the experimental value by 2.9 %, and the deflection by 12.2 %. The noticeable deviation in deformation is attributed to the use of the empirical coefficient k s =0.7, as specified in set of rules 266.1325800.2016, which is applied to reduce the stiffness of the steel element. In the context of the present structural configuration, this leads to an underestimation of the overall stiffness and, consequently, an overestimation of the deflection. This highlights the need to refine the value of the coefficient k s when designing composite members of a similar configuration.
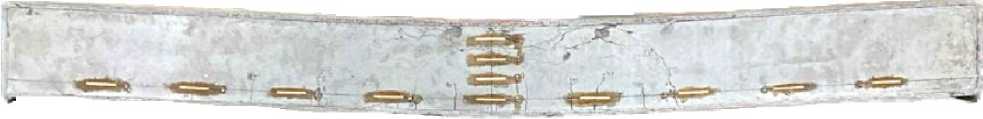
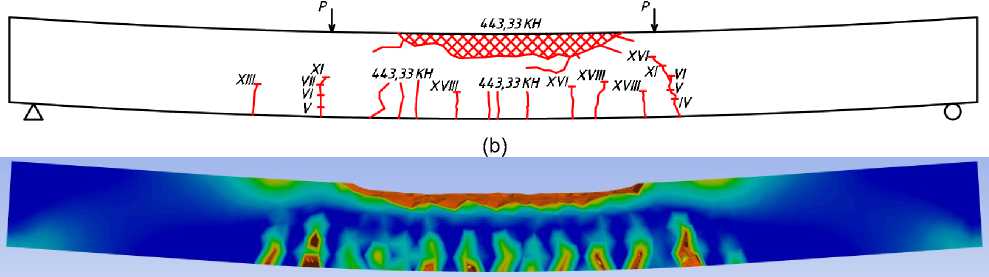
A comparison of crack patterns observed experimentally and reproduced in the numerical model is provided in Figure 14.
(a)
(c)
Fig. 14– Crack pattern in the composite steel–concrete beam: (a) visually observed cracking after testing; (b) crack scheme based on experimental results; (c) cracking in the numerical model (ANSYS)
Image by the author of the article
4 Conclusions
-
1. The experimental investigation established that the maximum load-bearing moment was 111,499.7 N^m (corresponding to a load of 343.076 kN), while failure of the compressed concrete zone occurred at a moment of 144,298.45N^m (load 443.33kN). The deflection at the stage of maximum load-bearing capacity was measured as 5.91 mm.
-
2. Numerical modelling in ANSYS demonstrated satisfactory agreement with the experiment: the maximum moment was 119,112.5 N^m (6.8% higher than the experimental value), with a corresponding deflection of 6.06 mm (2.5 % deviation). Failure of the compressed concrete zone in the model occurred at a moment of 140,562.5 N^m (load 432.5 kN, deviation 2.44 %).
-
3. The analytical estimation of the maximum moment yielded a value of 114,747.25 N^m, differing from the experimental result by 2.9%. The associated deflection was 6.63 mm, which exceeds the experimental value by 12.2 %. The overestimation of deflection is attributed to the use of the reduction coefficient ks = 0.7, as prescribed by set of rules 266.1325800.2016.
-
4. Comparison of the three approaches showed that all methods provide consistent estimates of the beam's load-bearing capacity. The numerical model demonstrated the best agreement with the experiment in terms of deformation, while the analytical model provided the most accurate prediction of the maximum moment.
-
5 Conflict of Interests
The authors declare no conflict of interest
