Association of Interleukin-10 gene polymorphisms (rs1800872 and rs1800896) with cervical cancer susceptibility in Quetta, Pakistan
 with cervical cancer susceptibility in Quetta, Pakistan")
Author: Mohammad N., Khan M., Maqsood M., Naseeb A.
Journal: Сибирский онкологический журнал @siboncoj
Section: Лабораторные и экспериментальные исследования
Article in issue: 3 т.24, 2025.
Free access
Background. Interleukin-10 (IL-10) regulates immune responses and has been linked to cancer development. Polymorphisms in the IL-10 gene, such as rs1800872 and rs1800896, may affect cancer susceptibility. No previous study has examined the association between these variants and cervical cancer in Quetta, Pakistan, which this study aims to address. Aims. This study aimed to investigate the association between IL-10 gene polymorphisms (rs1800872 and rs1800896) and cervical cancer susceptibility among women in Quetta, Pakistan, and to determine the prevalence and risk factors contributing to cervical cancer in this population. Material and Methods. A total of 50 patients diagnosed with cervical cancer and 50 individuals without any health issues were selected for the case-control analysis. Data was collected for retrospective analysis using a pre-designed data collection form. Demographic information and blood samples were collected from participants with explicit consent. The DNA was extracted using an organic approach, and genotyping was performed using the TETRA primer ARMS-PCR technique. The data analysis was conducted using multinomial logistic regression with a 95 % confidence interval, utilizing the SPSS software. Results. The study demonstrated no significant association between IL-10 gene polymorphisms (rs1800872 and rs1800896) and cervical cancer among the population of Quetta City. Statistically significant relationships were found between cervical cancer and smoking, lack of exercise, menarche, and usage of oral contraceptive medications. Conclusion. This study confirms no association between IL-10 gene polymorphisms (rs1800872 and rs1800896) and cervical cancer in Quetta. Furthermore, a lack of awareness regarding cervical cancer poses a significant obstacle to its effective care at the individual level in Pakistan.
Cervical cancer, IL-10, polymorphism, SNPs
Short address: https://sciup.org/140310576
IDR: 140310576 | UDC: 618.146-006.6:575.113(549) | DOI: 10.21294/1814-4861-2025-24-3-76-92
Ассоциация полиморфизмов гена Интерлейкина-10 (rs1800872 и rs1800896) с восприимчивостью к раку шейки матки в Кветте, Пакистан
Актуальность. Интерлейкин-10 (IL-10) играет важную роль в регуляции иммунных реакций и может быть связан с развитием рака. Полиморфизмы в гене ИЛ-10, такие как rs1800872 и rs1800896, могут влиять на восприимчивость к раку. Ни одно из предыдущих исследований не изучало связь между этими вариантами и раком шейки матки в Кветте, Пакистан. Целью исследования было изучение связи между полиморфизмами гена IL-10 (rs1800872 и rs1800896) и восприимчивостью к раку шейки матки (РШМ) среди женщин в Кветте, Пакистан, а также определение распространенности и факторов риска, способствующих развитию РШМ в этой группе населения. Материал и методы. Для проведения анализа по методу «случай-контроль» были отобраны 50 больных РШМ и 50 здоровых лиц. Данные для ретроспективного анализа собирались с использованием заранее разработанной формы. Демографическая информация и образцы крови собирались у участниц с их согласия. ДНК извлекалась с использованием органического подхода, а генотипирование проводилось с использованием техники TETRA-праймера ARMS-PCR. Анализ данных проводился с использованием мультиномиальной логистической регрессии с 95 % доверительным интервалом с помощью программного обеспечения SPSS. Результаты. Исследование не выявило значимой связи между полиморфизмами гена IL-10 (rs1800872 и rs1800896) и РШМ среди населения города Кветта. Значимая связь была обнаружена между РШМ и курением, отсутствием физической активности, возрастом менархе и использованием оральных контрацептивов. Заключение. Исследование не подтверждает связи между полиморфизмами гена IL-10 (rs1800872 и rs1800896) и раком шейки матки в Кветте. Отсутствие осведомленности и неадекватный скрининг являются существенным препятствием для эффективного лечения РШМ.
Text of the scientific article Association of Interleukin-10 gene polymorphisms (rs1800872 and rs1800896) with cervical cancer susceptibility in Quetta, Pakistan
Cervical cancer is a significant global health issue, particularly in underdeveloped nations such as Pakistan [1]. Cervical cancer is caused by the rapid growth of abnormal cells in the cervix due to the human papillomavirus (HPV), genetic factors, and unhealthy lifestyles. Epidemiological and medical statistics indicate that various variables contribute to the onset of cervical cancer. The main causative factor for the development of cervical cancer is the human papillomavirus (HPV) [2]. Possible additional risk factors for cervical cancer include immunodeficiency, nutritional status, age at first pregnancy, smoking, immunosuppression, and family history [3]. Annually, over 311,000 women across the globe succumb to cervical cancer, impacting almost 570,000 individuals each year. Women in underdeveloped countries are at a higher risk of developing cervical cancer [4].
Insufficient screening and inadequate reporting of cervical cancer in Pakistan have resulted in a lack of accurate data regarding the prevalence of this disease. The epidemiological data is unreliable due to inadequate disease reporting. The studies were conducted on a limited scale and exclusively targeted documented cases. The World Health Organization (WHO) predicts that by 2030, around 500,000 women will succumb to cervical cancer, with 98 % of these fatalities concentrated in underdeveloped countries such as Pakistan [5].
Cervical cancer is a significant public health concern in Pakistan. According to the World Health Organization (WHO), in 2021, over 5,000 Pakistani women were diagnosed with cervical cancer, and approximately 3,006 deaths were reported. These numbers are believed to be underestimated due to limited national screening programs and underreport- ing [6]. Further studies have estimated that the age-standardized incidence rate (ASIR) of cervical cancer in Pakistan ranges from 5.2 to 8.4 per 100,000 women, with approximately 6,166 new cases annually. These estimates highlight a higher burden than previously reported and underscore the need for comprehensive cervical cancer control strategies [1]. These statistics emphasize the critical need for enhanced cervical cancer screening, prevention, and treatment programs in Pakistan to reduce the disease burden effectively.
Interleukin-10 (IL-10) is a cytokine that plays a role in multiple cellular activities. IL-10 has a dual role in the genesis of cancer.. IL-10 plays a role in both suppressing the immune system and encouraging cancer. However, it can also prevent cancer growth by inhibiting the formation of new blood vessels (anti-angiogenic activities) [7]. Various scientific investigations have indicated that polymorphisms can influence and alter an individual's vulnerability to numerous types of cancer. Several studies have sought to establish a connection between cervical cancer and a specific genetic variation in the IL-10 gene, known as polymorphism (1082 G/A), with various levels of achievement. In 2001, Stanczuk et al. found a substantial association between the G allele of the IL-10 gene and the development of cervical cancer in Zimbabwean women, as compared to the IL-10 A allele. Moreover, in Japanese populations, the presence of the G allele was associated with a higher occurrence of cervical cancer compared to the IL-10 A allele. The IL-10 gene polymorphism was found to have no association with cervical cancer in the Korean, Dutch, British, Chinese, and Argentinean populations [8].
The AA and CA genotypes for IL-10-592C/A were strongly linked to increased cell proliferation rates. When GG and GA alleles of TNF-308 were combined with AA and CA alleles of the IL-10 gene, a correlation was present between the severity of cervical cancer for both IL-10 -592C/A and TNF -308G/A variations. These findings imply that IL-10-592 CA/AA can alter an individual's immunological response, increasing the risk of cervical cancer [9].
Despite being a significant health issue in developing nations such as Pakistan, there is a lack of research on the prevalence and risk factors of cervical cancer. Although several studies have been undertaken in various regions of Pakistan, none of them have specifically investigated the prevalence, risk factors, and association between IL-10 gene polymorphisms (rs1800872 and rs1800896) and cervical cancer. This study aimed to determine the incidence of cervical cancer, assess associated risk factors, and evaluate the association of IL-10 gene polymorphisms (rs1800872 and rs1800896) with cervical cancer susceptibility among women in Quetta, Pakistan.
Material and Methods
Study area and data collection
The study was carried out at the Center for Nuclear Medicine and Radiotherapy (CENAR) in Quetta, Pakistan. A retrospective analysis was performed using data from hospital records at CENAR over eight years (2015–2022). Data were extracted using a predesigned questionnaire that captured essential information from the hospital records. In addition, individual interviews were conducted to obtain supplementary details regarding patients’ age, menopause, menarche, ethnicity, exercise habits, smoking status, number of children, use of contraceptive drugs, type of cervical cancer, cancer stage, and clinical manifestations.
Study Population
A retrospective analysis was conducted using data from 112 cervical cancer patients recorded between 2015 and 2022 at the Center for Nuclear Medicine and Radiotherapy (CENAR) in Quetta, Pakistan. However, blood samples for DNA extraction were collected only from patients available during the study period. Consequently, a subgroup of 50 cervical cancer patients was selected for gene polymorphism analysis based on the availability of high-quality DNA and comprehensive clinical records. An equivalent group of 50 age-matched healthy control individuals, with no history of cervical cancer or other malignancies, was also recruited for the genetic analysis.
Inclusion and exclusion criteria
The inclusion criteria for all the patients were: having confirmed cervical cancer through diagnosis, being genetically unrelated, having an age of more than 20 years, having no previous history of other cancers, and having female sex. Whereas, exclusion criteria were: patients who were unable to provide information, had chronic diseases and other cancer types, were under 20 years old, and refused to participate in the study. Controls were selected by matching age with cervical cancer patients.
Blood sampling
Venous blood samples (3 mL) were collected from both cervical cancer patients and healthy control participants at CENAR Hospital. Before blood collection, Falcon tubes were preloaded with 200 µL of EDTA (Ethylenediaminetetraacetic acid) as an anticoagulant. Immediately following collection, the samples were stored at -20 °C for at least 24 hours before DNA extraction.
DNA extraction, quantification, and Tetra primer ARMS-PCR
The lab work was conducted in the molecular biology laboratory located at Sardar Bahadur Khan Women’s University (SBKWU) in Quetta. Genomic DNA was extracted from peripheral blood using the organic method. Briefly, blood samples were washed with TE buffer and centrifuged to separate white blood cells. The pellet was digested with proteinase K and Sodium Dodecyl Sulphate (SDS), followed by DNA extraction using phenol-chloroform-isoamyl alcohol. DNA was then precipitated with isopropanol, washed with ethanol, and dissolved in TE buffer. The purified DNA samples were stored at -20 °C for further analysis. The quantification of extracted DNA was performed using gel electrophoresis on a 1.5 % agarose gel. The genotyping of the single nucleotide polymorphism (SNP) was performed using the Tetra Primer Amplification Refractory Mutation System Polymerase Chain Reaction (ARMS-PCR), a cost-effective and easy approach. Reverse and forward primers were employed to amplify the particular sequence of the IL-10 gene. Eventually, gel electrophoresis was performed to observe the amplified DNA samples.
Statistical analysis
The data was analyzed using SPSS version 20 (SPSS Inc., Chicago, IL, USA). Multinomial logistic regression was employed to assess the correlation between different risk factors, and odds ratios (OR) with 95 % confidence intervals (CI) were calculated to interpret categorical variables. The association between IL-10 gene polymorphisms and categorical variables was determined using the chi-square test, with both the calculated test statistic (χ² value) and the corresponding p-value reported in the tables. Graphs were generated using GraphPad Prism 8 OS X version 8.0.1 software.
Results
Occurrence rate of cervical cancer (2015–2022)
Between 2015 and 2022, CENAR Hospital recorded 112 cases of cervical cancer, with a fluctuating trend in annual cases. The highest incidence occurred in 2018, while the numbers were generally lower in other years, with the smallest recorded in 2017. A detailed breakdown of the yearly data is given in Fig. 1.
Over the past eight years, cervical cancer cases were observed across various age groups, ranging from 20 to 79 years old. Cervical cancer cases were most prevalent in the 40–49 age group, representing
Table 1/Таблица 1
Age groups, frequency of reported cases Возрастные группы, частота зарегистрированных случаев
Age groups, years/Возрастные группы, лет
20–29
30–39
40–49
50–59
60–69
70–79
Total/Всего
Frequency/Частота
1 (0.89 %)
15 (13.39 %)
33 (29.46 %)
24 (21.42 %)
26 (23.21 %)
13 (11.60 %)
112 (100 %)
Note: created by the authors.
Примечание: таблица составлена авторами.
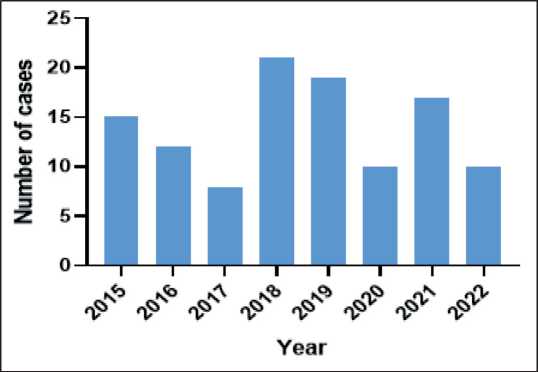
Fig. 1. Annual cervical cancer cases were reported at CENAR Hospital Quetta from 2015 to 2022. Note: created by the authors Рис. 1. Погодовое число первичных случаев РМШ в больнице
CENAR в Кветте, в период с 2015 по 2022 г.. Примечание: рисунок выполнен авторами
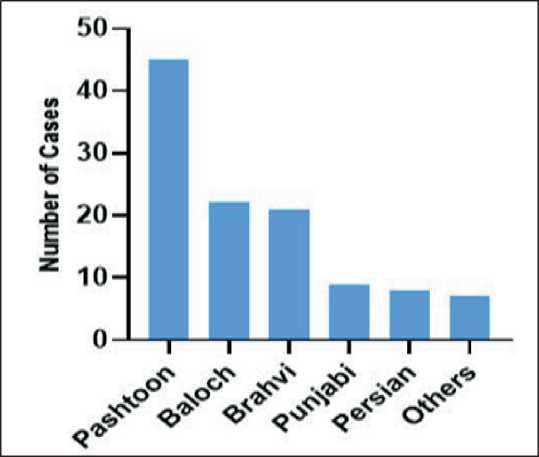
Fig. 2. Different ethnic groups of reported cases at CENAR hospital from 2015–2022. Note: created by the authors Рис. 2. Этнические группы больных РШМ, зарегистрированных в больнице CENAR с 2015 по 2022 г. Примечание: рисунок выполнен авторами
29 % of the total patients. The least number of cases occurred in the 20–29 age range. The details of age distribution are presented in Table 1.
The 112 reported instances of cervical cancer were distributed across various ethnic backgrounds, with Pashtoon patients making up the largest group. A detailed ethnic distribution is presented in Fig.2.
The patient presented with symptoms including vaginal bleeding, post-menopausal bleeding, pelvic pain, and vaginal discharge. The most common initial symptom was vaginal bleeding. However, a detailed symptom distribution is shown in Fig. 3.
Between 2015 and 2022, patients from various cities in Balochistan were admitted to CENAR, with Quetta reporting the highest number of cases (42 %). A small number of cases were recorded from other provinces of Pakistan and Afghanistan. The full regional distribution is shown in Fig. 4.
Patients underwent a series of tests and procedures, including complete blood counts (CBC), blood sugar analysis, comprehensive urine examination, computed tomography (CT) scan, and ultrasound. Doctors utilized the FIGO (International Federation of Gynecology and Obstetrics) staging approach to categorize the condition. There were no patients diagnosed at stage I. The majority of cases were classified as stage IV
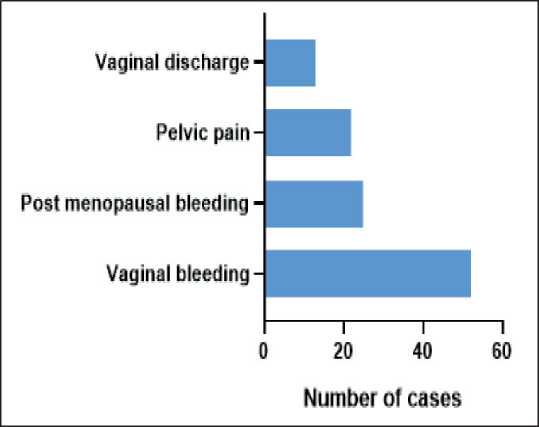
Fig. 3. Presenting symptoms of cervical cancer cases reported from 2015–2022, the most common presenting symptom was vaginal bleeding. Note: created by the authors
Рис. 3. Симптомы рака шейки матки, выявленного в период с 2015 по 2022 г. Примечание: рисунок выполнен авторами
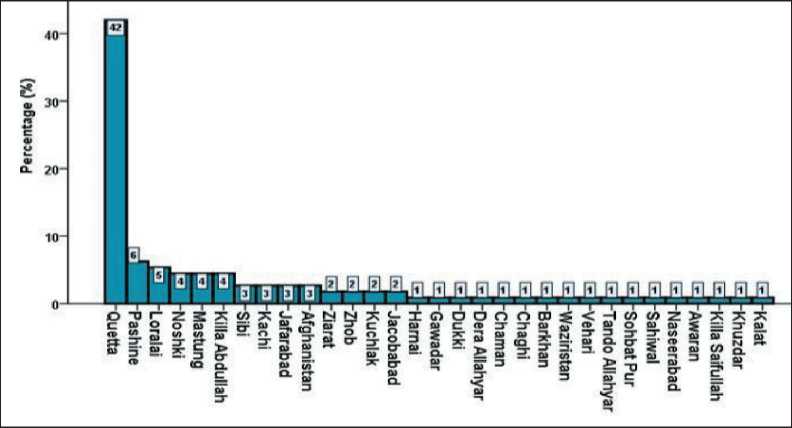
Fig. 4. Percentage of reported cases from different cities. Most cases were reported from Quetta City, which is 42 % of all cases. Note: created by the authors Рис. 4. Процент зарегистрированных случаев РШМ из разных городов. Большинство пациенток проживало в г. Кветта – 42 % случаев. Примечание: рисунок выполнен авторами
Types of cervical cancer
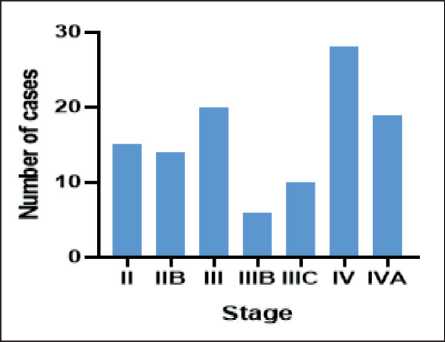
Fig. 5. Number of reported cases according to the FIGO staging system during 2015–2022. Note: created by the authors Рис. 5. Распределение РШМ, выявленных в 2015–2022 гг., по стадиям FIGO. Примечание: рисунок выполнен авторами
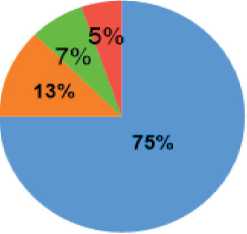
^ Squamous cell carcinoma im Adenocarcinoma
■■ Adenosquamous carcinoma e Poorly differentiated carcinoma
Fig. 6. Pie chart showing the percentage of cervical cancer types in reported cases. Note: created by the authors Рис. 6. Соотношение гистологических типов рака шейки матки. Примечание: рисунок выполнен авторами
(25 %), further staging details are shown in Fig. 5.
In our study, squamous cell carcinoma was reported as the most common histological type, accounting for 75 % of cases. Further histological details are shown in Fig. 6.
Genomic analysis
In our study, the genomic analysis of IL-10 gene polymorphism (rs1800872) showed no significant association with cervical cancer in the Pakistani community of Quetta, Balochistan (p=0.32). The frequency of the minor allele (A) was higher in cases compared to controls, while the major allele (C) was more prevalent in controls. Detailed genotype and allele distributions along with dominant and recessive model analyses are presented in Table 2.
Furthermore, the genomic analysis of IL-10 gene polymorphism (rs1800896) showed no significant association with cervical cancer in the Pakistani community of Quetta, Balochistan (p=0.42). The minor allele (A) was slightly less frequent in cases compared to controls, while the major allele (G) was more prevalent in cases. Detailed genotype and allele distributions along with dominant and recessive model analyses are presented in Table 3.
The TETRA primer ARMS-PCR results display all bands on a single gel, consisting of a shared band representing the gene and two distinct bands of varying sizes indicating the allele. The IL-10 gene polymorphism (rs1800872) has a shared band of 425 bp (base pairs). The A allele is represented by a band of 368 bp, while the C allele is produced at a site of 211 bp (Fig. 7).
The IL-10 gene polymorphism (rs1800896) has a shared band of 433 bp. The A allele is represented by a band at 292 bp, while the G allele is shown by a band at 199 bp (Fig. 8).
Genotype frequencies for IL 10 polymorphisms (rs1800872 and rs1800896) were evaluated for compliance with Hardy–Weinberg equilibrium (HWE) using chi-square tests in both cases and controls. For rs1800872, significant deviations from HWE were observed in cases (p=0.0012) and controls (p=0.0002). Similarly, for rs1800896, the deviations were significant in both cases (p=0.0003) and controls (p=0.025). These deviations likely reflect underlying population stratification or sampling variability rather than technical errors, as all genotyping was performed under strict quality control. However, the association analysis using logistic regression was conducted separately.
Table 2/Таблица 2
|
Genotype/Генотип |
Status/Статус |
χ2 |
p-value |
OR (95 % CI) |
|
|
Cases/ Число случаев рака |
Controls/ Число контрольных случаев |
||||
|
CC |
18 (36 %) |
25 (50 %) |
|||
|
AA |
20 (40 %) |
15 (30 %) |
0.98 |
0.32ns |
1.31 (0.42–3.91) |
|
CA |
12 (24 %) |
10 (20 %) |
|||
|
C |
48 (48 %) |
60 (60 %) |
1.02 |
0.31ns |
1.30 (0.32–3.61) |
|
A |
52 (52 %) |
40 (40 %) |
|||
|
Dominant Model (CA + AA vs CC)/ Доминантная модель (CA + AA vs CC) |
32 (64 %) |
25 (50 %) |
1.52 |
0.22ns |
1.78 (0.80 – 3.96) |
|
Recessive Model (AA vs CA + CC)/ Рецессивная модель(AA vs CA + CC) |
30 (60 %) |
35 (70 %) |
0.70 |
0.40ns |
0.67 (0.31 – 1.45) |
Notes: p-value=0.05, ns – non-significant; created by the authors.
Примечания: p-value=0,05, ns – незначимые различия; таблица составлена авторами.
Table 3/Таблица 3
|
Genotype/Генотип |
Status/Статус |
χ2 |
p-value |
OR (95 % CI) |
|
|
Cases/ Число случаев рака |
Controls/ Число контрольных случаев |
||||
|
GG |
23 (46 %) |
18 (36 %) |
|||
|
AA |
15 (30 %) |
15 (30 %) |
1.47 |
0.42ns |
1.00 (0.52–4.91) |
|
AG |
12 (24 %) |
17 (34 %) |
|||
|
G |
58 (58 %) |
53 (53 %) |
0.32 |
0.41ns |
1.50 (0.41–4.61) |
|
A |
42 (42 %) |
47 (47 %) |
|||
|
Dominant Model (AG + AA vs GG)/ Доминантная модель (AG + AA vs GG) |
27 (54 %) |
32 (64 %) |
0.66 |
0.31ns |
0.64 (0.30 – 1.37) |
|
Recessive Model (AA vs AG + GG)/ Рецессивная модель (AA vs AG + GG) |
35 (70 %) |
35 (70 %) |
0.00 |
1.00ns |
1.00 (0.44 – 2.30) |
Notes: p-value=0.05, ns – non-significant; created by the authors.
Примечания: p-value=0,05, ns – незначимые различия; таблица составлена авторами.
Genotype and allele frequency for IL-10 gene polymorphism (rs1800872)
Генотип и частота аллелей для полиморфизма гена IL-10 (rs1800872)
Genotype and allele frequency for IL-10 gene polymorphism (rs1800896)
Генотип и частота аллелей для полиморфизма гена IL-10 (rs1800896)
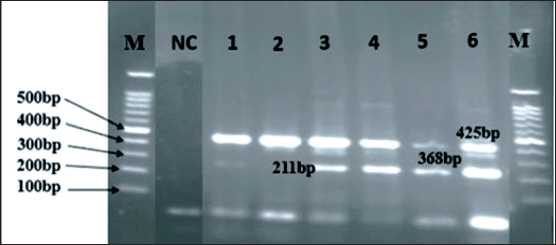
Fig. 7. Agarose gel (1.5 %) representing the IL-10 gene polymorphism (rs1800872): M lane – DNA ladder (100bp);
NC lane – negative control; lanes 1 and 2 – CC (homozygous dominant); lanes 3, 4, and 6 – CA (heterozygous); lane
5 – AA (homozygous recessive). Note: created by the authors Рис. 7. Агарозный гель (1,5 %), представляющий полиморфизм гена IL-10 (rs1800872): полоса M – ДНК-лестница (100 п.н.); полоса NC – отрицательный контроль; полосы 1 и
2 – CC (гомозиготный доминантный), полосы 3, 4 и 6 – CA (гетерозиготный); полоса 5 – AA (гомозиготный рецессивный).
Примечание: рисунок выполнен авторами
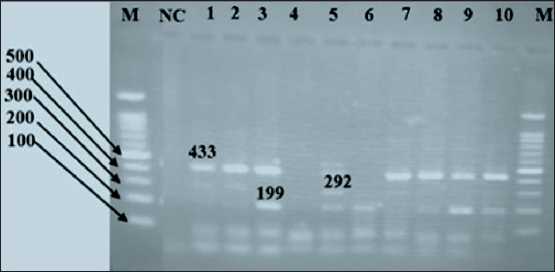
Fig. 8. Agarose gel (1.5 %) representing the IL-10 gene polymorphism (rs1800896): M lane – DNA ladder (100 bp); NC lane –negative control; lane 3, 6, 8, 9 and 10 – GG (homozygous dominant); lane 5 AG (heterogeneous); lane 1, 2 and
7 – AA (homozygous recessive). Note: created by the authors Рис. 8. Агарозный гель (1,5 %), представляющий полиморфизм гена IL-10 (rs1800896): полоса M – ДНК-лестница (100 п.н.); полоса NC – отрицательный контроль; полосы 3, 6, 8, 9 и 10 – GG (гомозиготный доминантный); полоса 5 AG (гетерогенный); полосы 1, 2 и 7 – AA (гомозиготный рецессивный).
Примечание: рисунок выполнен авторами
Risk factors
A multinomial logistic regression approach was employed to assess the relationships between various risk factors. The genotype was chosen as the dependent variable and divided into three categories. The IL-10 gene variant (rs1800872) was classified into three genotype groups: CC, AA, and CA. The CA genotype was used as the reference. The IL-10 gene variant (rs1800896) was classified into three genotype groups: GG, AA, and GA. The GA genotype was used as the reference. Additionally, dominant and recessive model analyses were conducted for each risk factor.
This study analyzed demographic factors concerning IL-10 gene polymorphisms (rs1800872 and rs1800896). No significant correlation was observed between genotypes and age groups or menopause timing. However, for rs1800896, the Pashtoon ethnic group showed a significant association with the GG genotype (p=0.02), and menarche after age 13 was linked to the GG genotype (p=0.01). Detailed results are presented in Tables 4 and 5.
A comprehensive analysis of IL-10 gene polymorphisms (rs1800872 and rs1800896) revealed significant associations with lifestyle factors. For rs1800872, contraceptive drug use and smoking were strongly linked to the AA genotype (p=0.03). For rs1800896, a sedentary lifestyle showed a significant correlation with the AA genotype (p=0.03), while smoking was notably associated with the GG genotype (p=0.04). Detailed results are presented in Tables 6 and 7.
In addition to the general association model, we conducted dominant and recessive model analyses to further assess the genetic risk stratified by demographic and clinical parameters. For rs1800872, the dominant model (AA + CA vs CC) did not show significant associations across most subgroups. However, the recessive model (AA vs CA + CC) revealed significant associations with smoking status (p=0.0130, OR=4.00, 95 % CI=1.34–11.97) and contraceptive use (p=0.0262, OR=5.50, 95 % CI=1.23–24.81), suggesting that individuals with the AA genotype may have an increased risk of cervical cancer in the presence of these risk factors (Table 6).
Additionally, for rs1800896 in the exercise group (AA + AG vs GG), a significant association was observed (p=0.04, OR=0.86, 95 % CI=0.32–2.28). Similarly, in the smoking group (AA + AG vs GG), the association was statistically significant (p=0.02, OR=1.14, 95 % CI=0.36–3.65). Moreover, the menarche subgroup (p=0.01, OR=1.00, 95 % CI=2.00–3.00) also demonstrated a potential association (Table 7).
These results contribute to the growing body of literature on genetic predisposition to cervical cancer and highlight the potential modifying effects of environmental and lifestyle factors. Further investigations with larger sample sizes and diverse populations are needed to validate these findings.
Discussion
Deadly cervical cancer affects women of all ages in Pakistan [10]. The outcomes of the present study indicate that cervical cancer affects women of all age groups. Based on data spanning from 2015 to 2022, instances of cervical cancer were documented across various age demographics. Nevertheless, the age range of 40–49 accounted for the bulk of instances, representing around 29 % of the total number of cases (Table 1). The majority of women diagnosed with cervical cancer are inhabitants of developing nations [11]. The exact occurrence and frequency rates are uncertain in Pakistan due to the lack of regular screening and preventive measures for cervical cancer. Many studies have unreliable epidemiological data due to limited populations, small-scale investigations, and a focus solely on registered cases [12].
Human papillomavirus (HPV) is a significant public health concern in Pakistan, particularly with cervical cancer. Studies have reported varying prevalence rates of HPV among Pakistani women. Approximately 0.5 % of women in the general population harbor cervical HPV-16/18 infections, with 88.1 % of invasive cervical cancers attributed to these types. Research indicates that 87.5 % of invasive cervical cancer cases are HPV-DNA positive, with HPV16 being the most common type (67.3 %), followed by HPV18 (10.2 %) [13].
Another study reported that 94.81 % of cervical lesions were positive for HPV, with single infections of HPV16 detected in 24.68 % of total samples and HPV18 in 25.97 %, while 40.26 % of samples showed co-infection with both HPV16 and 18. A systematic review found an overall HPV prevalence of 23.1 % among Pakistani women, with the highest prevalence observed among cervical cancer cases (80.4 %). Additionally, high-risk HPV DNA was detected in 16.9 % of cases, with a strong correlation between HPV positivity and neoplasia in women tested in Pakistan. These findings highlight the critical need for robust HPV vaccination and screening programs in Pakistan to mitigate the burden of cervical cancer [14].
The diagnosis of cervical cancer can be made through the use of a Pap smear and by conducting biopsies on the cervical tissues. Conization, also known as a cone biopsy, is employed to assess invasiveness when a cervical biopsy fails to ascertain the presence of the disease. Adenocarcinoma in situ, which specifically impacts hard-to-sample areas of the cervix, reduces the effectiveness of cervical cytologic screening methods in detecting the illness [15].
In our study, vaginal bleeding was the most common initial symptom (46 %), followed by post-menopausal bleeding, pelvic pain, and vaginal discharge, highlighting the need for early symptom recognition (Fig. 3). Another study suggests that around 80–90 % of individuals diagnosed with cervical cancer encounter some type of unusual vaginal bleeding, such as bleeding after menopause, irregular menstrual cycles, heavy periods, painless bleeding between periods, or bleeding after sexual intercourse. Approximately 10 % of patients
Table 4/Таблица 4
Analysis of the IL-10 gene polymorphism (rs1800872), age, ethnicity, age at menarche, and menopause of cases and controls
Анализ полиморфизма гена IL-10 (rs1800872) в зависимости от возраста, этнической принадлежности, сроков наступления менархе и менопаузы
|
Parameters/ Параметры |
Genotype/ Генотип |
Cases/ Количество больных |
Controls/ Количество лиц в контрольной группе |
χ2 |
р-value |
OR (95 %CI) |
|
Age, years/Возраст, лет |
||||||
|
CC |
12 (33 %) |
10 (43 %) |
0.89 |
0.34ns |
1.46 (0.38–3.13) |
|
|
Above 45 years/ Старше 45 |
AA |
15 (42 %) |
8 (35 %) |
0.59 |
0.44ns |
1.36 (0.63–2.97) |
|
CA |
9 (25 %) |
5 (22 %) |
– |
1.00 (Ref) |
||
|
Dominant Model/ |
||||||
|
Доминантная модель |
(AA + CA vs CC) |
24 (67 %) |
13 (57 %) |
0.77 |
0.38ns |
1.52 (0.60–3.85) |
|
Recessive Model/ |
||||||
|
Рецессивная модель |
(AA vs CA + CC) |
21 (58 %) |
15 (65 %) |
0.05 |
0.83ns |
1.12 (0.41–3.10) |
|
CC |
5 (36 %) |
11 (41 %) |
0.91 |
0.35ns |
1.57 (0.61–4.05) |
|
|
Below 45 years/ |
||||||
|
моложе 45 |
AA |
6 (43 %) |
10 (37 %) |
0.60 |
0.47ns |
1.43 (0.54–3.75) |
|
CA |
3 (21 %) |
6 (22 %) |
– |
1.00 (Ref) |
||
|
Dominant Model/ |
||||||
|
Доминантная модель |
(AA + CA vs CC) |
9 (64 %) |
16 (59 %) |
0.14 |
1.00ns |
1.24 (0.33–4.71) |
|
Recessive Model/ |
||||||
|
Рецессивная модель |
(AA vs CA + CC) |
8 (57 %) |
17 (63 %) |
0.51 |
0.32ns |
2.27 (0.47–10.92) |
|
Ethnicity/Этническая принадлежность |
||||||
|
CC |
6 (32 %) |
4 (31 %) |
0.60 |
0.44ns |
1.50 (0.54–4.21) |
|
|
Pashtoon/ Пуштуны |
AA |
7 (36 %) |
6 (46 %) |
1.46 |
0.23ns |
1.83 (0.68–4.96) |
|
CA |
6 (32 %) |
3 (23 %) |
– |
1.00 (Ref) |
||
|
Dominant Model/ |
||||||
|
Доминантная модель |
(AA + CA vs CC) |
13 (68 %) |
9 (69 %) |
0.07 |
1.00ns |
0.96 (0.21–4.42) |
|
Recessive Model/ |
||||||
|
Рецессивная модель |
(AA vs CA + CC) |
12 (63 %) |
7 (54 %) |
0.34 |
0.57ns |
1.50 (0.45–5.02) |
|
CC |
2 (28 %) |
3 (44 %) |
1.00ns |
1.00 (0.53–4.21) |
||
|
Baloch/ |
0.08 |
|||||
|
Белуджи |
AA |
3 (44 %) |
2 (28 %) |
0.71ns |
1.83 (0.78–4.96) |
|
|
CA |
2 (28 %) |
2 (28 %) |
– |
1.00 (Ref) |
||
|
Dominant Model/ |
||||||
|
Доминантная модель |
(AA + CA vs CC) |
5 (72 %) |
4 (56 %) |
0.14 |
1.00ns |
1.00 (0.20–5.07) |
|
Recessive Model/ |
||||||
|
Рецессивная модель |
(AA vs CA + CC) |
4 (44 %) |
5 (72 %) |
0.16 |
1.00ns |
0.64 (0.10–4.11) |
|
CC |
3 (33 %) |
5 (45 %) |
1.65 |
0.12ns |
3.50 (0.73–16.85) |
|
|
Brahvi/ Брахви |
AA |
4 (44 %) |
2 (18 %) |
1.30 |
0.18ns |
3.00 (0.61–14.86) |
|
CA |
2 (23 %) |
4 (37 %) |
– |
1.00 (Ref) |
||
|
Dominant Model/ |
||||||
|
Доминантная модель |
(AA + CA vs CC) |
6 (67 %) |
6 (55 %) |
0.08 |
0.67ns |
1.67 (0.54–5.17) |
|
Recessive Model/ |
||||||
|
Рецессивная модель |
(AA vs CA + CC) |
5 (36 %) |
9 (64 %) |
0.10 |
1.00ns |
0.43 (0.10–1.89) |
|
CC |
4 (44 %) |
5 (50 %) |
0.38 |
0.42ns |
2.00 (0.37–10.92) |
|
|
Punjabi/ Пенджаби |
AA |
3 (33 %) |
3 (30 %) |
0,27 |
0.57ns |
0.50 (0.05–5.51) |
|
CA |
2 (23 %) |
2 (20 %) |
– |
1.00 (Ref) |
||
|
Dominant Model/ |
||||||
|
Доминантная модель |
(AA + CA vs CC) |
5 (56 %) |
5 (50 %) |
0.25 |
1.00ns |
1.25 (0.21–7.62) |
|
Recessive Model/ |
||||||
|
Рецессивная модель |
(AA vs CA + CC) |
6 (67 %) |
7 (70 %) |
0.23 |
1.00ns |
1.17 (0.17–8.09) |
|
End of Table 4/Îêîнчàниå тàблицы 4 |
||||||
|
Parameters/ Параметры |
Genotype/ Генотип |
Controls/ |
||||
|
Количество больных |
Количество лиц в контрольной группе |
χ2 |
р-value |
OR (95 %CI) |
||
|
Any other/ Другие |
CC |
3 (50 %) |
3 (33 %) |
0.11 |
0.74ns |
0.80 (0.22–2.98) |
|
AA |
2 (33 %) |
2 (23 %) |
0.49 |
0.48ns |
0.60 (0.14–2.51) |
|
|
CA |
1 (17 %) |
4 (44 %) |
– |
1.00 (Ref) |
||
|
Dominant Model/ |
||||||
|
Доминантная модель |
(AA + CA vs CC) |
3 (50 %) |
6 (67 %) |
0.24 |
0.62ns |
0.50 (0.21–2.35) |
|
Recessive Model/ Рецессивная модель |
(AA vs CA + CC) |
4 (67 %) |
7 (78 %) |
0.29 |
1.00ns |
1.75 (0.18–10.63) |
|
Menarche/Менархе |
||||||
|
CC |
10 (33 %) |
14 (42 %) |
1.32 |
0.39ns |
1.36 (0.68–2.71) |
|
|
Above 13 years/ Старше 13 лет |
AA |
12 (40 %) |
9 (26 %) |
1.41 |
0.59ns |
1.21 (0.59–2.46) |
|
CA |
8 (27 %) |
11 (32 %) |
– |
1.00 (Ref) |
||
|
Dominant Model/ |
||||||
|
Доминантная модель |
(AA + CA vs CC) |
20 (67 %) |
20 (58 %) |
0.26 |
0.61ns |
1.40 (0.66 – 1.92) |
|
Recessive Model/ Рецессивная модель |
(AA vs CA + CC) |
18 (60 %) |
25 (74 %) |
1.10 |
0.29ns |
1.85 (0.57 – 3.95) |
|
CC |
9 (47 %) |
4 (25 %) |
0.67 |
0.26ns |
2.00 (0.60–6.64) |
|
|
Below 13 years/ Моложе 13 лет |
AA |
7 (37 %) |
7 (44 %) |
0.67 |
0.26ns |
2.00 (0.60–6.64) |
|
CA |
3 (16 %) |
5 (31 %) |
– |
1.00 (Ref) |
||
|
Dominant Model/ |
||||||
|
Доминантная модель |
(AA + CA vs CC) |
10 (53 %) |
12 (75 %) |
1.13 |
0.29ns |
0.37 (0.35–1.45) |
|
Recessive Model/ Рецессивная модель |
(AA vs CA + CC) |
12 (63 %) |
9 (56 %) |
0.11 |
0.74ns |
0.75 (0.29 – 2.58) |
|
Menopause/Менопауза |
||||||
|
CC |
5 (38 %) |
3 (33 %) |
0.29 |
0.59ns |
1.33 (0.46–3.84) |
|
|
Below 55 years/ Моложе 55 лет |
AA |
6 (47 %) |
2 (22 %) |
0.60 |
0.44ns |
1.50 (0.53–4.21) |
|
CA |
2 (15 %) |
4 (45 %) |
– |
1.00 (Ref) |
||
|
Dominant Model/ |
||||||
|
Доминантная модель |
(AA + CA vs CC) |
8 (62 %) |
6 (67 %) |
0.09 |
1.00ns |
0.80 (0.13–4.75) |
|
Recessive Model/ Рецессивная модель |
(AA vs CA + CC) |
7 (54 %) |
7 (78 %) |
0.07 |
1.00ns |
1.00 (0.23–4.40) |
|
CC |
4 (24 %) |
5 (50 %) |
0.11 |
0.74ns |
1.25 (0.34–4.66) |
|
|
Above 55 years/ Старше 55 лет |
AA |
8 (47 %) |
3 (30 %) |
0.11 |
0.74ns |
1.25 (0.34–4.66) |
|
CA |
5 (29 %) |
2 (20 %) |
– |
1.00 (Ref) |
||
|
Dominant Model/ |
||||||
|
Доминантная модель |
(AA + CA vs CC) |
13 (76 %) |
5 (50 %) |
1.50 |
0.22ns |
3.25 (0.61–17.28) |
|
Recessive Model/ Рецессивная модель |
(AA vs CA + CC) |
9 (53 %) |
7 (70 %) |
0.90 |
1.00ns |
1.00 (0.25–4.04) |
Notes: p-value=0.05, ns – non-significant; created by the authors.
Примечания: p-value=0,05, ns – незначимые различия; таблица составлена авторами.
Table 5/Таблица 5
Analysis of the IL-10 gene polymorphism (rs1800896), age, ethnicity, age at menarche, and menopause of cases and controls
Анализ полиморфизма гена IL-10 (rs1800896) в зависимости от возраста, этнической принадлежности, возраста наступления менархе и менопаузы
|
Parameters/ Параметры |
Genotype/ Генотип |
Cases/ Количество больных |
Controls/ |
р-value |
OR (95 %CI) |
|
|
Количество лиц в контрольной группе |
χ2 |
|||||
|
Age/Возраст |
||||||
|
Above 45 years/ |
GG |
16 (44 %) |
12 (46 %) |
0.09 |
0.09ns |
2.00 (0.89–4.45) |
|
Старше 45 лет |
AA |
14 (39 %) |
8 (31 %) |
0.45 |
0.23ns |
1.67 (0.73–3.81) |
|
AG |
6 (17 %) |
6 (23 %) |
– |
1.00 (Ref) |
||
|
Dominant Model/ |
||||||
|
Доминантная модель |
(AA + AG vs GG) |
20 (56 %) |
14 (54 %) |
0.19 |
1.00ns |
1.07 (0.39–2.95) |
|
Recessive Model/ Рецессивная модель |
(AA vs GG + AG) |
22 (61 %) |
18 (69 %) |
1.41 |
1.00ns |
1.00 (0.41–2.41) |
|
Below 45 years/ Моложе 45 лет |
GG |
5 (36 %) |
8 (33 %) |
0.39 |
0.39ns |
1.44 (0.62–3.38) |
|
AA |
4 (28 %) |
7 (29 %) |
0.59 |
0.44ns |
0.67 (0.24–1.88) |
|
|
AG |
5 (36 %) |
9 (30 %) |
– |
1.00 (Ref) |
||
|
Dominant Model/ |
||||||
|
Доминантная модель |
(AA + AG vs GG) |
9 (64 %) |
16 (67 %) |
0.19 |
1.00ns |
0.90 (0.23–3.59) |
|
Recessive Model/ Рецессивная модель |
(AA vs GG + AG) |
10 (71 %) |
17 (71 %) |
0.12 |
1.00ns |
1.00 (0.33–3.02) |
|
Ethnicity/Этническая принадлежность |
||||||
|
Pashtoon/ Пуштуны |
GG |
11 (69 %) |
6 (40 %) |
5.68 |
0.02* |
9.50 (2.21–40.78) |
|
AA |
3 (19 %) |
4 (27 %) |
3.27 |
0.07ns |
2.50 (0.48–12.89) |
|
|
AG |
2 (12 %) |
5 (33 %) |
– |
1.00 (Ref) |
||
|
Dominant Model/ |
||||||
|
Доминантная модель |
(AA + AG vs GG) |
5 (31 %) |
9 (60 %) |
0.16 |
0.16ns |
0.30 (0.07–1.33) |
|
Recessive Model/ Рецессивная модель |
(AA vs GG + AG) |
13 (81 %) |
11 (73 %) |
0.18 |
1.00ns |
1.00 (0.32–3.11) |
|
GG |
3 (38 %) |
5 (56 %) |
0.10 |
0.71ns |
1.33 (0.29–5.96) |
|
|
Белуджи |
AA |
2 (24 %) |
2 (22 %) |
0.37 |
1.00ns |
1.00 (0.20–4.95) |
|
AG |
3 (38 %) |
2 (22 %) |
– |
1.00 (Ref) |
||
|
Dominant Model/ |
||||||
|
Доминантная модель |
(AA + AG vs GG) |
5 (62 %) |
4 (44 %) |
0.09 |
0.43ns |
2.08 (0.31–13.9) |
|
Recessive Model/ Рецессивная модель |
(AA vs GG + AG) |
6 (75 %) |
7 (78 %) |
0.31 |
0.89ns |
1.18 (0.13–10.2) |
|
Brahvi/ Брахви |
GG |
3 (38 %) |
6 (55 %) |
0.54 |
0.74ns |
1.25 (0.34–4.65) |
|
AA |
3 (38 %) |
3 (27 %) |
0.41 |
0.53ns |
1.50 (0.42–5.31) |
|
|
AG |
2 (24 %) |
2 (18 %) |
– |
1.00 (Ref) |
||
|
Dominant Model/ |
||||||
|
Доминантная модель |
(AA + AG vs GG) |
5 (63 %) |
5 (46 %) |
0.54 |
0.65ns |
2.00 (0.31–12.84) |
|
Recessive Model/ Рецессивная модель |
(AA vs GG + AG) |
5 (63 %) |
8 (73 %) |
0.22 |
1.00ns |
1.00 (0.21–4.86) |
|
Punjabi/ Пенджаби |
GG |
2 (29 %) |
2 (29 %) |
0.40 |
0.34ns |
0.33 (0.03–3.20) |
|
AA |
3 (42 %) |
2 (29 %) |
0.90 |
1.00ns |
1.00 (0.20–4.95) |
|
|
AG |
2 (29 %) |
3 (42 %) |
– |
1.00 (Ref) |
||
|
Dominant Model/ |
||||||
|
Доминантная модель |
(AA + AG vs GG) |
5 (71 %) |
5 (71 %) |
0.30 |
1.00ns |
1.00 (0.10–10.08) |
|
Recessive Model/ Рецессивная модель |
(AA vs GG + AG) |
4 (57 %) |
5 (71 %) |
0.32 |
0.61ns |
1.88 (0.20–16.90) |
|
Any other/ Другое |
GG |
3 (27 %) |
3 (38 %) |
1.79 |
0.18ns |
0.33 (0.07–1.65) |
|
AA |
5 (46 %) |
2 (24 %) |
0.39 |
0.53ns |
0.67 (0.19–2.36) |
|
|
AG |
3 (27 %) |
3 (38 %) |
– |
1.00 (Ref) |
||
|
Dominant Model/ |
||||||
|
Доминантная модель |
(AA + AG vs GG) |
8 (73 %) |
5 (62 %) |
0.30 |
0.58ns |
1.64 (0.28–9.41) |
End of Table 5/Окончание таблицы 5
|
Parameters/ Параметры |
Genotype/ Генотип |
Cases/ Количество больных |
Controls/ Количество лиц в контрольной группе |
χ2 |
р-value |
OR (95 %CI) |
|
Menarche/Менархе |
||||||
|
Above 13 years/ |
GG |
15 (50 %) |
16 (44 %) |
6.63 |
0.01* |
1.00 (2.00–3.00) |
|
Старше 13 лет |
AA |
10 (33 %) |
12 (32 %) |
3.42 |
0.06ns |
2.25 (0.98–5.17) |
|
AG |
5 (17 %) |
9 (24 %) |
– |
1.00 (Ref) |
||
|
Dominant Model/ |
||||||
|
Доминантная модель |
(AA + AG vs GG) |
15 (50 %) |
21 (68 %) |
6.63 |
0.01* |
1.44 (1.16–1.22) |
|
Recessive Model/ Рецессивная модель |
(AA vs GG + AG) |
20 (67 %) |
25 (68 %) |
0.09 |
0.91ns |
1.06 (0.39–2.86) |
|
Below 13 years/ Моложе 13 лет |
GG |
9 (23 %) |
3 (23 %) |
0.10 |
0.47ns |
0.70 (0.27–1.84) |
|
AA |
6 (31 %) |
4 (31 %) |
0.09 |
0.07ns |
0.30 (0.09–1.09) |
|
|
AG |
5 (46 %) |
6 (46 %) |
– |
1.00 (Ref) |
||
|
Dominant Model/ |
||||||
|
Доминантная модель |
(AA + AG vs GG) |
11 (69 %) |
10 (77 %) |
0.31 |
0.59ns |
0.67 (0.15–2.94) |
|
Recessive Model/ Рецессивная модель |
(AA vs GG + AG) |
14 (69 %) |
9 (69 %) |
0.43 |
1.00ns |
1.00 (0.21–4.66) |
|
Menopause/Менопауза |
||||||
|
GG |
11 (41 %) |
12 (41 %) |
0.29 |
0.59ns |
1.33 (0.46–3.84) |
|
|
Above 55 years/ Старше 55 лет |
AA |
7 (26 %) |
8 (28 %) |
0.60 |
0.44ns |
1.50 (0.53–4.221) |
|
AG |
9 (33 %) |
9 (31 %) |
– |
1.00 (Ref) |
||
|
Dominant Model/ |
||||||
|
Доминантная модель |
(AA + AG vs GG) |
16 (59 %) |
17 (59 %) |
0.40 |
1.00ns |
1.00 (0.38–2.65) |
|
Recessive Model/ Рецессивная модель |
(AA vs GG + AG) |
20 (74 %) |
21 (72 %) |
0.07 |
0.85ns |
0.90 (0.30–2.69) |
|
Below 55 years/ Моложе 55 лет |
GG |
4 (36 %) |
4 (33 %) |
0.11 |
0.74ns |
1.25 (0.34–4.65) |
|
AA |
4 (36 %) |
3 (25 %) |
0.11 |
0.74ns |
1.25 (0.34–4.65 |
|
|
AG |
3 (28 %) |
5 (42 %) |
– |
1.00 (Ref) |
||
|
Dominant Model/ |
||||||
|
Доминантная модель |
(AA + AG vs GG) |
7 (64 %) |
8 (67 %) |
0.06 |
0.89ns |
0.87 (0.14–5.26) |
|
Recessive Model/ Рецессивная модель |
(AA vs GG + AG) |
7 (64 %) |
9 (75 %) |
0.33 |
0.57ns |
1.67 (0.29–9.64) |
Notes: p-value=0.05; ns – non-significant; * – significant association; created by the authors.
Примечания: p-value=0,05; ns – незначимые различия; * – значимые различия; таблица составлена авторами.
Table 6/Таблица 6
Analysis of IL-10 gene polymorphism (rs1800872), exercise, smoking status, number of children, and use of contraceptive drugs
Анализ полиморфизма гена IL-10 (rs1800872) в зависимости от физической активности, статуса курения, количества детей и использования противозачаточных препаратов
|
Parameters/ Параметры |
Genotype/ Генотип |
Cases/ Количество больных |
Controls/ Количество лиц в контрольной группе |
χ2 |
р-value |
OR (95 %CI) |
|
Exercise/Физическая активность |
||||||
|
CC |
6 (43 %) |
10 (38 %) |
0.52 |
0.47ns |
1.43 (0.54–3.75) |
|
|
Yes/Да |
AA |
5 (36 %) |
9 (35 %) |
0.25 |
0.62ns |
1.29 (0.48–3.45) |
|
CA |
3 (21 %) |
7 (27 %) |
– |
1.00 (Ref) |
||
|
Dominant Model/ Доминантная модель |
(AA + CA vs CC) |
8 (57 %) |
16 (62 %) |
0.10 |
0.75ns |
0.80 (0.20–3.10) |
|
Recessive Model/ Рецессивная модель |
(AA vs CC + CA) |
9 (64 %) |
17 (65 %) |
0.21 |
0.95ns |
1.04 (0.26–4.11) |
|
CC |
15 (42 %) |
10 (42 %) |
1.27 |
0.26ns |
1.55 (0.72–3.29) |
|
|
No/Нет |
AA |
14 (39 %) |
6 (25 %) |
0.93 |
0.34ns |
1.46 (0.66–3.13) |
|
CA |
7 (19 %) |
8 (33 %) |
– |
1.00 (Ref) |
||
|
Dominant Model/ Доминантная модель |
(AA + CA vs CC) |
21 (58 %) |
14 (58 %) |
0.30 |
1.00ns |
1.00 (0.40–2.52) |
End of Table 6/Окончание таблицы 6
|
Parameters/ Параметры |
Genotype/ Генотип |
Cases/ Количество больных |
Controls/ Количество лиц в контрольной группе |
χ2 |
р-value |
OR (95 %CI) |
|
Recessive Model/ Рецессивная модель |
(AA vs CC + CA) |
22 (61 %) |
18 (75 %) |
1.46 |
0.23ns |
1.94 (0.64–5.88) |
|
Smoking status/Статус курения |
||||||
|
Smokers/ Курящие |
CC |
8 (28 %) |
6 (35 %) |
1.27 |
0.26ns |
2.00 (0.60–6.64) |
|
AA |
15 (52 %) |
8 (47 %) |
6.63 |
0.01* |
4.00 (1.34–11.97) |
|
|
CA |
6 (20 %) |
3 (18 %) |
– |
1.00 (Ref) |
||
|
Dominant Model/ |
||||||
|
Доминантная модель |
(AA + CA vs CC) |
21 (72 %) |
11 (65 %) |
0.22 |
0.64ns |
1.36 (0.38–4.82) |
|
Recessive Model/ Рецессивная модель |
(AA vs CC + CA) |
14 (48 %) |
9 (53 %) |
6.63 |
0.01* |
4.00 (1.34–11.97) |
|
Non-smokers/ |
CC |
9 (43 %) |
15 (46 %) |
0.39 |
0.39ns |
1.36 (0.68–2.71) |
|
Некурящие |
AA |
7 (33 %) |
9 (27 %) |
1.07 |
0.30ns |
0.64 (0.28–1.48) |
|
CA |
5 (24 %) |
9 (27 %) |
– |
1.00 (Ref) |
||
|
Dominant Model/ |
||||||
|
Доминантная модель |
(AA + CA vs CC) |
12 (57 %) |
18 (54 %) |
0.06 |
0.81ns |
1.13 (0.40–3.23) |
|
Recessive Model/ Рецессивная модель |
(AA vs CC + CA) |
14 (67 %) |
24 (73 %) |
0.25 |
0.62ns |
1.33 (0.42–4.17) |
|
Children/Дети |
||||||
|
More than 5/ |
CC |
12 (33 %) |
11 (46 %) |
1.56 |
0.21ns |
1.58 (0.77–3.26) |
|
Больше 5 |
AA |
15 (42 %) |
9 (37 %) |
0.29 |
0.59ns |
1.33 (0.46–3.84) |
|
CA |
9 (25 %) |
4 (17 %) |
– |
1.00 (Ref) |
||
|
Dominant Model/ |
||||||
|
Доминантная модель |
(AA + CA vs CC) |
24 (67 %) |
13 (54 %) |
1.23 |
0.27ns |
1.77 (0.63–4.92) |
|
Recessive Model/ Рецессивная модель |
(AA vs CC + CA) |
21 (58 %) |
15 (63 %) |
0.16 |
0.69ns |
1.22 (0.45–3.30) |
|
Less than 5/ Меньше 5 |
CC |
6 (43 %) |
15 (58 %) |
0.29 |
0.59ns |
1.33 (0.46–3.84) |
|
AA |
5 (36 %) |
6 (23 %) |
0.08 |
0.76ns |
0.83 (0.25–2.73) |
|
|
CA |
3 (21 %) |
5 (19 %) |
– |
1.00 (Ref) |
||
|
Dominant Model/ |
||||||
|
Доминантная модель |
(AA + CA vs CC) |
8 (57 %) |
11 (42 %) |
0.84 |
0.36ns |
1.83 (0.49–6.86) |
|
Recessive Model/ Рецессивная модель |
(AA vs CC + CA) |
9 (64 %) |
20 (77 %) |
0.81 |
0.37ns |
1.89 (0.47–7.50) |
|
Contraceptive drugs/Контрацептивные препараты |
||||||
|
CC |
5 (29 %) |
6 (35 %) |
0.27 |
0.27ns |
2.50 (0.46–12.89) |
|
|
Yes/Да |
AA |
9 (53 %) |
7 (41 %) |
4.64 |
0.03* |
5.50 (1.23–24.81) |
|
CA |
3 (18 %) |
4 (24 %) |
– |
1.00 (Ref) |
||
|
Dominant Model/ |
||||||
|
Доминантная модель |
(AA + CA vs CC) |
12 (71 %) |
11 (65 %) |
0.75 |
0.75ns |
1.27 (0.29–5.61) |
|
Recessive Model/ Рецессивная модель |
(AA vs CC + CA) |
8 (47 %) |
10 (59 %) |
5.68 |
0.02* |
5.50 (1.23–24.81) |
|
CC |
15 (44 %) |
14 (43 %) |
0.21 |
0.33ns |
1.36 (0.72–2.62) |
|
|
No/Нет |
AA |
10 (32 %) |
9 (27 %) |
0.42 |
0.72ns |
0.86 (0.43–1.79) |
|
CA |
8 (24 %) |
10 (30 %) |
– |
1.00 (Ref) |
||
|
Dominant Model/ |
||||||
|
Доминантная модель |
(AA + CA vs CC) |
18 (56 %) |
19 (57 %) |
0.45 |
0.91ns |
0.95 (0.37–2.44) |
|
Recessive Model/ Рецессивная модель |
(AA vs CC + CA) |
23 (68 %) |
24 (73 %) |
0.91 |
0.67ns |
1.27 (0.44–3.64) |
|
Notes: p-value=0.05; ns – non |
significant; * – significant association; created by the authors. |
|||||
|
Примечания: p-value=0,05; ns |
– незначимые различия; |
* – значимые различия; таблица составлена авторами. |
||||
Table 7/Òàблицà 7
Analysis of IL-10 gene polymorphism (rs1800896), exercise, smoking status, number of children, and use of contraceptive drugs
Àнàлиз пîлимîðфизмà гåнà IL-10 (rs1800896) в зàвиñимîñти îт физичåñêиõ óпðàжнåниé, ñтàтóñà êóðåния, êîличåñтвà
|
Parameters/ Параметры |
Genotype/ Генотип |
Cases/ Количество больных |
Controls/ Количество лиц в контрольной группе |
χ2 |
р-value/ |
OR (95 % CI) |
|
Exercise/Физическая активность |
||||||
|
CC |
6 (43 %) |
10 (38 %) |
0.52 |
0.47ns |
1.43 (0.54–3.75) |
|
|
Yes/Да |
AA |
5 (36 %) |
9 (35 %) |
0.25 |
0.62ns |
1.29 (0.48–3.45) |
|
CA |
3 (21 %) |
7 (27 %) |
– |
1.00 (Ref) |
||
|
Dominant Model/ |
||||||
|
Доминантная модель |
(AA + CA vs CC) |
8 (57 %) |
16 (62 %) |
0.10 |
0.75ns |
0.80 (0.20–3.10) |
|
Recessive Model/ Рецессивная модель |
(AA vs CC + CA) |
9 (64 %) |
17 (65 %) |
0.21 |
0.95ns |
1.04 (0.26–4.11) |
|
CC |
15 (42 %) |
10 (42 %) |
1.27 |
0.26ns |
1.55 (0.72–3.29) |
|
|
No/Нет |
AA |
14 (39 %) |
6 (25 %) |
0.93 |
0.34ns |
1.46 (0.66–3.13) |
|
CA |
7 (19 %) |
8 (33 %) |
– |
1.00 (Ref) |
||
|
Dominant Model/ |
||||||
|
Доминантная модель |
(AA + CA vs CC) |
21 (58 %) |
14 (58 %) |
0.30 |
1.00ns |
1.00 (0.40–2.52) |
|
Recessive Model/ Рецессивная модель |
(AA vs CC + CA) |
22 (61 %) |
18 (75 %) |
1.46 |
0.23ns |
1.94 (0.64–5.88) |
|
Smoking status/Статус курения |
||||||
|
Smokers/ |
CC |
8 (28 %) |
6 (35 %) |
1.27 |
0.26ns |
2.00 (0.60–6.64) |
|
Курящие |
AA |
15 (52 %) |
8 (47 %) |
6.63 |
0.01* |
4.00 (1.34–11.97) |
|
CA |
6 (20 %) |
3 (18 %) |
– |
1.00 (Ref) |
||
|
Dominant Model/ |
||||||
|
Доминантная модель |
(AA + CA vs CC) |
21 (72 %) |
11 (65 %) |
0.22 |
0.64ns |
1.36 (0.38–4.82) |
|
Recessive Model/ Рецессивная модель |
(AA vs CC + CA) |
14 (48 %) |
9 (53 %) |
6.63 |
0.01* |
4.00 (1.34–11.97) |
|
Non-smokers/ |
CC |
9 (43 %) |
15 (46 %) |
0.39 |
0.39ns |
1.36 (0.68–2.71) |
|
Некурящие |
AA |
7 (33 %) |
9 (27 %) |
1.07 |
0.30ns |
0.64 (0.28–1.48) |
|
CA |
5 (24 %) |
9 (27 %) |
– |
1.00 (Ref) |
||
|
Dominant Model/ |
||||||
|
Доминантная модель |
(AA + CA vs CC) |
12 (57 %) |
18 (54 %) |
0.06 |
0.81ns |
1.13 (0.40–3.23) |
|
Recessive Model/ Рецессивная модель |
(AA vs CC + CA) |
14 (67 %) |
24 (73 %) |
0.25 |
0.62ns |
1.33 (0.42–4.17) |
|
Children/Дети |
||||||
|
More than 5/ |
CC |
12 (33 %) |
11 (46 %) |
1.56 |
0.21ns |
1.58 (0.77–3.26) |
|
AA |
15 (42 %) |
9 (37 %) |
0.29 |
0.59ns |
1.33 (0.46–3.84) |
|
|
Более 5 |
||||||
|
CA |
9 (25 %) |
4 (17 %) |
– |
1.00 (Ref) |
||
|
Dominant Model/ |
||||||
|
Доминантная модель |
(AA + CA vs CC) |
24 (67 %) |
13 (54 %) |
1.23 |
0.27ns |
1.77 (0.63–4.92) |
|
Recessive Model/ Рецессивная модель |
(AA vs CC + CA) |
21 (58 %) |
15 (63 %) |
0.16 |
0.69ns |
1.22 (0.45–3.30) |
|
Less than 5/ Меньше 5 |
CC |
6 (43 %) |
15 (58 %) |
0.29 |
0.59ns |
1.33 (0.46–3.84) |
|
AA |
5 (36 %) |
6 (23 %) |
0.08 |
0.76ns |
0.83 (0.25–2.73) |
|
|
CA |
3 (21 %) |
5 (19 %) |
– |
1.00 (Ref) |
||
|
Dominant Model/ |
||||||
|
Доминантная модель |
(AA + CA vs CC) |
8 (57 %) |
11 (42 %) |
0.84 |
0.36ns |
1.83 (0.49–6.86) |
|
Recessive Model/ Рецессивная модель |
(AA vs CC + CA) |
9 (64 %) |
20 (77 %) |
0.81 |
0.37ns |
1.89 (0.47–7.50) |
End of Table 7/Окончание таблицы 7
|
Parameters/ Параметры |
Genotype/ Генотип |
Cases/ Количество больных |
Controls/ Количество лиц в контрольной группе |
χ2 |
р-value/ |
OR (95 % CI) |
|
Contraceptive drugs/Контрацептивные препараты |
||||||
|
CC |
5 (29 %) |
6 (35 %) |
0.27 |
0.27ns |
2.50 (0.46–12.89) |
|
|
Yes/Да |
AA |
9 (53 %) |
7 (41 %) |
4.64 |
0.03* |
5.50 (1.23–24.81) |
|
CA |
3 (18 %) |
4 (24 %) |
– |
1.00 (Ref) |
||
|
Dominant Model/ |
||||||
|
Доминантная модель |
(AA + CA vs CC) |
12 (71 %) |
11 (65 %) |
0.75 |
0.75ns |
1.27 (0.29–5.61) |
|
Recessive Model/ Рецессивная модель |
(AA vs CC + CA) |
8 (47 %) |
10 (59 %) |
5.68 |
0.02* |
5.50 (1.23–24.81) |
|
CC |
15 (44 %) |
14 (43 %) |
0.21 |
0.33ns |
1.36 (0.72–2.62) |
|
|
No/Нет |
AA |
10 (32 %) |
9 (27 %) |
0.42 |
0.72ns |
0.86 (0.43–1.79) |
|
CA |
8 (24 %) |
10 (30 %) |
– |
1.00 (Ref) |
||
|
Dominant Model/ |
||||||
|
Доминантная модель |
(AA + CA vs CC) |
18 (56 %) |
19 (57 %) |
0.45 |
0.91ns |
0.95 (0.37–2.44) |
|
Recessive Model/ Рецессивная модель |
(AA vs CC + CA) |
23 (68 %) |
24 (73 %) |
0.91 |
0.67ns |
1.27 (0.44–3.64) |
Notes: p-value=0.05; ns – non-significant; * – significant association; created by the authors.
Примечания: p-value=0,05; ns – незначимые различия; * – значимые различия; таблица составлена авторами.
experience abnormal vaginal discharge as a primary symptom. This discharge can be characterized as watery, purulent, or mucoid. Advanced instances are characterized by pelvic or abdominal pain as well as urinary or rectal symptoms. Pelvic discomfort can occur due to a disease that invades the local area or as a result of a concurrent pelvic inflammatory illness [16].
The International Federation of Gynecology and Obstetrics (FIGO) has approved colposcopy, biopsy, cervix conization, cystoscopy, and proctosigmoidoscopy as the only evaluation methods for staging. During the initial phases of a disease, the uterus may experience an impact, such as in stages IA, IB1, and IIA1. Individuals diagnosed with stage IIB-IVA disease are classified as having advanced disease. As per multiple oncologists, the advanced illness group now includes patients with IB2 and IIA2 disease [17]. No patients in this study were diagnosed at stage I, suggesting that limited awareness and inadequate screening contribute to delayed detection and reduced survival chances. Additionally, squamous cell carcinoma was the most prevalent type, observed in 75 % of cases (Fig. 6).
Globally, and particularly in developing countries, cervical cancer is a major contributor to female mortality. Approximately 78 % of cervical cancer cases are seen in developing and economically underdeveloped nations [18].
A study found that starting menstruation at the age of 13–14 is a substantial risk factor for developing cervical cancer, with an odds ratio of 2.91 (95 % confidence interval: 1.18–7.20). A chi-square analysis revealed a significant correlation between the onset of cervical cancer and the age at which menstruation begins (p-value 0.001) [19]. In this study, SNP (rs1800872) did not show a significant association between cervical cancer and the age of menarche (Table 4). However, SNP (rs1800896) was significantly associated with menarche (Table 5). While menopause is known to be a risk factor for cervical cancer [20], our findings did not show a significant correlation between menopause and cervical malignancy (Tables 4 and 5).
According to a study, there were no statistically significant correlations between smoking and patient-reported outcomes. However, another study provides evidence of the correlation between tobacco use and the development of cervical cancer and highlights the substantial benefits of stopping smoking in preventing cancer [21]. Recent research indicates a significant correlation between smoking and the likelihood of acquiring cervical cancer (Tables 6 and 7). The use of oral contraceptive pills was significantly linked to an increased risk of developing cervical cancer. The use of oral contraceptives is associated with an elevated risk of developing cervical cancer [22]. The present study further validates the strong significant correlation between the utilization of contraceptive medications and the occurrence of cervical cancer (Table 6).
Examining the correlation between various genetic variations in several cytokine genes has shown that the presence of polymorphisms is associated with an elevated risk of cervical cancer. Cytokines, crucial signaling molecules, are produced by various cells in the body. IL-10, a vital cytokine, can decrease inflammation and also exhibit antiangiogenic and immunosuppressive effects. Research has shown that genetic variants in the IL-10 gene have an impact on the production levels of this cytokine. Thus, IL-10 may exhibit both tumor-protective and tumor-promoting effects. Several studies have examined the levels of
IL-10 , both high and low, in cervical cancer. Our study found no such link in the Pakistani population of Quetta (Tables 2 and 3).
A meta-analysis of 1498 cases and 1608 healthy controls has revealed that the presence of IL-10 gene variants enhances the chance of developing cervical cancer. Another meta-analysis has similarly validated the connection of the IL-10 gene (OR=1.17, p=0.012), with 2183 cases and 1188 controls. A case-control investigation in the Indian population further validated the association between cervical cancer and IL-10 gene polymorphism. However, certain studies have discovered that there is no connection between IL-10 gene polymorphisms and cervical cancer in various groups [23].
Study limitations
Our study had a small sample size because there were only 50 patients available at CENAR Hospital in Quetta over two years. In addition, the data collected from the past eight years showed a low occurrence rate in the city, which limited the sample size to only 112 cases. The limited sample size may restrict the applicability of our findings to larger populations. Although we faced the difficulty of having a small sample size, our study is notable for being a unique inquiry into the correlation between IL-10 gene polymorphisms and cervical cancer specifically in the Quetta region. Our study contributes new insights into the field of cervical cancer genetics by conducting a thorough analysis of the available data in a hitherto underexplored area of inquiry. By specifically analyzing two single nucleotide polymorphisms (SNPs) within the IL-10 gene, we were able to perform a comprehensive examination of these particular genetic variants. Our
