Atlantic ocean zones that are quasi-stationary in terms of surface temperature dynamics based on satellite monitoring results

Author: Vysotskaya G.S., Pisman T.I., Botvich I.Y., Shevyrnogov A.P.
Journal: Журнал Сибирского федерального университета. Серия: Техника и технологии @technologies-sfu
Section: Исследования. Проектирование. Опыт эксплуатации
Article in issue: 2 т.17, 2024.
Free access
Using data from the MODIS-Aqua satellite scanner, seasonal changes in ocean surface temperature (OST) in the Atlantic Ocean for the period 2003-2019 were studied. Based on these data, quasi-stationary zones were calculated based on the average monthly ocean surface temperature using the moving window variance method. Zones were identified that are quasi-stationary in terms of the seasonal dynamics of OST and that correspond to the present position of current boundaries. Significant differences in ocean surface temperatures were revealed. Areas in the ocean were identified that differ in absolute OST values, but have similar seasonal dynamics, as well as areas with different seasonal OST dynamics. An interesting fact has been revealed when currents that geographically continue each other do not always coincide in seasonal dynamics. For example, at the boundary of the North Atlantic Current and the Gulf Stream, there is a vast zone with no stable seasonal dynamics. The possibility of using this method for monitoring of mixing zones that arise at the boundaries of currents was shown.
Atlantic оcean, ocean surface temperature (ost), quasi-stationary zones, modis-aqua, seasonal dynamics
Short address: https://sciup.org/146282833
IDR: 146282833 | UDC: 528.88
Квазистационарные по динамике поверхностной температуры зоны в Атлантическом океане (по результатам спутникового мониторинга)
По данным спутникового сканера MODIS-Aqua исследуются сезонные изменения температуры поверхности океана (ТПО) в Атлантическом океане за период 2003-2019 гг. По этим данным вычислены квазистационарные зоны по среднемесячной температуре поверхности океана с помощью метода скользящего окна дисперсии. Выделены зоны, квазистационарные по сезонной динамике ТПО, соответствующие текущему положению границ течений. Обнаружены существенно значимые перепады температур поверхности океана. Выделены участки в океане, различные по абсолютным значениям ТПО, но с подобной сезонной динамикой, а также участки с различной сезонной динамикой ТПО. Выявлен интересный факт, когда течения, географически продолжающие друг друга, не всегда совпадают по сезонной динамике. Например, на границе Северо-Атлантического течения и Гольфстрима наблюдается обширная зона с отсутствием стабильной сезонной динамики. Показана возможность использования данного метода для мониторинга зон перемешивания, возникающих на границах течений.
Text of the scientific article Atlantic ocean zones that are quasi-stationary in terms of surface temperature dynamics based on satellite monitoring results
Цитирование: Высоцкая Г. С. Квазистационарные по динамике поверхностной температуры зоны в Атлантическом океане (по результатам спутникового мониторинга) / Г. С. Высоцкая, Т. И. Письман, И. Ю. Ботвич, А. П. Шевырногов // Журн. Сиб. федер. ун-та. Техника и технологии, 2024, 17(2). С. 205–213. EDN: NGUPSM factors accompanying these processes is the spatial variability of OST patterns since it is an indicator of such dynamic processes in the ocean as currents, turbulence, upwelling, etc.
Changes in the structure of the ocean surface layer are significantly associated with vertical movements of water, especially with the manifestation of such a process as upwelling. Due to the redistribution of horizontal flows associated with currents, frontal zones and frontal interfaces between water masses with significantly different properties are formed on the ocean surface [3].
The development of satellite methods for monitoring the state of the ocean opens up new opportunities for continuous monitoring of changes in the ocean. Analysis of the ocean’s spatial structure makes it possible to timely detect and predict hazardous phenomena and trends on regional and global scales [4, 5]. Satellite methods make it possible to regularly obtain data on surface temperature over the entire ocean area.
It was previously shown that quasi-stationary zones (areas with a stable spatiotemporal structure of the seasonal dynamics of chlorophyll concentration in the surface layer of the ocean) can serve as a basis for characterizing fundamental biological and hydrological processes in the ocean [6]. Based on satellite data from CZCS (1978–1986) and SeaWiFS (1997–2010), zones in the World Ocean were discovered within which the seasonal dynamics of chlorophyll concentration changes quite smoothly. Areas where sudden, often chaotic changes occur, were also found.
The Atlantic Ocean covers all climate zones of the Earth. Within its boundaries, the interaction of ocean currents and air currents with significant differences in OST has determined significant climatic features: the entire southern part of the ocean is strongly influenced by the Antarctic continent. Seasonal fluctuations in temperature, salinity, oxygen saturation, and other indicators of ocean waters are much less pronounced than atmospheric ones. This feature is determined by the constant movement of water masses by ocean currents.
Changes in surface temperature affect almost all manifestations of ocean activity: the hydrosphere, ocean biosphere, hydrochemistry, etc. Hence it is clear that studying the stability of the spatial position of ocean currents is relevant. Their dynamics directly influences the climate and is an important indicator of global trends in atmospheric temperatures, such as warming of atmospheric air.
The purpose of this work is to identify and analyze the seasonal dynamics of the surface temperature of the Atlantic Ocean using MODIS/Aqua satellite data for the period 2003–2019.
Materials and methods
The object of study is the Atlantic Ocean, the second largest and deepest ocean after the Pacific Ocean.
The work analyzes monthly data from the MODIS-Aqua satellite scanner on the temperature of the surface layer of water with a resolution of 4320×2160 (9 km at the equator) for 2003–2019, obtained from the Ocean Color Data website [7].
Based on these data, quasi-stationary zones were identified for the monthly average ocean surface temperature using the moving window variance method with a window size of 21×21 pixels for each month. Then the average temperatures for each year were calculated.
Quasi-stationary zones (QSZ) are areas with a stable spatiotemporal structure of seasonal temperature dynamics in the surface layer of the ocean. The variance estimate characterizes the variability of the variable, in this case, ocean surface temperature, over a set of observations within a selected square. Variance characterizes the degree of dispersion of individual values of a characteristic in the aggregate from the average value.
For those zones where the values of the variables inside the selected square change slowly, the values of the moving variance are insignificant, but increase sharply where the seasonal dynamics of the variables begins to change. Depending on the number of pixels inside the window, areas with different spatial characteristics are distinguished.
The moving variance method for isolating QSZ of chlorophyll concentration in the ocean was first used in 1996 [6]. A modification of this method also makes it possible to identify zones that are stable in terms of the seasonal dynamics of ocean surface temperature, within which the variance is small. At the boundary of quasi-stationary zones, there are frontal zones and interfaces in which the variance sharply increases.
Results and discussion
Ocean surface temperature characterizes the thermal state of the ocean's surface layer. It is determined mainly by the absorption of solar radiation, evaporation, and currents.
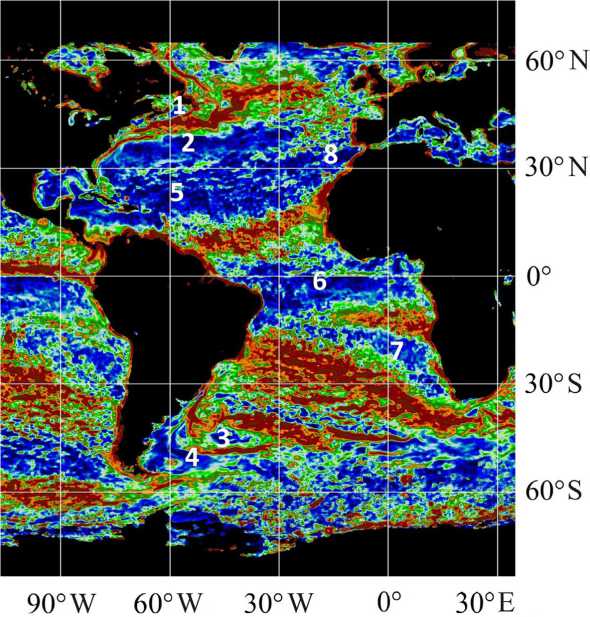
In Fig. 1, numbers from 1 to 8 mark characteristic quasi-stationary zones associated with various hydrological and hydrobiological features of the Atlantic Ocean. Blue color indicates zones with the same seasonal dynamics of ocean surface temperature (quasi-stationary) and with low variance. Transition areas between quasi-stationary zones are marked brown. They are characterized by high
30°S
60° s
Fig. 1. The Atlantic Ocean: zones that were quasi-stationary in terms of ocean surface temperature in 2019: 1. The Labrador Current, 2. The Gulf Stream, 3. The Argentine Basin, 4. The Falkland Islands zone, 5. The southern part of the subtropical gyre, 6. The equatorial gyre, 7. The Benguela Current, 8. The Gibraltar region. The QSZ in which the variance is low are highlighted in blue. The transition zones in which variance is increased are highlighted in brown variance. The variance increases sharply when crossing the interface of waters with different seasonal OST dynamics.
Using the example of the Atlantic Ocean, we can show quasi-stationary zones 1, 2, 3, and 4, the formation of which is associated with large ocean currents and ocean floor profiles. These are the Labrador Current, the Gulf Stream, the Argentine Basin, and the Falkland Islands zone. Mostly, their location remains unchanged (Fig. 2), although some movement of boundaries occurs. The use of this method made it possible to identify new zones in 2019: zone 5 (the southern part of the subtropical gyre) and zone 8 (the Gibraltar region).
As a result of the analysis, the seasonal dynamics of OST was revealed for quasi-stationary zones identified in the northern part of the Atlantic Ocean and its southern part. In the northern part of the ocean, the shape of the curves of seasonal temperature dynamics for quasi-stationary zone 5 (the southern part of the subtropical gyre) and zone 8 (the Gibraltar region) is similar, but the levels differ by 8 °C, which is quite significant (Fig. 3). This is due to the fact that water masses come to the Gibraltar area from the north, where the cold Canary Current begins.
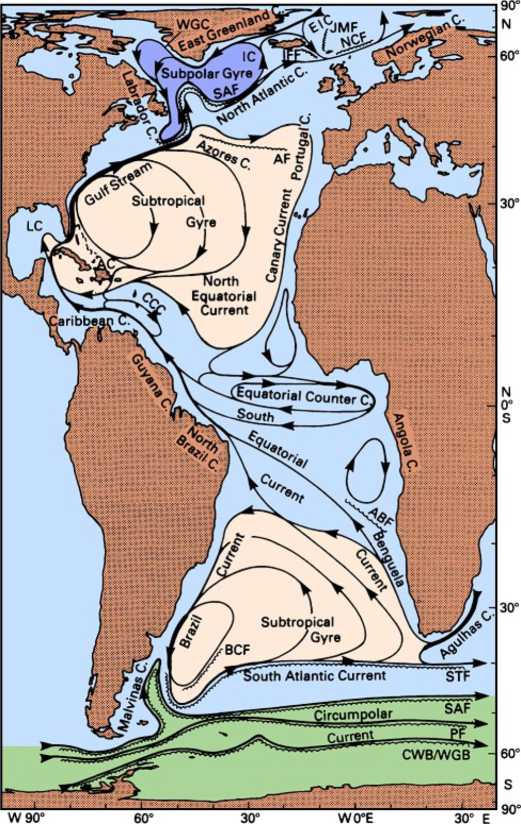
Fig. 2. Scheme of the main currents of the Atlantic Ocean
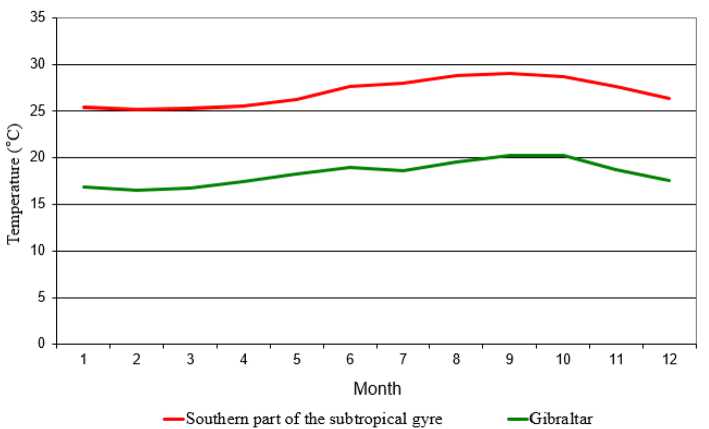
Fig. 3. Seasonal dynamics of ocean surface temperature for zone 5, the southern part of the subtropical gyre, and zone 8, the Gibraltar region
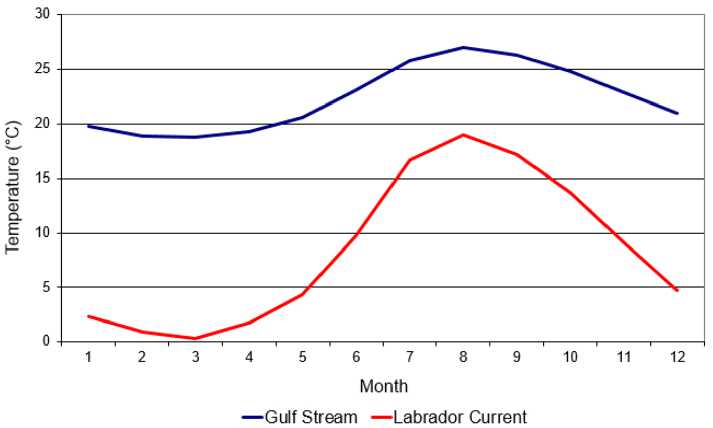
Fig. 4. Seasonal dynamics of ocean surface temperature for zone 2, the Gulf Stream, and zone 1, the Labrador Current
For quasi-stationary zone 1 (the Labrador Current) and zone 2 (the Gulf Stream), the seasonal dynamics of OST is different, in August the temperature is relatively similar, and in the winter months it differs by 18 °C. (Fig. 4). This is due to different temperatures and directions of currents.
The Labrador Current is a cold sea current in the Atlantic Ocean that flows southward from the Baffin Sea to the Grand Banks of Newfoundland. Accordingly, the temperature of the quasi-stationary zone associated with the Labrador Current approaches 0 °C in the winter months, rising to 19 °C in August.
The Gulf Stream is a warm sea current in the Atlantic Ocean. The temperature of the quasi-stationary zone associated with the Gulf Stream reaches 27 °C in August, and drops to temperatures close to 20 °C in the winter months.
Fig. 5 shows the seasonal dynamics of OST for quasi-stationary zones identified in the southern part of the Atlantic Ocean. An example has been revealed of how, in very close areas of the ocean for zones 3 (the Argentine Basin) and 4 (the Falkland Islands zones), the seasonal dynamics of OST differs in absolute values (the difference is 4 °C), but is similar in the dynamics of seasonal changes. At the same time, the temperature decreases in the summer and autumn months and increases in winter.
The Argentine Basin is an underwater basin in the southwestern part of the Atlantic Ocean. The depth of the basin reaches 6,681 m. There are seasonal changes in temperature and salinity of the surface layer, extending to a depth of approximately 200 m. Seasonal OST dynamics for the Argentine Basin is typical for the Southern Hemisphere: lowest in August and highest in February.
The Falkland Islands are an archipelago in the southwest Atlantic Ocean. It is influenced by powerful cold currents. One of them, the Falkland (Malvinas) current, runs from the Falkland Islands to the Rio de La Plata Bay.
Zone 6 (the equatorial gyre) and zone 7 (the Benguela Current) were also identified, in which the absolute values of the OST seasonal dynamics were quite close, but from September to December changes in the shape of the curve of seasonal temperature dynamics were observed (Fig. 6).
The equatorial gyre is determined by several factors, including temperature, humidity, and ocean currents. Warm surface water from the equator is carried by ocean currents to the poles, and cold water from the poles returns to the equator. This process regulates the Earth's climate and is an important part of the ocean water cycle.
The Benguela Current is a cold Antarctic current located near the South Equatorial and Brazil Currents. The Benguela Current is a special type of ocean current in which warm waters from the
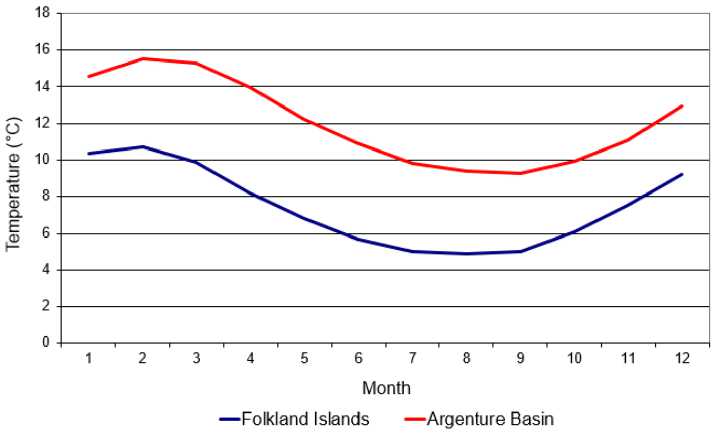
Fig. 5. Seasonal dynamics of ocean surface temperature for zone 3, Argentine Basin, and zone 4, Falkland Islands
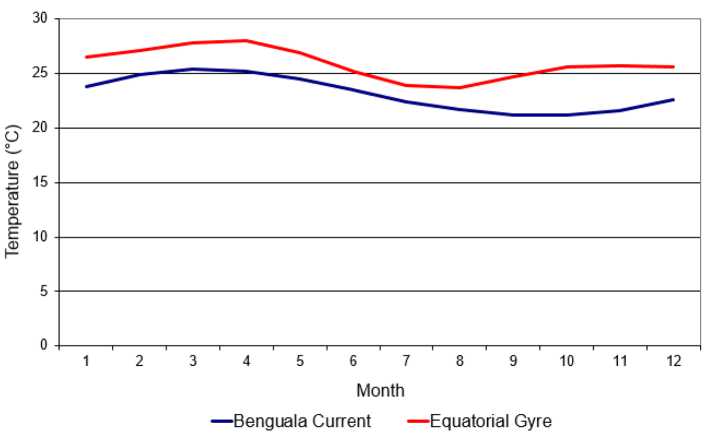
Fig. 6. Seasonal dynamics of ocean surface temperature for zone 6, the equatorial gyre, and zone 7, Benguela Current western part of the ocean move towards the eastern part. Thus, it influences the distribution of heat in the ocean and atmosphere. This current has a significant impact on the climate, influencing weather conditions and, in turn, ecological systems [8].
Ocean surface temperature is determined by the dynamics of the structure of ocean waters and, in part, by latitude. It is possible to clearly observe the highest temperature values (+28–29 °C) at the equator and their decrease near the poles. The proximity of the cold Antarctica affects the rate of temperature decrease. To the south the decrease occurs much faster than to the north.
The dynamics of QSZ may also be associated with a disturbance in the location of the current. Currents have a huge impact on the redistribution of heat in the ocean [9]. In the northern hemisphere, the warm waters of the western part of the ocean go to the poles, and in the east, they return cooled to the equator. On the other hand, changes in the temperature of ocean currents may be the result of global warming, since their dynamics is significantly influenced by the salinity of ocean waters, which is decreasing due to the melting of ice in the Arctic and Antarctica. There may also be an effect of the decreasing temperature difference between the poles and the equator due to an increase in the greenhouse effect.
Conclusion
This article presents the results of calculations of seasonal changes in surface temperature of the Atlantic Ocean for the period 2003–2019 according to MODIS/Aqua satellite data. Based on the results obtained, the following conclusions were drawn.
-
– Identifying zones that are quasi-stationary in terms of the seasonal dynamics of OST makes it possible to identify areas that correspond to the present location of current boundaries.
-
– Significant differences in ocean surface temperatures were revealed. Areas were identified that differ in absolute temperature values, but have similar seasonal dynamics, as well as areas with different seasonal dynamics.
-
– An interesting fact has been revealed when currents that geographically continue each other do not always coincide in seasonal dynamics. For example, at the boundary of the North Atlantic Current and the Gulf Stream, there is a vast zone with no stable seasonal dynamics.
-
– The possibility of using this method for extensive mixing zones that arise at the boundaries of currents was shown.
-
– Express determination of quasi-stationary zones can be used in practice for ocean fisheries, as it marks frontal interfaces, zones that are potentially attractive due to increased productivity at upwellings.
References Atlantic ocean zones that are quasi-stationary in terms of surface temperature dynamics based on satellite monitoring results
- Zhang R., Sutton R., Danabasoglu G., Kwon Y. O., Marsh R., Yeager S. G., Amrhein D. E., Little C. M. A review of the role of the Atlantic Meridional Overturning Circulation in Atlantic Multidecadal Variability and associated climate impacts. Rev. Geophys., 2019, 57, 316-375. DOI: 10.1029/2019RG000644 EDN: UMHNPE
- Smeed D. A., Josey S. A., Beaulieu C., Johns W. E., Moat B. I., Frajka-Williams E., Rayner D, Meinen C. S., Baringer M. O., Bryden H. L., McCarthy G. D. The North Atlantic Ocean is in a state of reduced overturning. Geophys. Res. Lett., 2018, 45, 1527-1533. DOI: 10.1002/2017GL076350 EDN: SDISLV
- Kartushinsky A. V. The investigation on the dynamics of frontal zones in the ocean based on the numerical modelling, using the AVHRR satellite data. Adv. Space Res., 2004, 7(33), 1173-1178. EDN: LIKMXP
- Khodyaev A. V., Shevyrnogov A. P., Vysotskaya G. S., Kozikova O. S. Using Moving Variance Method to Detect Ocean Currents from Space. J. Sib. Fed. Univ. Eng. technol., 2011, 4(2), 179-184. EDN: NMWLLF
- Shevyrnogov A. P., Vysotskaya G. S., Shevyrnogov E. A. Spatial and temporal anomalies of sea surface temperature in global scale (by space-based data). Adv. Space Res., 2004, 33, 1179-1183. 10.1016/S 0273-1177(03)00369-7. DOI: 10.1016/S0273-1177(03)00369-7 EDN: LIMUIP
- Shevyrnogov A. P., Vysotskaya G. S., Gitelson J. I. Quasistationary areas of chlorophyll concentration in the world ocean as observed satellite data. Adv. Space Res., 1996, 18(7), 129-132. EDN: LDKYPV
- https://oceandata.sci.gsfc.nasa.gov/MODIS-Aqua/Mapped/Monthly/9km.
- https://lagurus-shop.ru/bengelskoe-tecenie-i-ego-vliyanie-na-klimat).
- Caesar L., Rahmstorf S., Robinson A., Feulner G., Saba V. Observed fingerprint of a weakening Atlantic Ocean overturning circulation. Nature, 2018, 556, 191-196. DOI: 10.1038/s41586-018-0006-5
