Attribute features application in specification of regression model of apartments cost

Author: Pashkovskaya O. V., Brening D. V.
Journal: Siberian Aerospace Journal @vestnik-sibsau-en
Section: Informatics, computer technology and management
Article in issue: 4 vol.20, 2019.
Free access
In the study of statistical data with a pronounced endogenous variable, it is necessary to identify factors (explanatory variables) that have a strong impact on the result. In this, factors can be both quantitative and attributive. To assess influence of numerical features, regression analysis methods can be used. Influence of attributive features is not taken into account. However, often these are they who make the decisive contribution to variation of the result. It is necessary to develop methods for analyzing influence of attributive features and accounting for these features in regression models. On the example of sets of apartments proposed for sale in the city of Krasnoyarsk, a new method is used to assess influence of attributive features on the quantitative using ranking them in accordance with their influence on the endogenous variable. Method of fictitious variables is used to analyze the attribute features. Each attribute with m values is assigned (m-1) dummy variables and a regression model is constructed. Influence of exogenous variables can be expressed using standardized regression coefficients. In this case, influence of attributes can be estimated by cumulative correlation coefficient calculated on the basis of a regression model with fictitious variables. For further research, set is proposed to rank, assigning each element a "rank" – value of a standardized coefficient which reflects closeness of the relationship with the endogenous variable. Thus, all features have a numerical value. A standardized regression model is constructed. Proposed approach can be used in the analysis of statistical aggregates, units of which are characterized by quantitative and attributive features.
Attributive features (qualitative variables), ranking of variables, correlation, standardized multiple regression model.
Short address: https://sciup.org/148321705
IDR: 148321705 | UDC: 330.43:519.2 | DOI: 10.31772/2587-6066-2019-20-4-443-450
Text of the scientific article Attribute features application in specification of regression model of apartments cost
Introduction. To assess influence of factor variables on a endogenous variable, various econometric tools are used [1–14]. For example, in the work, published earlier [1], cost of an apartment in aggregate of apartments offered for sale in the housing market in the city of Krasnoyarsk in 2017, a regression model is being constructed, in which quantitative explanatory variables (total area, residential area and others) are used. As a result, some characteristics were obtained, according to which the degree of influence of any factor [1–14] was estimated. When studying the aggregate of apartments, offered for sale on the primary housing market in the city of Krasnoyarsk in 2017 [15], it was revealed that a strong influence on the price of an apartment, in addition to quantitative, such characteristics as total area of the apartment, qualitative variables: district of the city, in which the house is located and material from which this house is built, also exert influence.
If the statistical analysis of numerical features does not cause any difficulties, but when dealing with qualitative variable, various difficulties arise: meaning of attribute is represented by the word - attribute, data needs ranging, substituting each meaning by rank. If, when ranking, values are replaced simply by serial numbers, then the numerical value will distort influence on the resultant attribute. For example, when ranking on the basis of “district”, apartments in Akademgorodok are given rank 12, and apartments in Pokrovka are ranked 6. It turns out that apartments in the same region are twice “bigger” than in the other. The question arises, why exactly twice, and is it really “bigger” or is it just an unconfirmed guess of the researcher?
For the studied aggregate [5], it is proposed to apply a new method for assessing influence of qualitative variable on the endogenous variable. We distinguish two attribute signs: wall materials and region in which the house is built. We will develop this method for a set of one-room apartments, and then test it on a set of 2, 3, 4-room apartments.
Method of fictitious variables. When studying influence of attributive features, method of fictitious variables will be used.
Let us evaluate influence of the district (z), in which the house is built, on formation of the price of apartment (y) (structure of the studied phenomenon is shown in fig. 1).
To account for the qualitative variable ( z ), we introduce twelve fictitious variables z 1, z 2, ... z 12 into the regression model. Based on available sample of one-room apartments (volume of 765 elements), we calculate esti-
mates of parameters of regression equation. Regression equation will be built in a standardized form:
^
ty
0.01 1 + 0.25 t. z 1 11.78
- 0.68
z 2
0.08 t
- 4.43 z 3
0.01 t
- 4.63 z 4
0.05 t
- 2.23 z 5
0.30 t
- 13.42 6
- 0.18 t, + 0.04 t.
- 7.55
1.96
z 8
0.14 t
- 7.87 9
0.44 t
- 16.58 z 10
- (1)
- 0.04 t + 0.09 t,
- 2.42 z 11 5.05 z 12
+ 0.60 1. .
33.98 x
where ty is the price of apartment (standardized variable
y - y corresponding to the value of the apartment), t =-----), y sy tz1, tz2,.., tz12 standardized fictitious variables, corresponding to attributive feature “district”, tx – total area (standardized variable); for evaluating each parameter, the observed value of t-statistics is given below.
In equation (1) adjusted coefficient of determination was 82.6 %, what indicates high quality and statistical significance of constructed equation.
To assess influence of qualitative variable ( z ) – “district”, basing on the constructed correlation matrix, we calculate total correlation coefficient:
r yz1 z 2 . z12 в 1 r yz 1 + . + в 12 r yz 12
= ( - 0.012 ) • ( - 0.029 ) + . + 0.092 • 0.268 = 0.404.
Share of influence of quantitative feature in the explained variation was 51.2 %, and of qualitative variable – 48.7 %.
Next, we evaluate influence of material of the house walls ( u ) on formation of apartment price ( y ) (structure of the phenomenon is shown in fig. 2).
To account for the qualitative variable ( u ), we introduce two fictitious variables u 1, u 2 into the regression model. Let's build a standardized regression model:
^

- 0.11 t„ + 0.05 t„ + 0.71 tx .
- 4.28 u1 1.90 u 2 27.77 x
For evaluation influence of attribute ( u ) – “wall
material”, based on constructed correlation matrix
' 1 - 0.088 0.174 0.709 ^
-0.088 1 -0.1980.045
0.174 -0,198 10.145
4 0.709 0.045 0.1451
total correlation coefficient:
r yU u 2 =P 1 r yu 1 +e 2 r yu 2 =
let’s calculate
= ( - 0.11 ) • ( - 0.088 ) + ( 0.05 ) • ( 0.174 ) = 0.018.
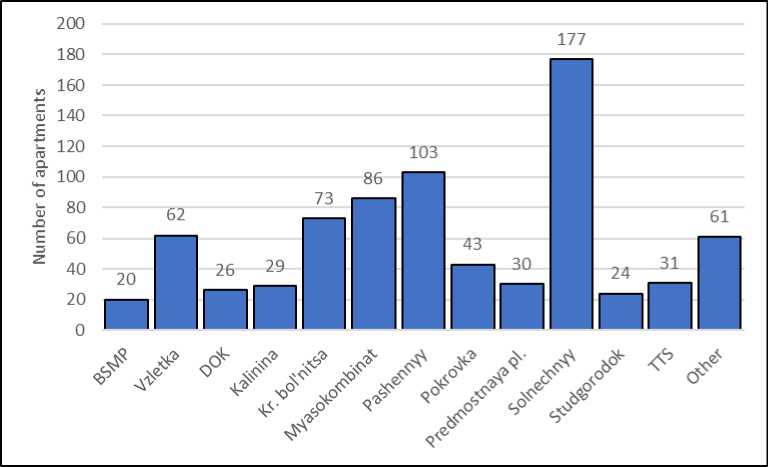
Fig. 1. Distribution of offered for sale one-room apartments by district of the city Krasnoayarsk, 2017 year
Рис. 1. Распределение предлагаемых к продаже однокомнатных квартир по районам, г. Красноярск, 2017 г.
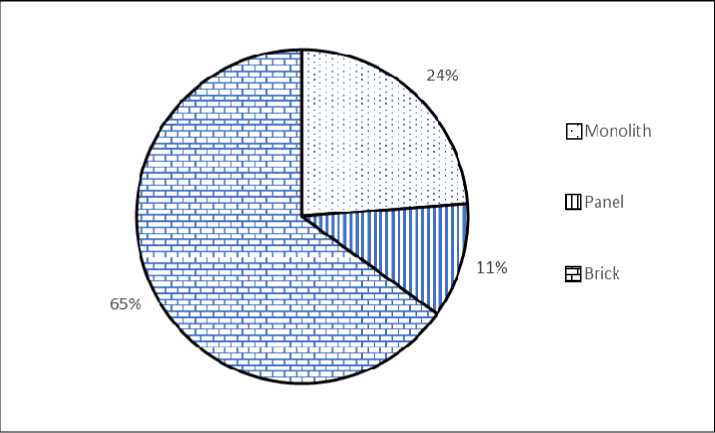
Fig. 2. Distribution of offered for sale one-room apartments by wall material, Krasnoyarsk, 2017 year
Рис. 2. Распределение предлагаемых к продаже однокомнатных квартир по материалу стен, г. Красноярск, 2017 г.
Ranking of aggregate. In the initial population, we replace values of attribute features with corresponding standardized regression coefficients, thus assigning each element a “rank”.
Now, in aggregate under consideration, all the features are quantitative. We get the following regression equation:
t v = 0.63 t, + 0.09L + 0.55L . (3)
y 39.92 x 5.93 u 34.95 z
Equation (3) by 81.6 % explains change in the price of apartments (adjusted coefficient of determination is 0.815) and with probability of 99 % is statistically significant, standard mistake is S = 0.43.
Approbation. In analogy, we analyze aggregate of two-room apartments (547 units of observation). In this aggregate, average apartment area is 55.13 square meters. m, average price of 1 square. m – 48.41 thousand rubles, average cost of an apartment – 2668.93 thousand rubles. Structure of aggregation is shown in fig. 3–4.
In this population, there is a very strong influence of qualitative variable – part of influence of the qualitative variable in the overall determination coefficient is – 49.12 %. The resulting equation is:
tv = 0.58 t — 0.02 t + 0.57 t .
y 30.47 — 1.24 29.31
Statistically significant with probability of 99 % (adjusted coefficient of determination is equal to 0.818).
Next, we analyze sample of three-room apartments (200 units of observation). In this aggregate, average apartment area is 76.62 square meters, average price of 1 square. m – 51.05 thousand rubles, average cost of an apartment is – 3910.94 thousand rubles. The structure of aggregate is shown in fig. 5, 6.
Replacing attribute feature values with standardized coefficients
|
№ |
Cost of apartment, thousand rubles |
Area of apartment, apt. m |
Wall material |
District |
||
|
Attributes |
Rank |
Attributes |
Rank |
|||
|
1 |
1863 |
48.27 |
Monolith |
–0.11 |
Myasokombinat |
–0.302 |
|
2 |
1262 |
31.77 |
Monolith |
–0.11 |
Муаsokombinat |
–0.302 |
|
3 |
1010 |
26.01 |
Monolith |
–0.11 |
Myasokombinat |
–0.302 |
|
4 |
1010 |
26.01 |
Monolith |
–0.11 |
Myasokombinat |
–0.302 |
|
5 |
1646 |
42.20 |
Monolith |
–0.11 |
Myasokombinat |
–0.302 |
|
6 |
1646 |
42.20 |
Monolith |
–0.11 |
Myasokombinat |
–0.302 |
|
7 |
1545 |
42.70 |
Monolith |
–0.11 |
Solnechnyy |
–0.435 |
|
687 |
1677 |
36.11 |
Brick |
0.00 |
Solnechnyy |
–0.435 |
|
688 |
1531 |
37.91 |
Brick |
0.00 |
Myasokombinat |
–0.302 |
|
689 |
2315 |
42.09 |
Panel |
0.05 |
Innokentyevskiy |
0.000 |
|
763 |
3162 |
51.00 |
Brick |
0.00 |
0.242 |
|
|
764 |
1100 |
17.60 |
Brick |
0.00 |
BSMP |
–0.012 |
|
765 |
3162 |
51.00 |
Brick |
0.00 |
Vzletka |
0.242 |
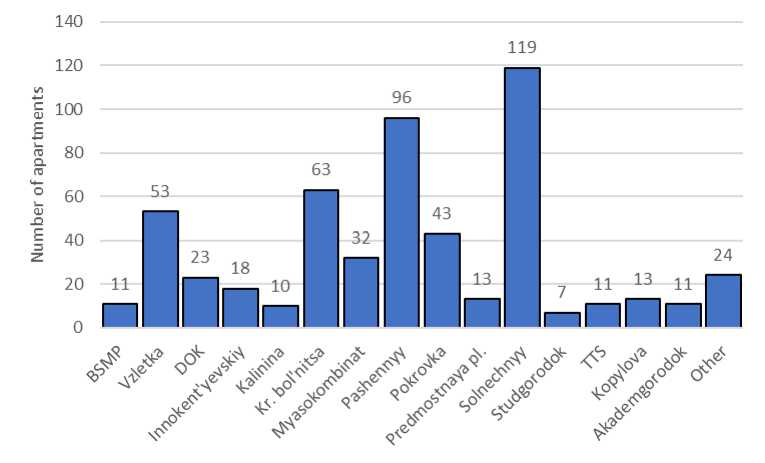
Fig. 3. Distribution of offered for sale two-room apartments by district of the city Krasnoayarsk, 2017 year
Рис. 3. Распределение предлагаемых к продаже двухкомнатных квартир по районам, г. Красноярск, 2017 г.
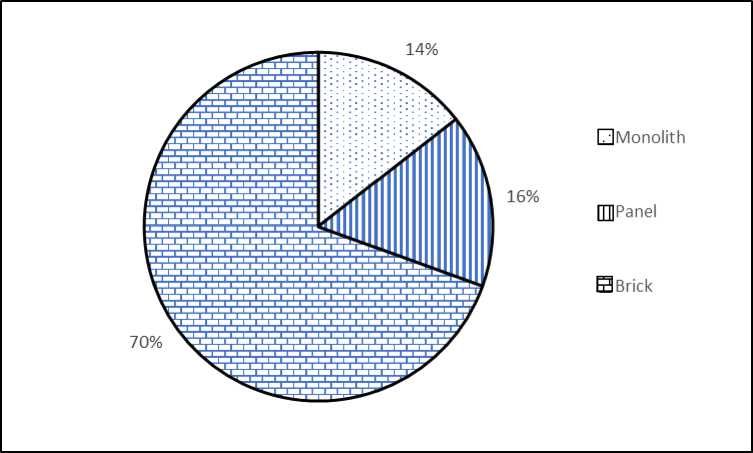
Fig. 4. Distribution of offered for sale two-room apartments by wall material, Krasnoyarsk, 2017 year
Рис. 4. Распределение предлагаемых к продаже двухкомнатных квартир по материалу стен, г. Красноярск, 2017 г.
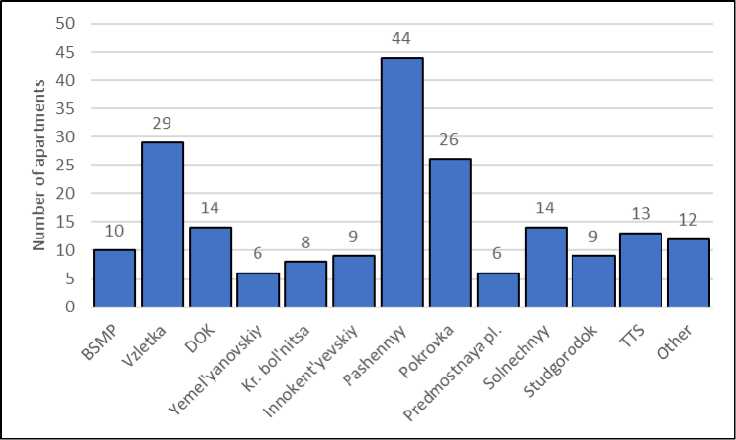
Fig. 5. Distribution of offered for sale three-room apartments by district of the city Krasnoyarsk, 2017 year
Рис. 5. Распределение предлагаемых к продаже трехкомнатных квартир по районам, г. Красноярск, 2017 г.
Based on the available quantitative characteristics ( y – is price of apartment, thousand rubles; x 1 - is the total area, sq. m , x 2 – is living area, sq. m ; x 3 is the kitchen area, sq. m) we construct a regression model in a standardized form:
^^
ty
= 0.78 1»
12.19 x 1
+ 0.06 tx + 0.05 tx
.28 x 2 0.86 x 3
For these models: adjusted coefficient of determination is 71.4 % and regression equation is statistically significant with a probability of 99 %. Low values of t-statistics indicate that estimates of regression parameters are not statistically significant, and high values of correlation coefficients between factors (r v = 0.549;
x 1 x 2
r xx 3 = 0.648) signal about presence of multicollinearity in the model. Let’s try to improve quality of the model by adding attributive features and excluding factors ( x 2 – living area, sq. m; x 3 – kitchen area, sq. m) closely associated with the sign x 1 – total area, sq. m
Dealing with qualitative variables wall material (u) and district (z) and quantitative feature total area (x) and using method, presented in this article earlier, we obtain standardized equation:
^
tv = 0.68 1^ + 0.01 1 + 0.42 1 . y 24.31 x 0.39 u 14.31 z
Note, that correlation matrix does not show close relationship between factors: r xu = 0–272; r xz = 0.379; r zu =0–390, therefore, there is no need to eliminate multicollinearity.
Share of influence of attribute feature in the overall coefficient of determination is 33.54 %. Such equation is statistically significant with probability of 99 % and adjusted R-squre is 0.868.
Finally, we analyze aggregate of four-room apartments (83 units of observation).
In this aggregate, average apartment area is 107.82 square meters. m, average price of 1 square. m – 52.79 thousand rubles, average cost of an apartment – 5692.53 thousand rubles. The structure of population is shown in fig. 7, 8. Aggregate is heterogeneous (coefficient of variation is 41.2 %), apartments in brick houses predominate.
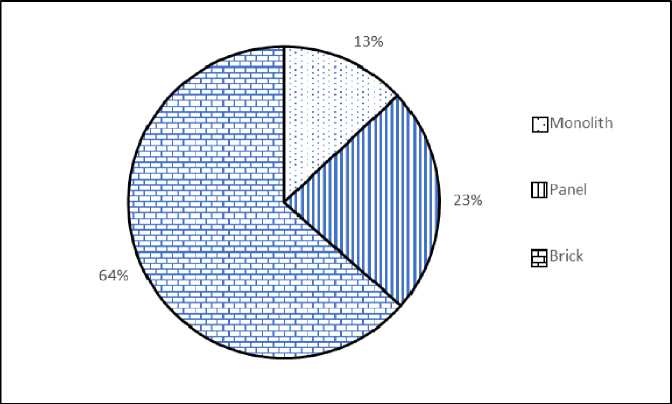
Fig. 6. Distribution of offered for sale three-room apartments by wall material, Krasnoyarsk, 2017 year
Рис. 6. Распределение предлагаемых к продаже трехкомнатных квартир по материалу стен, г. Красноярск, 2017 г.
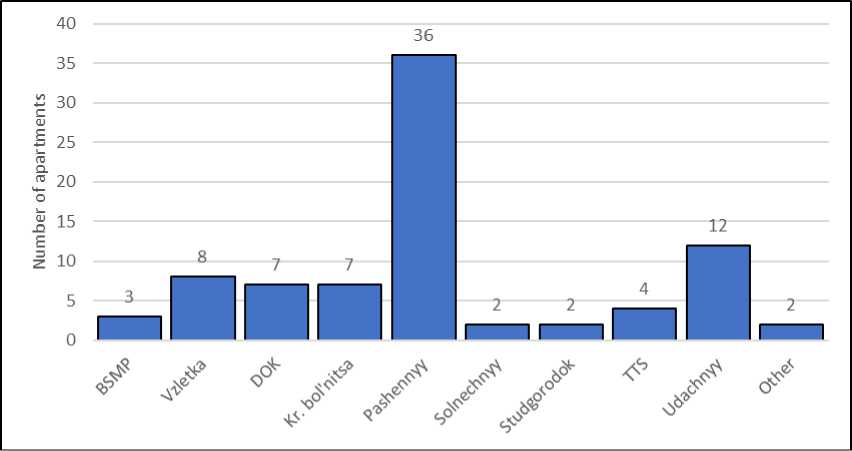
Fig. 7. Distribution of offered for sale four-room apartments by district of the city Krasnoayarsk, 2017 year
Рис. 7. Распределение предлагаемых к продаже четырехкомнатных квартир по районам, г. Красноярск, 2017 г.
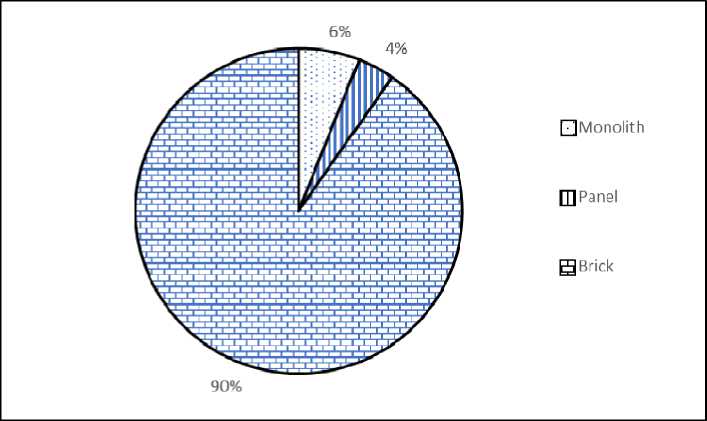
Fig. 8. Distribution of offered for sale four-room apartments by wall material, Krasnoyarsk, 2017 year
Рис. 8. Распределение предлагаемых к продаже четырехкомнатных квартир по материалу стен, г. Красноярск, 2017 г.
In a model containing only quantitative attributes:
^
= 1.11 1»
18.11 x 1
0.17 t
2.74 '
adjusted coefficient of determination is 0.930 and regression equation is statistically significant with a probability of 99 %.
Dealing with attributive features, we obtain equation
^
t„ = 0.96 1. + 0.04 t + 0.001 t .
y 29.13 x 1.38 u 0.02 z
Conclusion. Thus, the proposed method allows to analyze statistical data, elements of which are characterized by both numerical and attribute features (qualitative variable). This significantly improves quality of models and takes into account large amount of factors. This method can be easily applied to arbitrary aggregates.
References Attribute features application in specification of regression model of apartments cost
- Brening D. V., Pashkovskaya O. V., Senashov S. I., Savostyanova I. L. [Mathematical modeling of the cost of secondary housing in the city of krasnoyarsk in 2017]. Sibirskiy zhurnal nauki i tekhnologiy. 2018, Vol. 19, No. 4, P. 581–588 (In Russ.).
- Senashov S. I., Yuferova N. Yu., Vaytekunene E. L. Ekonometricheskoe modelirovanie stoimosti zhil’ya v Krasnoyarske [Econometric modelling of residential property cost in Krasnoyarsk]. Krasnoyarsk, SibGAU Publ., 2015, 178 p. (In Russ.).
- Pashkovskaya O. V., Senashov S. I., Savostyanova I. L., Yuferova N. Yu. [Modeling the cost of housing on the secondary real estate market in the city of Krasnoyarsk in 2016]. Sibirskiy zhurnal nauki i tekhnologiy. 2017, No. 4 (18), P. 788–796 (In Russ.).
- Senashov S. I. et al. [Actual modeling of real estate in Krasnoyarsk]. Vestik SibGAU. 2013, No. 2 (48), P. 86–91 (In Russ.).
- Senashov S. I., Yuferova N. Yu., Groshak E. V. Modelirovaniye stoimosti zhil'ya v g. Krasnoyarske [Simulation of the cost of residential property in the city of Krasnoyarsk]. Krasnoyarsk, SibGTU Publ., 2007, 204 p.
- Senashov S. I., Juferova N. Yu., Surnina E. V. [Information system of valuation of apartments on the secondary market as a tool for investment management]. Vestnik SibGAU. 2009, No. 4 (25), P. 219–223 (In Russ.).
- Senashov S. I. et al. [Cost estimation of information system of apartments at secondary housing markets as a management investment tool]. Vestnik SibGAU. 2009, No. 5, P. 154–157 (In Russ.).
- Denisenko I. K., Senashov S. I., Juferova N. Yu. [Modeling the cost of housing in Krasnoyarsk] Vestnik Sib. gos. tehnologich. un-ta. 2000, No. 1, P. 185–190 (In Russ.).
- Senashov S. I., Savostyanova I. L., Yuzaeva A. G., Savchenko L. M. [Simulation of the cost of residential properties in Krasnoyarsk for 2013-2014]. Vestnik SibGAU. 2016, Vol. 17, No. 3, P. 830–836 (In Russ.).
- Senashov S. I., Surnina E. V., Puzanova G. A., Filyushina E. V. [Methods of valuation of land]. Reshetnevskie chteniya. 2009, Vol. 2, No. 13, P. 549–650 (In Russ.).
- Surnina E. V., Senashov S. I. [The use of GIS technology for estimation of cost of apartments]. Aktualnye problemy aviatsii i kosmonavtiki. 2010, Vol. 1, No. 6, P. 444–445 (In Russ.).
- Senashov S. I., Savostyanova L. I. [Econometric modeling of the cost of housing]. Lesnoy i khimicheskiy kompleksy – problemy i resheniya. 2016, Vol. 2, P. 235– 236 (In Russ.).
- Savchenko L. M., Yusaeva A. G., Senashov S. I. [Modeling the cost of housing in the city of Krasnoyarsk in 2013]. Prospekt Svobodnyy-2016. 2016, P. 67–70 (In Russ.).
- Rusakova A. A., StarodubtsevA. A., Senashov S. I. [Modeling the cost of housing in the Central district of Krasnoyarsk]. Aktualnye problemy aviatsii i kosmonavtiki. 2017, Vol. 2, P. 398–401 (In Russ.).
- Brening D. V., Savostyanova I. L., Kvartiry Krasnoyarska 2017. Rynok pervichnogo zhil'ya [Flats of Krasnoyarsk 2017. Primary real estate market]. Svidetel’stvo o gosudarstvennoy registratsii bazy dannykh № 20186621065.
