Automated Cardiac Beat Classification Using RBF Neural Networks

Author: Ali Khazaee
Journal: International Journal of Modern Education and Computer Science (IJMECS) @ijmecs
Article in issue: 3 vol.5, 2013.
Free access
This paper proposes a four stage, denoising, feature extraction, optimization and classification method for detection of premature ventricular contractions. In the first stage, we investigate the application of wavelet denoising in noise reduction of multi-channel high resolution ECG signals. In this stage, the Stationary Wavelet Transform is used. Feature extraction module extracts ten ECG morphological features and one timing interval feature. Then a number of radial basis function (RBF) neural networks with different value of spread parameter are designed and compared their ability for classification of three different classes of ECG signals. Genetic Algorithm is used to find best value of RBF parameters. A classification accuracy of 100% for training dataset and 95.66% for testing dataset and an overall accuracy of detection of 95.83% were achieved over seven files from the MIT/BIH arrhythmia database.
ECG beat classification, Premature Ventricular Contraction, RBF Neural Network, Wavelet, Genetic Algorithm
Short address: https://sciup.org/15014531
IDR: 15014531
Text of the scientific article Automated Cardiac Beat Classification Using RBF Neural Networks
Published Online April 2013 in MECS DOI: 10.5815/ijmecs.2013.03.06
The analysis of the ECG has been widely used for diagnosing many cardiac diseases. The development of accurate and quick methods for automatic ECG classification is vital for clinical diagnosis of the heart diseases. An arrhythmia is any abnormal cardiac rhythm [1]. Among the various abnormalities related with functioning of the human heart, Premature Ventricular Contraction (PVC) is one the most important arrhythmias.
In the literature, several methods have been proposed for the automatic classification of ECG signals. In [2], 2nd, 3rd and 4th order cumulants of the ECG beat calculated and modeled by linear combinations of Hermitian basis functions. Then, the parameters of each cumulant model used as feature vectors to classify five different ECG beats namely as Normal, PVC, APC, RBBB and LBBB using 1-Nearest Neighborhood (1-NN) classifier. Finally, after classifying each model, a final decision making rule applied to these specified classes and the type of ECG beat defined. In [3], the authors compared the performances of three approaches. The first approach used principal components of segmented ECG beats, the second approach used principal components of error signals of linear prediction model, whereas the third approach used principal components of Discrete Wavelet Transform (DWT) coefficients as features. These features from three approaches were independently classified using feed forward neural network (NN) and Least Square-Support Vector Machine (LS-SVM). In [4], the authors described feature extraction methods using higher order statistics (HOS) of wavelet packet decomposition (WPD) coefficients for the purpose of automatic heartbeat recognition. The method consisted of three stages. First, the wavelet package coefficients (WPC) were calculated for each different type of ECG beat. Then, higher order statistics of WPC were derived. Finally, the obtained feature set was used as input to a classifier, which was based on k-NN algorithm. In [5], Discrete wavelet transform used to extract the morphological features of ECG signals and a multi-class support vector machine (SVM)-based classifier employed to classify them. Then a genetic algorithm used for optimization of the relevant parameters of system. These parameters were: wavelet filter type for feature extraction, wavelet decomposition level, and classifier’s parameters. In [6], the authors proposed a new power spectral-based hybrid genetic algorithm-support vector machines (SVMGA) technique to classify five types of electrocardiogram (ECG) beats, namely normal beats and four manifestations of heart arrhythmia.
In this paper, we have proposed an automated method for recognition of PVC heartbeats from a normal beat and the other ones. The proposed automated method for the classification of cardiac arrhythmias is based on signal preprocessing, feature extraction, optimization and classification. For signal preprocessing, multiple methods such as noise removal filtering with wavelet, smoothing, normalization and QRS complex detection were used. An un-decimated wavelet transform is used to provide an informative representation which is both robust to noise and tuned to the morphological characteristics of the waveform features. For feature extraction module we have used a suitable set of features that consist both morphological and temporal features to include both of the shaping and timing information of signal. Then we investigated the different Radial Basis Function (RBF) neural networks with varying the value of spread parameter for functions of those neural networks. Then we have prepared some experiments to measure their performances and compare among them. Genetic Algorithms (GAs) used to optimize RBF classifiers.
The paper is organized as follows. Section 2 describes the preprocessing module. Section 3 explains the feature extraction. Section 4 presents the classifier. Section 5, describes genetic algorithms and section 6 introduces the database and performance metrics. Section 7 shows some simulation results. Section 8 discusses the results and finally Section 9 concludes the paper.
-
II. signal preprocessing
Noise reduction is one the important problem for analysis of ECG signals. The most troublesome noise sources are electrical activity of muscles (EMG) and instability of electrode-skin contact [7]. For removal of such noise an advanced signal processing method, such as discrete wavelet transform (DWT) denoising technique [8] may be used. However, DWT is not a time-invariant transform. To overcome this problem, we used the stationary wavelet transform (SWT). SWT uses the average of several de-noised signals which are obtained from the coefficients of ε-decimated DWT [9].
Suppose the signal 5 E L ( R ) . The SWT is given by:
+M
W v (T ) = - 5 ( t ) ^*l — dt (1)
V v I v )
-M
Where v = 2 k , k e Z , t e R , and T " is the complex conjugate of the mother wavelet.
For denoising, based on the extensive experiments we have used the Daubechies wavelet functions (db1) with decomposition level of five. For smoothing of the ECG signals, we have used the Savitsky-Golay filtering method [9]. The filter coefficients are achieved by the un-weighted linear least-squares fitting method using a polynomial function. For this reason, the Savitzky-Golay filter is also called digital smoothing polynomial filter or a least-squares smoothing filter. A higher degree of polynomial makes it possible to achieve a high level of smoothing without attenuation of the data features. The Savitzky-Golay filtering method is often used for frequency information or spectroscopic (peak) information. For the first type, it preserves the high-frequency components of the signal and for the second type it preserves higher moments of the peak.
-
III. F eature E xtraction
Feature extraction plays an important role in any classification task. In this research, based on the extensive research, we have used a suitable combination of morphological features and timing features. The extracted parameters that describe the basic shape of the beats are: amplitude of P-peak (ampP), amplitude of Q-valley (ampQ), amplitude of R-peak (ampR), amplitude of S-valley (ampS) and amplitude of T-peak (ampT). Features that describe the position of waves in the window of beat are: position of P-peak (posP), position of Q-valley (posQ), position of R-peak (posR), position of S-valley (posS) and position of T-peak ( posT). For extraction these features we propose a two steps method. The first step involves the cutting of the normal and PVC and other beats by making use of the annotation files which exist in MIT-BIH arrhythmia database. The second step involves identification the peaks and valleys in every normal or abnormal beats and obtaining their respective amplitudes and positions. After cutting all beats in first step, it is needed to detect the peak and valley of them. For this purpose, we have implemented the Al-Alaoui algorithm [10].
In addition to the morphological features, we extract the local timing feature. An RR-interval ratio (IR) reflecting the deviation from a constant beat rate was defined as:
Where T represents the time at which the R-wave for beat i occurs. The local RR-interval ratio information was chosen as opposed to other parameters such as average RR-interval or time series because it provides a convenient differentiator between normal beats ( IR « 1) and PVC beats ( IR < 1) , and is normalized by definition ( IR = 1at constant rate).
-
IV. N eural N etwork C lassifier
We have used RBF neural networks (NNs) as the classifier. RBF neural networks with their structural simplicity and training efficiency are good candidate to perform a nonlinear mapping between the input and output vector spaces. RBF NN is a fully connected feed forward structure and consist of three layers namely, an input layer, a single layer of nonlinear processing units, and an output layer.
The network structure is shown in Fig 1. Input layer is composed of input nodes that are equal to the dimension of the input vector x. The output of the jth hidden neuron with Gaussian transfer function can be calculated as
^ = e ° 2 (3)
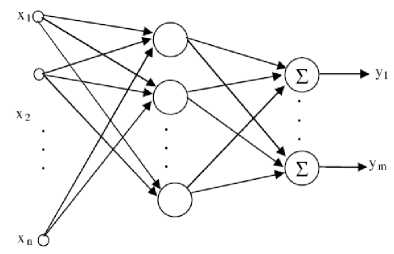
Input layer Hidden layer Output layer
Figure 1. Structure of RBF Neural Network
Where h is the output of the jth neuron, x e ^ n X 1 is an input vector, Cj e ^ n X 1 is the jth RBF center, g is the center spread parameter which controls the width of the RBF, and . 2 represents the Euclidean norm. The output of any neuron at the output layer of RBF network is calculated as
Ek j , wjhj (4)
Where w is the weight connecting hidden neuron j to output neuron i and k is the number of hidden layer neurons.
The mapping properties of the RBF NN can be modified through the weights in the output layer, the centers of the RBFs, and spread parameter of the Gaussian function. The simplest form of RBF network training can be obtained with fixed number of centers. If the number of centers is made equal to the number of input vectors, namely exact RBF, then the error between the desired and actual network outputs for the training data set will be equal to zero. In this work, exact RBF NN was used. The number of RBF centers was made equal to the number of input vectors.
-
V. G enetic A lgorithm
In GA, a candidate solution for a specific problem is called an individual or a chromosome and consists of a linear list of genes. Each individual represents a point in the search space, and hence a possible solution to the problem. A population consists of a finite number of individuals. Each individual is decided by an evaluating mechanism to obtain its fitness value. Based on this fitness value and undergoing genetic operators, a new population is generated iteratively with each successive population referred to as a generation. The GAs uses three basic operators (reproduction, crossover, and mutation) to manipulate the genetic composition of a population. Reproduction is a process by which the most highly rated individuals in the current generation are reproduced in the new generation. The crossover operator produces two offsprings (new candidate solutions) by recombining the information from two parents. There are two processing steps in this operation. In the first step, a given number of crossing sites are selected uniformly, along with the parent individual at random. In the second step, two new individuals are formed by exchanging alternate pairs of selection between the selected sites. Mutation is a random alteration of some gene values in an individual. The allele of each gene is a candidate for mutation, and its function is determined by the mutation probability.
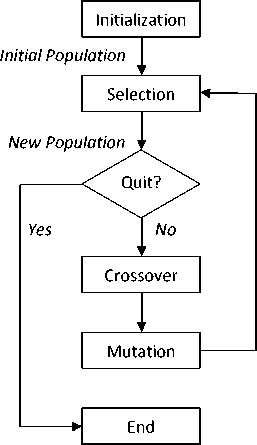
The GA is called a population-based technique because instead of operating on a single potential solution, it uses a population of potential solutions. The larger the population, the greater the diversity of the members of the population, and the larger the area searched by the population. The overall genetic algorithm can be defined by the simple process shown in Fig 2.
Old Population
Figure 2. The operation of a generic GA
Fig 2 illustrates the operation of a general genetic algorithm. The operation starts from an initial population of randomly generated individuals. Then the population is evolved for a number of generations and the qualities of the individuals are gradually improved. During each generation, three basic genetic operators are sequentially applied to each individual with certain probabilities, i.e., selection, crossover (recombination), and mutation. First, a number of best-fit individuals are selected based on a user-defined fitness function. The remaining individuals are discarded. Next, a number of individuals are selected and paired with each other. Each individual pair produces one offspring by partially exchanging their genes around one or more randomly selected crossing points. At the end, a certain number of individuals are selected and the mutation operations are applied, i.e., a randomly selected gene of an individual abruptly changes its value.
-
VI. D atabase and P erformance M etrics
The MIT-BIH arrhythmia database [11] was used as the data source in this study. The database contains 48 recordings, each has a duration of 30 minutes and includes two leads—the modified limb lead II and one of the modified leads V1, V2, V4 or V5. There are over 109,000 labeled ventricular beats from 15 different heartbeat types. The database is annotated both in timing information and beat Classification. For more details about MIT-BIH Arrhythmia database see [12]. We used a total of seven records with numbers: 100, 101, 102, 104, 105, 106, and 107 from the database. We have extracted from them 15,566 beats, 8,390 normal beats, 627 abnormal PVC arrhythmia beats, and 6,549 beats from the other arrhythmias. Also for locating beats in ECG signals we used the annotation files from database.
Various approaches are adopted to evaluate the classifier performances in literature. In this study, we have considered four statistical indices: Accuracy (Acc), Sensitivity (Se), Specificity (Sp), and Positive Predictivity (Pp), which are defined in the following equations (5-8), respectively.
The most crucial metric for determining overall system performance is usually accuracy. We defined the overall accuracy of the classifier for each file as follows:
Acc =
N T N E
NT
x 100
In this equation, Acc is the accuracy, and the variables, N and N , represent the total number of classification errors and beats in the file, respectively. Sensitivity, Se, the ratio of the number of correctly detected events, TP (true positives), to the total number of events is given by:
Se =
TP
TP + FN
x 100
Where FN (false negatives) is the number of missed events. The specificity, Sp, the ratio of the number of correctly rejected nonevents, TN (true negatives), to the total number of nonevents is given by:
TN
Sp =---- N — x 100 (7)
TN + FP
Where FP (false positives) is the number of falsely detected events. Positive predictivity, Pp, is the ratio of the number of correctly detected events, TP, to the total number of events detected by the analyzer and is given by:
TP
Pp =-------x 100 (8)
TP + FP
Sensitivity measures how successfully a classifier recognizes beats of a certain class without missing them whereas positive predictivity measures how exclusively it classifies beats of a certain type.
-
VII. R esults
To classify the ECG waveforms into three different classes, the number of neurons in the output layer is defined to be three.
The output (target) vector is defined with a combination of 1 or 0 s to represent each of the classes being recognized (Table 1). We have randomly selected 200 beats from each class, and used these 600 beats for training of neural networks. Total number of beats in our database is 15,566 beats. Easily it can be seen that the number of our training set is less than %4 of the all beats. Thus we can claim the good generalization ability of our study. The large amount of training data cause the system to be over-fitted to the training data, rather than generalized on the more global features and aspects of PVC beats.
In table 2 we investigated the accuracy of classifier with multiple values of spread parameter for the classification of ECG signals into three classes in order to detecting a premature ventricular contraction arrhythmia. In addition to accuracy, sensitivity and positive predictivity for each of classes was calculated.
However, the value of spread parameter for the RBF classifier is not optimum. To find optimum value of this parameter we used GA. The initial population of the genetic algorithm is consisted of 15 chromosomes. Each chromosome represents value of spread parameter, which is a number between 0.01 and 10. At follows, we describe proposed GA-based method for classification of ECG signals. When a random chromosome is selected, the value of spread parameter represented by this chromosome sent to RBF classifiers for realizing the training and testing of RBF classifiers by using parameters related with this chromosome. The classification accuracy then computed and assumed as fitness value of chromosome. In this study, the Roulette Wheel selection scheme is used. This is a stochastic algorithm and involves the following technique: The individuals are mapped to contiguous segments of a line, such that each individual’s segment is equal in size to its fitness. A random number is generated and the individual whose segment spans the random number is selected. The process is repeated until the desired number of individuals is obtained (called mating population). This technique is analogous to a roulette wheel with each slice proportional in size to the fitness. The roulette-wheel selection algorithm provides a zero bias but does not guarantee minimum spread. In this step we select 15 individuals (chromosomes). The recombination (crossover) method in this section can be applied for the recombination of individuals with real valued variables. In this study, the Intermediate Recombination scheme is used. Intermediate recombination is a method only applicable to real variables (and not binary variables). Here the variable values of the offspring are chosen somewhere around and between the variable values of the parents.
Offspring are produced according to the rule:
Var i0 = Var p . a i + Var p .(1 - a i ) (9)
i e (1,2,..., N var), a i e [ - d ,1 + d ] uniform at random, d = 0.25 , a i for each i new
Where a is a scaling factor chosen uniformly at random over an interval [-d, 1+d] for each variable anew.
The value of the parameter d defines the size of the area for possible offspring. A value of d = 0 defines the area for offspring the same size as the area spanned by the parents. This method is called (standard) intermediate recombination. Because most variables of the offspring are not generated on the border of the possible area, the area for the variables shrinks over the generations. This shrinkage occurs just by using (standard) intermediate recombination. This effect can be prevented by using a larger value for d. A value of d=0.25 ensures (statistically), that the variable area of the offspring is the same as the variable area spanned by the variables of the parents. In this study d= 0.25 is used.
Intermediate recombination is capable of producing any point within a hypercube slightly larger than that defined by the parents [13].
The 85% portion of the 15 chromosomes obtained in previous step are randomly selected and subjected to crossover operator. Namely, 12 chromosomes are subjected to crossover operator. At the final of the crossover operations, 12 new chromosomes are obtained.
Each gene undergoes mutation with a fixed probability 5%. For binary representation of chromosomes, a bit position (or gene) is mutated by simply flipping its value. Since we are considering real valued representation in this article, we use the following mutation. A number 5 in the range [0, 1] is generated with uniform distribution. If the value at a gene position is v , after mutation it becomes v ± 5 * v, v * 0, (10)
v + 5 , v = 0. (11)
The ‘+’ or ‘-’ sign occurs with equal probability. The mutation is considered such that its result is not a negative value [14].
At the final of the mutation operation, 2 new chromosomes are obtained. There are total 14 chromosomes in population of next generation at the final of previous step and this step.
We have implemented elitism at each generation by preserving the best string seen up to that generation into the next population. This eliminates the loss of good chromosomes and keeps the diversity of population. Thus on termination, the fifteenth chromosome contains the best approach met in the all of genetic algorithm generations. We implemented another elitism which does not contribute in the next generation. A same size external population constructed that keeps best chromosomes in the all of previous generations. The population is compared with current population in each generation and is updated with better chromosomes.
Since spread parameter is positive integer number, we corrected the population at the end of each generation for the next generation.
Classification results obtained by proposed method are shown in Table 3.
Table 4 shows the file-by-file comprehensive results for a sample RBF neural network (The network with spread parameter of three).
Performance of the RBF neural network is represented in Fig 3.
-
VIII. D iscussion
In table 1, it can be seen that the best performance for RBF neural networks are achieved by the spread parameter with value of three. Since the goal MSE for training was set to be zero, so the accuracy of training for all networks is %100.
Also as it can be seen in table 1, in most cases the RBF neural networks have a good positive predictivity for the “Normal” class. This means that in our problem the probability of the classification of the “PVC” and “Other” beats as “Normal” beat is lowest and vice versa. As a result the probability of indiscrimination of a patient with PVC or other arrhythmias is very small. This status of misclassification is better than the opposite status, because it has a smaller risk.
In the file-by-file test (Table 2), it is found that the performance of the classifier degrades with any files that contain a large number of fused beats. This result is consistent with the results that obtained from the [15]. In file 104, which contains the largest percentage of fused beats (29.9%), the classification accuracy is about 88.8689%. Also they show very low positive predictivity in the “Normal” and “other” beats classes. The reason may be due to the fact that fused beats are to be classified as “other”, while their morphology and timing information can closely resemble the normal beats.
-
IX. C onclusion
We have proposed a number of efficient methods for accurate classification of ECG beats for a relatively large set of data. These methods include three modules: an efficient preprocessing module, feature extraction module and classifier. For preprocessing module we have used a stationary wavelet transform for denoising, a Savitsky-Golay filter for smoothing and normalization. In the feature extraction module we have extracted the ten morphological and pre-/post RR-interval ratio as the effective features for differentiating normal beats, PVC and other beats. Then a number of radial basis function (RBF) neural networks with different values of spread parameter are designed and compared their ability for classification of three different classes of ECG signals. A classification accuracy of 100% for training dataset and 95.66% for testing dataset and an overall accuracy of detection of 95.83% were achieved over seven files from the MIT/BIH arrhythmia database.
TABLE I. ECG classes and representation of desired neural network outputs
|
Classes |
ECG Class Description |
Neural Network Outputs |
||
|
1 |
Normal |
1 |
0 |
0 |
|
2 |
Premature Ventricular Contraction Arrhythmia |
0 |
1 |
0 |
|
3 |
Other Arrhythmias |
0 |
0 |
1 |
TABLE II. C lassification results obtained by proposed method
|
Proposed Method |
Spread |
Recognition accuracy (%) |
Normal |
PVC |
Other |
|
|
Run #1 |
111.9362 |
95.9775 |
Normal |
7969 |
88 |
133 |
|
PVC |
19 |
385 |
23 |
|||
|
Other |
244 |
95 |
6010 |
|||
|
Run #2 |
111.7929 |
95.9107 |
Normal |
7949 |
97 |
144 |
|
PVC |
21 |
382 |
24 |
|||
|
Other |
226 |
100 |
6023 |
TABLE III. C omparative results for studying the accuracies (A cc ) of different spread parameter values for classification of
PVC arrhythmias .
|
Spread Parameter |
Accuracy in Train |
Accuracy in Test |
Normal |
PVC |
Others |
MSE in Test |
|||
|
Se |
Pp |
Se |
Pp |
Se |
Pp |
||||
|
1 |
100 |
84.52 |
75.24 |
99.42 |
51.52 |
75.60 |
98.71 |
73.93 |
0.30 |
|
1.5 |
100 |
86.02 |
88.21 |
99.08 |
97.42 |
17.50 |
82.44 |
98.79 |
0.30 |
|
2 |
100 |
94.68 |
93.22 |
98.84 |
78.45 |
77.19 |
97.65 |
91.08 |
0.31 |
|
2.5 |
100 |
95.47 |
95.26 |
98.08 |
82.67 |
76.08 |
96.60 |
93.68 |
0.32 |
|
3 |
100 |
95.66 |
96.43 |
97.04 |
87.82 |
75.60 |
95.20 |
95.47 |
0.33 |
|
3.5 |
100 |
95.36 |
96.89 |
96.11 |
88.76 |
74.02 |
93.83 |
96.11 |
0.35 |
|
4 |
100 |
95.24 |
97.07 |
95.89 |
89.70 |
71.06 |
93.26 |
96.50 |
0.36 |
|
4.5 |
100 |
95.13 |
97.12 |
95.67 |
90.16 |
70.00 |
92.90 |
96.66 |
0.38 |
|
5 |
100 |
94.84 |
97.16 |
95.48 |
89.46 |
66.32 |
92.22 |
96.78 |
0.40 |
TABLE IV. D etailed R esults for F ile - by -F ile I ncluding B oth T est and T rain D ataset
|
Records |
Confusion matrix |
Performance Metrics |
|||||||||
|
Normal |
PVC |
Other |
Accuracy |
Normal |
PVC |
Other |
|||||
|
Se |
Pp |
Se |
Pp |
Se |
Pp |
||||||
|
100 |
Normal |
2236 |
2 |
0 |
98.46 |
99.91 |
98.55 |
100 |
33.33 |
0 |
- |
|
PVC |
0 |
1 |
0 |
||||||||
|
Other |
33 |
0 |
0 |
||||||||
|
101 |
Normal |
1849 |
1 |
9 |
99.30 |
99.46 |
99.84 |
- |
0 |
40.00 |
18.18 |
|
PVC |
0 |
0 |
0 |
||||||||
|
Other |
3 |
0 |
2 |
||||||||
|
102 |
Normal |
89 |
0 |
10 |
98.86 |
89.90 |
92.71 |
75.00 |
30.00 |
99.33 |
99.47 |
|
PVC |
0 |
3 |
1 |
||||||||
|
Other |
7 |
7 |
2069 |
||||||||
|
104 |
Normal |
124 |
18 |
21 |
88.87 |
76.07 |
39.62 |
50.00 |
2.63 |
89.92 |
98.83 |
|
PVC |
0 |
1 |
1 |
||||||||
|
Other |
189 |
19 |
1855 |
||||||||
|
105 |
Normal |
2307 |
29 |
189 |
91.40 |
91.37 |
100 |
97.56 |
56.34 |
60.00 |
1.55 |
|
PVC |
0 |
40 |
1 |
||||||||
|
Other |
0 |
2 |
3 |
||||||||
|
106 |
Normal |
1493 |
1 |
12 |
97.73 |
99.14 |
99.67 |
93.65 |
99.80 |
- |
0 |
|
PVC |
5 |
487 |
28 |
||||||||
|
Other |
0 |
0 |
0 |
||||||||
|
107 |
Normal |
0 |
0 |
0 |
99.25 |
- |
0 |
72.88 |
100 |
100 |
99.28 |
|
PVC |
1 |
43 |
15 |
||||||||
|
Other |
0 |
0 |
2077 |
||||||||
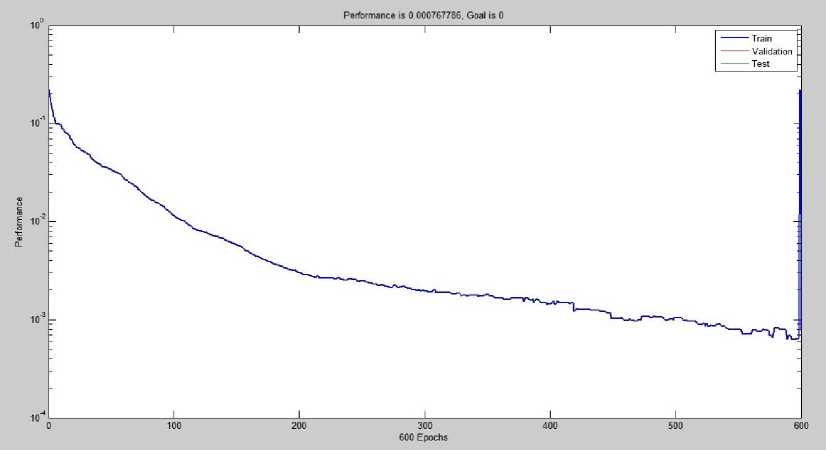
Figure 3. Performance of the RBF classifier
References Automated Cardiac Beat Classification Using RBF Neural Networks
- G. D. Clifford, F. Azuaje, P. E. McShary, Advanced Methods and Tools for ECG Data Analysis, Artech House: Norwood, MA 02062, 2006.
- S. Karimifard and A. Ahmadian, A robust method for diagnosis of morphological arrhythmias based on Hermitian model of higher order statistics, BioMedical Engineering OnLine 10:22, 2011.
- R. J. Martis, U. R. Acharya, K.M. Mandana, A.K. Ray and C. Chakraborty, Application of principal component analysis to ECG signals for automated diagnosis of cardiac health, Expert Systems with Applications 39, 11792–11800, 2012.
- Y. Kutlua and D. Kuntalpb, Feature extraction for ECG heartbeats using higher order statistics of WPD coefficients, computer methods and programs in biomedicine 105, 257–267, 2012.
- A. E. Zadeh and A. Khazaee, High Efficient System for Automatic Classification of the Electrocardiogram Beats, Annals of Biomedical Engineering, 2011.
- A.Khazaee, A. Ebrahimzadeh, Classification of electrocardiogram signals with support vector machines and genetic algorithms using power spectral features, Biomedical Signal Processing and Control 5, pp. 252–263, 2010.
- M. Kania, M. Fereniec, and R. Maniewski., "Wavelet Denoising for Multi-lead High Resolution ECG Signals," Measurement Science Review, Vol. 7, Section 2, No. 4, 2007.
- Donoho D., Johnstone I., "Adapting to unknown smoothness via wavelet shrinkage," J. ASA, 1995, vol. 90, pp. 1200–1223.
- Donoho D., "De-Noising by soft-thresholding," IEEE Trans. on Inf. Theory, vol. 41, 3, pp. 613-627.
- M. A. Al-Alaoui, "A unified analog and digital design to peak and valley detector, window peak and valley detectors, and zero crossing detectors," IEEE Transactions on Instrumentation and Measurement, vol. 35, pp. 304-307, 1986.
- R. Mark and G. Moody, MIT-BIH Arrhythmia Database 1997 [Online]. Available: http://ecg.mit.edu/dbinfo.html
- G. B. Moody and R. G. Mark, "The impact of the mit/bih arrhythmia database," IEEE Eng. Med. Biol. Mag., vol. 20, no. 3, pp. 45–50, May- Jun. 2001.
- S. Sumathi, T. Hamsapriya, P. Surekha, Evolutionary Intelligence: An Introduction to Theory and Applications with Matlab, Springer-Verlag Berlin Heidelberg, 2008.
- S. Bandyopadhyay, and S. K. Pal, Classification and Learning Using Genetic Algorithms, Springer-Verlag Berlin Heidelberg, 2007.
- O. T. Inan, L. Giovangrandi, and G. T. A. Kovacs, Robust Neural Network Based Classification of Premature Ventricular Contractions Using Wavelet Transform and Timing Interval Features, IEEE Trans. Biomed. Eng., vol. 53, no. 12, pp. 2507–2515, Dec. 2006.
