Automated paddy variety recognition from color-related plant agro-morphological characteristics

Author: Basavaraj S. Anami, Naveen N. M., Surendra P.
Journal: International Journal of Image, Graphics and Signal Processing @ijigsp
Article in issue: 1 vol.11, 2019.
Free access
The paper presents an image-based paddy plant variety recognition system to recognize 15 different paddy plant varieties using 18 color-related agro-morphological characteristics. The k-means color clustering method has been used to segment the target regions in the paddy plant images. The RGB, HSI and YCbCr color models have been employed to construct color feature vectors from the segmented images and the feature vectors are reduced using Principal Component Analysis (PCA) technique. The reduced color feature vectors are used as input to back propagation neural network (BPNN) and support vector machine (SVM). The set of six combined agro-morphological characteristics recorded during maturity growth stage has given the highest average paddy plant variety recognition accuracies of 91.20% and 86.33% using the BPNN and SVM classifiers respectively. The work finds application in developing a tool for assisting botanists, Rice scientists, plant breeders, and certification agencies.
Paddy plant, variety recognition, DUS agro-morphological characteristics, k-means clustering, PCA
Short address: https://sciup.org/15016023
IDR: 15016023 | DOI: 10.5815/ijigsp.2019.01.02
Text of the scientific article Automated paddy variety recognition from color-related plant agro-morphological characteristics
Published Online January 2019 in MECS
India is one of the principal paddy producing countries in the world and blessed with a rich diversity of around 120,000 varieties. It has been estimated from various surveys that nearly 50,000 of paddy varieties are still being grown in the country. This accessible collection of diverse varieties has made great contributions to rice breeding and played a very important role in the local food security and sustainable development of agriculture. The characterization and recognition of the paddy plant varieties are of great significance and an essential prerequisite in modern day agriculture as they play a major role in plant breeding as well as for plant variety protection. To achieve this, plant breeders have been using DNA markers, plant agro-morphological characteristics and farmer-level surveys. However, these three approaches have inherent uncertainty levels and this can be overcome by employing the computer vision techniques. In India, the uniqueness of a paddy plant variety from existing varieties is established by standard distinctiveness, uniformity, and stability (DUS) testing guidelines (Shobha et al. 2006). Distinctiveness means that a variety is clearly distinguishable by at least one essential characteristic from any other variety, whose existence is a matter of common knowledge. Uniformity implies that the variety should be sufficiently uniform in its essential characteristics subject to variation as expected from the features of its propagation. Stability requires the essential characteristics remain unchanged after repeated propagation. The accurate description and identification of paddy varieties are crucial for DUS testing. The identity of a rice variety is established by using a set of morphological characteristics. Sixty-two agro-morphological characteristics are conventionally used in the DUS test for varietal identification from paddy field crops (Sridhar et al. 2016). The agro-morphological characteristics of paddy plant organs are shown in Fig. 1. With the increase in the number of paddy varieties, it has become difficult to identify and characterize these varieties only on the basis of morphological characteristics of the crop plant alone. Commonly used conventional DUS procedures are laborintensive, time-consuming, expensive, environment dependent, and many times make subjective decisions. It has enabled the exploration of new methods such as image processing, robotics and high-performance computing to capture multiple observable characteristics at high resolution, high precision, and high throughput.
The paddy plants are observed regularly at different growth stages in order to record the agro- morphological characteristics of each variety. The paddy plants of different varieties exhibit color variations in agro-morphological characteristics during relevant growth stages (Subudhi et al. 2012). The color variations observed are white, green, pink, red, gold, brown, sooty black and several shades of purple. The color-related agro-morphological characteristics recorded at different plant growth stages are listed in Table 1. From Table 1, five stages of growth from germination thru maturity are considered and a total of 18 color-related agro- morphological characteristics are observed from all the five growth stages. This forms the basis for the present work and the attempt has been made to develop an image processing technique for recording the color variations in plants at different growth stages to automate the task of paddy plant variety identification. To know the state-of-the-art in automation of such activities in agriculture field, a survey has been made and the following papers have been cited during the literature survey to understand the different applications of computer vision in allied areas of the present work carried out.
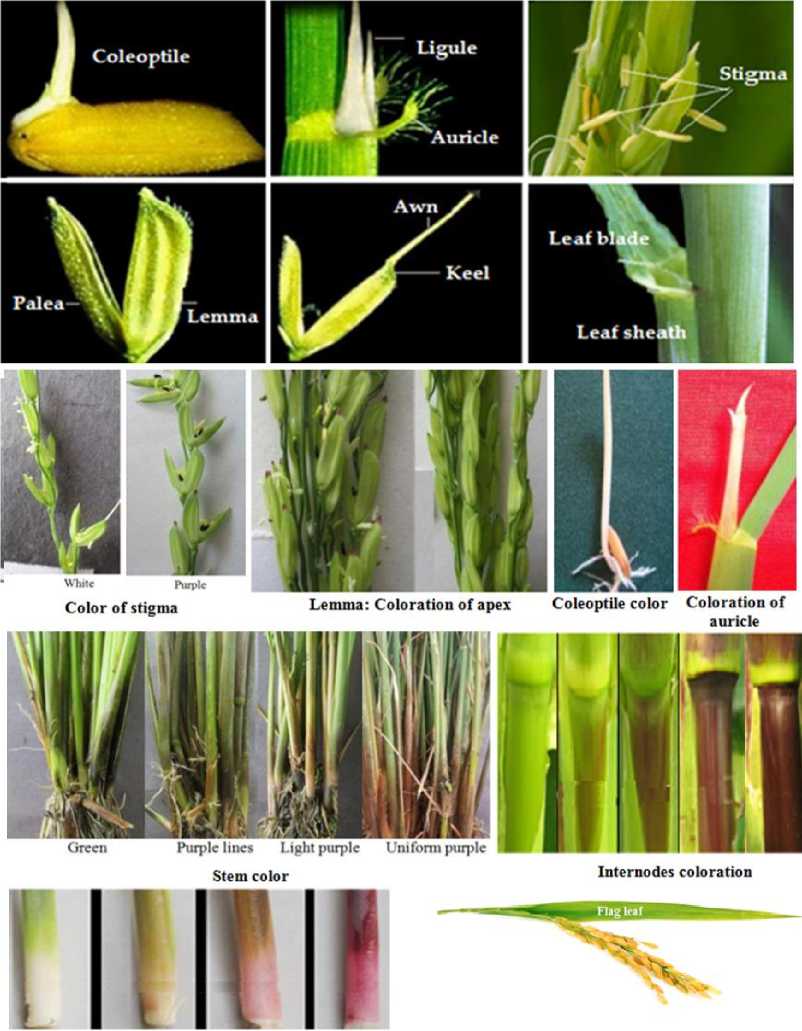
Basal leaf: sheath color
Fig.1. Images of color-related agro-morphological characteristics of paddy plants
Table 1. List of color-related agro-morphological characteristics of paddy plants and their stage of observation
|
Sl. No. |
Growth stage |
Days after sowing |
Plant character identifier |
Agro-morphological characteristics (plant characters) |
Colors observed during visual inspection |
|
1 |
Germination |
6 - 9 |
C1 |
Coleoptile color |
Colorless, green, purple |
|
2 |
Booting |
40 - 55 |
C2 |
Basal leaf sheath color |
Green, light purple, purple lines, uniform purple |
|
C3 |
Leaf color |
||||
|
C4 |
Leaf sheath color |
||||
|
C5 |
Coloration of auricle |
||||
|
3 |
Anthesis halfway |
55-70 |
C6 |
Flag leaf color |
White, light green, yellow, light purple, purple |
|
C7 |
Coloration of area below apex |
||||
|
C8 |
Coloration of apex |
||||
|
C9 |
Spikelet stigma color |
||||
|
4 |
Milk development |
70-85 |
C10 |
Stem color |
White, light green, yellow, light purple |
|
C11 |
Coloration of nodes |
||||
|
C12 |
Coloration of internodes |
||||
|
5 |
Maturity |
85-100 |
C13 |
Flag leaf color |
Gold, brown, red, purple, black |
|
C14 |
Lemma and palea color |
||||
|
C15 |
Panicle color |
||||
|
C16 |
Sterile lemma color |
||||
|
C17 |
Spikelet lemma tip color |
||||
|
C18 |
Leaf senescence |
(Grillo et al. 2017) presented an image analysis method to identify 52 different wheat varieties using 138 morpho-colorimetic quantitative variables extracted from the digital images of glumes. The average identification accuracy of 89.7% was obtained using the Linear Discriminant Analysis classifier. (Perez-Sanz et al. 2017) presented a review study on image-based automatic plant phenotype acquisition techniques and image data analysis algorithms. It addresses a common set of problems, including data acquisition and analysis. (Sachit Purohit and Savitha Gandhi, 2017) developed an image-based automated plant species identification system using information provided by different parts of the plants like a leaf, flower, fruit, and bark of the stem. For flower category, the fusion of shape, color and texture features are used. For other categories like stem, fruit, leaf and leaf scan, sparsely coded SIFT features pooled with the spatial pyramid matching approach is used. Maximum accuracy of 98% is obtained from leaf scan images. (Joly A. et al. 2014) developed an automated botanical identification system which is able to consider a combination of leaf, flower, fruit, and bark images for plants classification. The shape, color and texture features were used in the classification process.
The local texture features, namely speeded up robust features (SURF), edge orientation histogram (EOH), histogram of lines orientation and position (HOUGH), and Fourier histogram was concatenated with HSV histogram color features for 2200 plant species classification. (Yang et al. 2013) discussed the significance of image-based plant phenomics and the multidisciplinary image-based applications for quantifying the physical and biochemical characteristics of rice and other crops. (Caglayan et. al. 2013) developed a computer-aided plant identification system using shape and color features extracted from leaf images. The Random Forest classification method was used to classify 32 plant species and obtained a classification accuracy of 96.32%. (Korir et. al. 2013) presented a review study on DNA genetic fingerprints based plant identification tests. (Kumar N. et. al. 2012) developed an application to identify 184 plant species based on the curvature of the leaf’s contour features over multiple scales. The colorbased segmentation was carried out to extract shape features from leaf curvature. The application yielded an average plant identification accuracy of 96.8%. (Shearer and Holmes. 1990) identified plants images by colortexture characterization of canopy sections. 3 color cooccurrence matrices were derived for each color attribute (intensity, saturation, and hue) and 11 texture features were calculated from each of the matrices. Average classification accuracy of 91% was achieved for seven common cultivars of nursery stock using discriminant analysis model. (Ito and Akihama, 1962) presented an approach for classifying paddy varieties on the basis of plant height, straw strength, disease resistance, and color of various plant parts. The MUNSELL’s color system (leaf color chart) was adopted to quantify the color characteristics in paddy plants. A total of six characteristics, considering three characteristics during heading growth stage and three characteristics during maturity growth stage were selected for discriminating ten paddy varieties.
From the literature survey, it is observed that the several research works have been published on the recognition of plants using shape, color and texture features extracted from the images of plant parts namely leaf, flower, fruit, grain, stem, and bark. Most of the researchers agree on a general workflow to identify plant species based on images of leaves. Very few studies have tackled the problem of classifying paddy plant varieties based on color-related agro-morphological characteristics and the genetic attributes. However, no referable results and sophisticated works have been cited with respect to the paddy plant variety recognition using image processing techniques. This brings the desire of developing a comprehensive paddy plant identification system.
The remaining part of the paper is organized into three sections. Section 2 gives the proposed methodology. Section 3 deals with the results and discussion. Section 4 gives the conclusion of the work.
-
II. Proposed Methodology
The proposed methodology is divided into five stages, namely image acquisition, segmentation, color feature extraction, color feature selection and plant variety recognition. The color features are extracted from the images of corresponding individual paddy plant organs and the features are considered for the recognition of paddy plant varieties. The block diagram of the proposed methodology is shown in Fig 2.
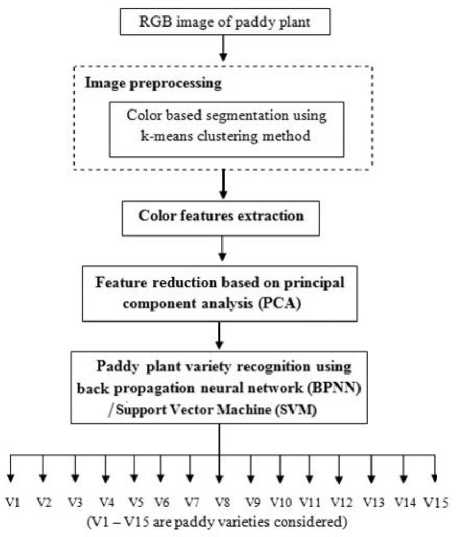
Fig.2. Block diagram of the proposed methodology
-
A. Crop sample preparation
In consultation with University of Agricultural Sciences, Dharwad, Karnataka State, India, 15 certified and popular paddy varieties are selected as experimental grain samples. The paddy grains are obtained from All India Coordinated Rice Improvement Project (AICRIP), Mugad, Dharwad and the variety names are listed in Table 2. The grain samples are having 100% physical and genetic purity. The collected paddy grains were sown separately in raised bed nursery (direct seeding) as per the DUS guidelines. All the necessary precautions were taken to maintain a uniform plant population of each variety. The recommended package of practices was adopted besides providing necessary plant protection measures to raise a healthy crop. The observations were carried out under conditions favoring normal growth and expression of all test characteristics to fulfill the objectives of the study. The field test was conducted during kharif season of 2017 at Mugad, Karnataka, India.
Table 2. List of paddy varieties considered in the present work
|
Sl. No. |
Paddy variety |
Variety identifier |
|
1 |
Abhilasha |
V1 |
|
2 |
Bhagyajyothi |
V2 |
|
3 |
Budda |
V3 |
|
4 |
Intan |
V4 |
|
5 |
Jaya |
V5 |
|
6 |
Jayashree |
V6 |
|
7 |
Mugad Dodiga |
V7 |
|
8 |
Mugad Suganda |
V8 |
|
9 |
Mugad 101 |
V9 |
|
10 |
Mugad Siri |
V10 |
|
11 |
PSB 68 |
V11 |
|
12 |
Rajkaima |
V12 |
|
13 |
Redjyothi |
V13 |
|
14 |
Thousand One |
V14 |
|
15 |
Thousand Ten |
V15 |
-
B. Image acquisition
The images of fifty randomly chosen plants from each paddy variety were captured at five different stages of crop growth period to quantify 18 agro-morphological features listed in Table 1. A total of 5400 images, considering 20 images per agro-morphological characteristic per paddy variety are considered (20 x 18 x 15 = 5400). The images are acquired under standard lighting conditions. The acquired images of size 1920 X 1080 pixels are cropped to size 400 X 400 pixels to reduce computational overhead, storage requirements and achieve easier training.
-
C. Image preprocessing
The acquired paddy plant images are subjected for image preprocessing to eliminate the influence of illumination changes and noise. The removal of shading and correction of color changes in the images is accomplished through the histogram equalization technique. A median filter is applied to suppress the noise in the images. The color based segmentation operation is performed using k-means clustering method to extract the target regions from the paddy plants (Luccheseyz and Mitray, 2001) (Ishu and Bikrampal, 2016). Target regions are those areas in the image that represent visual color-related agro-morphological characteristics of the paddy plant. The k-means clustering algorithm classifies the
objects (color areas in plants) into ‘k’ number of classes based on a set of features, where ‘k’ is the number of clusters in the segmented image. The classification is carried out by minimizing the sum of squares of distances between the data objects and the corresponding cluster. In this method, squared Euclidean distance is used for the clustering. The segmented images of some color-related agro-morphological characteristics of paddy plants are shown in Fig 3.
C b = B – Y (5)
C r = R – Y (6)
From each of the nine color channels (R, G, B, H, S, I, Y, Cb, and Cr), five statistical color features, namely mean, standard deviation, range, skewness and kurtosis are extracted using equations (7) through (11). A total of 45 color features is extracted from all the nine color channels.
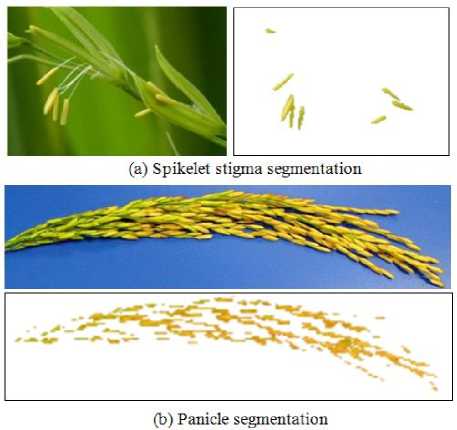
Fig.3. Color based image segmentation using k-means clustering method
M
Mean( ц ) = MN ^ N P(i,j) (7)
1MN
Standard deviation ( ст ) = S S {(P(i, j) — ц ) }
MN i=1 j=1
Range ( r ) = max { (P ( i, j ) } — min { P ( i, j ) } (9)
Skewness( в ) =
MN
SS {(P(i,j)—ц )} i=1 j=1
MN ст 3
MN 4
SS {(P(i,j) —ц )}
Kurtosis ( y ) = i 1 j 1-----------------------
MN ct 4
-
D. Color feature extraction
The color composition in the segmented agro-morphological characteristic of paddy plant images can be viewed as a color distribution which is characterized using color features. The RGB color model is adopted to quantify the color distribution in all the segmented color-related agro-morphological characteristics (C1 to C18) listed in Table 1. The feature extraction starts with color channel separation. The color channels such as Hue (H), Saturation (S), Intensity (I), Luminance (Y) and two chrominance difference channels, namely Blue Chromaticity (Cb) and Red Chromaticity (Cr) are derived from the R, G, and B color channels using equations (1) through (6).
H = cos - 1
1 [ ( R — G ) + ( R — B ) ]
[ ( R — G ) 2 + ( R — B )( G — B ) ] 2
S = 1 — (R + C+ RA [ min( R , G , B ) ] (2)
( R + G + B )
I = 1 (R + G + B) (3)
Where M, N and P(i, j) denote the dimension of the image matrix, total number of pixels in the image and the color value of ith column and jth row respectively.
-
E. Color feature reduction
The feature reduction technique using PCA has been employed to decrease the computational overhead and increase the average paddy plant variety recognition accuracy by selecting significant and non-overlapping (highly uncorrelated) color features. The PCA is a powerful tool for analyzing patterns in high dimensional data, which can be compressed by reducing the number of dimensions without losing abundant information. The Algorithm 1 gives the steps involved in the selection of color features using PCA.
Algorithm 1: Color feature reduction using PCA
Input: Paddy plant images in 24-bit RGB.
Output: Reduced feature set (principal components)
Start
Step 1: Apply K-means clustering method to obtain segmented color images
Step 2: Extract color features from the segmented images
Step 3: Compute the d-dimensional mean vectors for the different paddy plant varieties from the dataset.
Y = 0.299 ∗ R + 0.587 ∗ G + 0.114 ∗ B (4)
Step 4: Compute the scatter or co-variance matrices (among-varieties and within-variety scatter matrix).
Step 5: Compute the eigenvectors (e1, e2,..., en) and corresponding eigenvalues (λ1, λ2, ..., λn) for the scatter matrices.
Step 6: Sort the eigenvectors by decreasing eigenvalues and choose k eigenvectors with the largest eigenvalues to form a n × k-dimensional matrix W (where every column represents an eigenvector).
Step 7: Derive the new color feature set. Use n × k eigenvector matrix to transform the samples onto the new subspace. y = WT × x
Where ‘x’ is a d × 1-dimensional vector representing one sample and ‘y’ is the transformed k × 1dimensional sample in the new subspace.
Stop.
-
F. Details of Classifiers
BPNN Classifier
Multilayer back propagation neural network (BPNN) has been used as a classifier in the present work because of its ease and strength in execution for large training data set. Levenberg-Marquardt (LM) back-propagation algorithm is used for the training. The termination error (TE) is set to 0.01, the learning rate (η) is set to 0.05 and the momentum coefficient (µ) is set to 0.6. The sigmoid activation functions are used in the hidden layers. The color features are used to train and test the neural network model. The number of neurons in the input layer is set to the number of chosen color features. The number of output neurons is set to 15. The network is trained and tested for 1000 epochs.
SVM Classifier
Multi-class Support Vector Machine (SVM) is a potential linear classifier based on the concept of decision planes that define decision boundaries. A decision plane is one that separates between a set of objects having different class memberships. It builds a hyperplane from the training data which separates pixels with different class memberships. In the proposed methodology, the preprocessed images are classified using SVM with Gaussian Radial Basis Function (RBF) kernel function. The optimal sigma parameter value of RBF is sampled over the range 1.0 to 2.0. In this work, there are 15 classes of paddy varieties, therefore 15 SVMs are considered.
-
III. Experiment Simulation and Result Analysis
A total of 5400 sample images are divided into two halves, one half is used for training and other is used for testing. The percentage accuracy of adulteration level
classification is defined as the ratio of correctly classified sample images to the total number of sample images considered. The color features from all the 18 agro-morphological characteristics of paddy plants are extracted for recognizing 15 paddy plant varieties using the BPNN and SVM classifiers. A total of 270 color feature vectors, considering 18 color feature vectors per paddy variety is constructed. Each feature vector consists of 45 color features. The PCA based feature reduction technique has been employed to optimize the plant variety recognition results.
-
A. Paddy plant variety recognition based on individual agro-morphological characteristics
The color feature vectors constructed from each of the 18 agro-morphological characteristics considered for recognizing paddy plant varieties. A total of 675 color features per agro-morphological character is extracted from 15 paddy plant varieties and the extracted features are used for training and testing the BPNN and SVM separately. The results of the experiment are given in Tables 3 and 4. From Table 3, it is observed that among 18 agro-morphological characteristics, the leaf senescence character has given the highest average paddy plant variety recognition accuracy of 61.73% and the lowest average recognition accuracy of 34.13% is obtained for the character coloration of area below apex. From Table 4, the leaf senescence character has given the highest average paddy plant variety recognition accuracy of 48.20% and the lowest average recognition accuracy of 34.67% is obtained for the character stem color. The comparison of BPNN and SVM based paddy plant variety recognition performances of using individual color-related agro-morphological characteristic is graphically shown in Fig 4.
-
B. Paddy plant variety recognition based on combined agro-morphological characters from all the plant growth stages
All the eighteen color-related agro-morphological characteristics recorded from booting growth stage thru maturity growth stage are considered for the paddy plant variety recognition. In this experiment the color features extracted from all the eighteen color-related agro-morphological characteristics are used to train and test the BPNN and SVM classifiers separately. The results of the experiment are given in Tables 5 and 6. From the Tables 5 and 6, the maximum average plant recognition accuracies of 67.27% and 65.47% are obtained using BPNN and SVM classifiers respectively. The feature reduction technique PCA is employed to achieve better recognition results and the improved results are given in Tables 7 and 8. From Tables 7 and 8, the maximum average plant recognition accuracies of 71.40% and 70.13% are obtained using the BPNN and SVM classifiers respectively.
-
C. Paddy plant variety recognition based on combined agro-morphological characteristics from respective plant growth stages
A methodology for recognizing paddy plant varieties by combining agro-morphological characteristics from the respective plant growth stages has been implemented. Four growth stages are considered, namely, booting, anthesis half-way, milk development, and maturity. The characteristics from of each of the growth stages are combined. The color features from all the combined agro-morphological characteristics are used for training and testing the BPNN and SVM separately. The results of the experiment are given in Tables 9 and 10. From the Tables 9 and 10, the maximum average plant recognition accuracy of 70.93% is obtained by combining agro-morphological characteristics observed during maturity growth stage using BPNN classifier, whereas SVM classifier yields the maximum average plant recognition accuracy of 63.13%. In order to improve the recognition results, a feature selection technique PCA is employed. After applying PCA, the color features are significantly reduced with the improved recognition results. The recognition results using BPNN and SVM after applying PCA are given in Tables 11 and 12. From Tables 11 and 12, the maximum plant recognition accuracies of 91.20% and 86.33% have occurred using combined agro-morphological characteristics observed during maturity growth stage by the BPNN and SVM classifiers respectively. The lowest plant recognition accuracies of 56.07% and 54.07% are obtained using the BPNN and SVM classifiers respectively for the combined agro-morphological characteristics observed during the milk development growth stage. The BPNN classifier outperforms the SVM classifier in paddy plant recognition using color-related agro-morphological characteristics. Fig.5 shows the average recognition accuracy comparison between the BPNN and SVM classifiers with respect to different plant growth stages.
Table 3. BPNN based paddy plant variety recognition results using color features extracted from individual agro-morphological characteristics
|
Plant character identifier |
Paddy plant variety recognition accuracy (%) |
Average recognition accuracy (%) |
||||||||||||||
|
V1 |
V2 |
V3 |
V4 |
V5 |
V6 |
V7 |
V8 |
V9 |
V10 |
V11 |
V12 |
V13 |
V14 |
V15 |
||
|
C1 |
32 |
50 |
28 |
22 |
22 |
22 |
32 |
30 |
56 |
54 |
48 |
22 |
50 |
56 |
20 |
36.27 |
|
C2 |
54 |
48 |
60 |
34 |
52 |
38 |
44 |
48 |
44 |
54 |
60 |
48 |
42 |
46 |
46 |
47.87 |
|
C3 |
60 |
54 |
54 |
56 |
56 |
52 |
56 |
52 |
64 |
48 |
48 |
58 |
66 |
60 |
52 |
55.73 |
|
C4 |
50 |
42 |
30 |
30 |
40 |
44 |
34 |
32 |
40 |
40 |
50 |
56 |
52 |
42 |
28 |
40.67 |
|
C5 |
32 |
38 |
44 |
54 |
50 |
38 |
54 |
40 |
48 |
36 |
36 |
48 |
56 |
48 |
52 |
44.93 |
|
C6 |
44 |
52 |
48 |
60 |
52 |
66 |
50 |
44 |
44 |
50 |
44 |
56 |
56 |
52 |
48 |
51.07 |
|
C7 |
34 |
34 |
48 |
48 |
34 |
44 |
28 |
28 |
36 |
26 |
36 |
22 |
32 |
30 |
32 |
34.13 |
|
C8 |
56 |
58 |
46 |
26 |
36 |
24 |
34 |
50 |
36 |
24 |
32 |
24 |
26 |
52 |
46 |
38.00 |
|
C9 |
32 |
60 |
42 |
26 |
20 |
38 |
34 |
54 |
46 |
58 |
30 |
32 |
36 |
38 |
30 |
38.40 |
|
C10 |
60 |
40 |
40 |
40 |
56 |
42 |
54 |
44 |
32 |
50 |
60 |
60 |
56 |
44 |
42 |
48.00 |
|
C11 |
48 |
44 |
48 |
24 |
50 |
44 |
34 |
52 |
34 |
42 |
58 |
26 |
42 |
50 |
46 |
42.80 |
|
C12 |
58 |
50 |
44 |
42 |
42 |
48 |
48 |
34 |
44 |
38 |
44 |
44 |
46 |
26 |
24 |
42.13 |
|
C13 |
56 |
60 |
54 |
56 |
60 |
62 |
54 |
58 |
60 |
54 |
44 |
52 |
54 |
60 |
50 |
55.60 |
|
C14 |
58 |
56 |
44 |
48 |
28 |
32 |
56 |
24 |
24 |
24 |
48 |
32 |
42 |
48 |
22 |
39.07 |
|
C15 |
30 |
32 |
28 |
44 |
58 |
56 |
38 |
20 |
56 |
28 |
42 |
58 |
26 |
50 |
56 |
41.47 |
|
C16 |
58 |
20 |
32 |
36 |
48 |
28 |
54 |
54 |
50 |
28 |
60 |
44 |
28 |
34 |
42 |
41.07 |
|
C17 |
38 |
46 |
42 |
52 |
50 |
56 |
44 |
52 |
28 |
44 |
36 |
50 |
22 |
20 |
54 |
42.27 |
|
C18 |
60 |
56 |
68 |
72 |
66 |
58 |
64 |
72 |
64 |
68 |
60 |
56 |
50 |
58 |
54 |
61.73 |
Table 4. SVM based paddy plant variety recognition results using color features extracted from individual agro-morphological characteristics
|
Plant character identifier |
Paddy plant variety recognition accuracy (%) |
Average recognition accuracy (%) |
||||||||||||||
|
V1 |
V2 |
V3 |
V4 |
V5 |
V6 |
V7 |
V8 |
V9 |
V10 |
V11 |
V12 |
V13 |
V14 |
V15 |
||
|
C1 |
37 |
47 |
38 |
42 |
35 |
47 |
47 |
51 |
34 |
43 |
34 |
51 |
34 |
42 |
50 |
42.13 |
|
C2 |
44 |
54 |
43 |
55 |
36 |
27 |
39 |
35 |
45 |
32 |
39 |
33 |
30 |
53 |
25 |
39.33 |
|
C3 |
43 |
51 |
43 |
47 |
42 |
43 |
42 |
40 |
39 |
41 |
51 |
43 |
46 |
46 |
45 |
44.13 |
|
C4 |
51 |
40 |
48 |
52 |
53 |
40 |
39 |
39 |
53 |
28 |
46 |
48 |
30 |
31 |
36 |
42.27 |
|
C5 |
30 |
44 |
32 |
30 |
29 |
48 |
54 |
53 |
40 |
55 |
41 |
26 |
41 |
53 |
30 |
40.40 |
|
C6 |
51 |
31 |
40 |
41 |
45 |
32 |
32 |
49 |
43 |
41 |
53 |
44 |
45 |
42 |
49 |
42.53 |
|
C7 |
39 |
28 |
43 |
34 |
37 |
46 |
47 |
47 |
38 |
36 |
38 |
48 |
55 |
28 |
53 |
41.13 |
|
C8 |
30 |
39 |
35 |
35 |
26 |
43 |
51 |
26 |
46 |
39 |
54 |
37 |
47 |
39 |
38 |
39.00 |
|
C9 |
43 |
47 |
51 |
54 |
54 |
28 |
42 |
52 |
34 |
25 |
39 |
35 |
28 |
27 |
51 |
40.67 |
|
C10 |
49 |
26 |
25 |
54 |
30 |
39 |
28 |
40 |
31 |
40 |
26 |
30 |
28 |
34 |
40 |
34.67 |
|
C11 |
34 |
38 |
31 |
52 |
53 |
50 |
42 |
43 |
34 |
45 |
49 |
27 |
27 |
49 |
43 |
41.13 |
|
C12 |
51 |
43 |
37 |
30 |
46 |
43 |
30 |
53 |
43 |
35 |
42 |
44 |
41 |
38 |
28 |
40.27 |
|
C13 |
40 |
44 |
50 |
40 |
49 |
30 |
46 |
45 |
45 |
53 |
30 |
38 |
55 |
35 |
42 |
42.80 |
|
C14 |
40 |
42 |
35 |
54 |
29 |
48 |
54 |
44 |
45 |
31 |
46 |
48 |
43 |
32 |
30 |
41.40 |
|
C15 |
29 |
32 |
55 |
47 |
48 |
42 |
27 |
32 |
27 |
50 |
48 |
30 |
39 |
29 |
27 |
37.47 |
|
C16 |
50 |
31 |
29 |
31 |
51 |
30 |
46 |
27 |
50 |
34 |
50 |
29 |
31 |
27 |
33 |
36.60 |
|
C17 |
46 |
30 |
26 |
31 |
34 |
44 |
50 |
30 |
31 |
47 |
29 |
40 |
38 |
52 |
35 |
37.53 |
|
C18 |
47 |
52 |
52 |
45 |
54 |
49 |
50 |
54 |
45 |
45 |
49 |
44 |
44 |
42 |
51 |
48.20 |
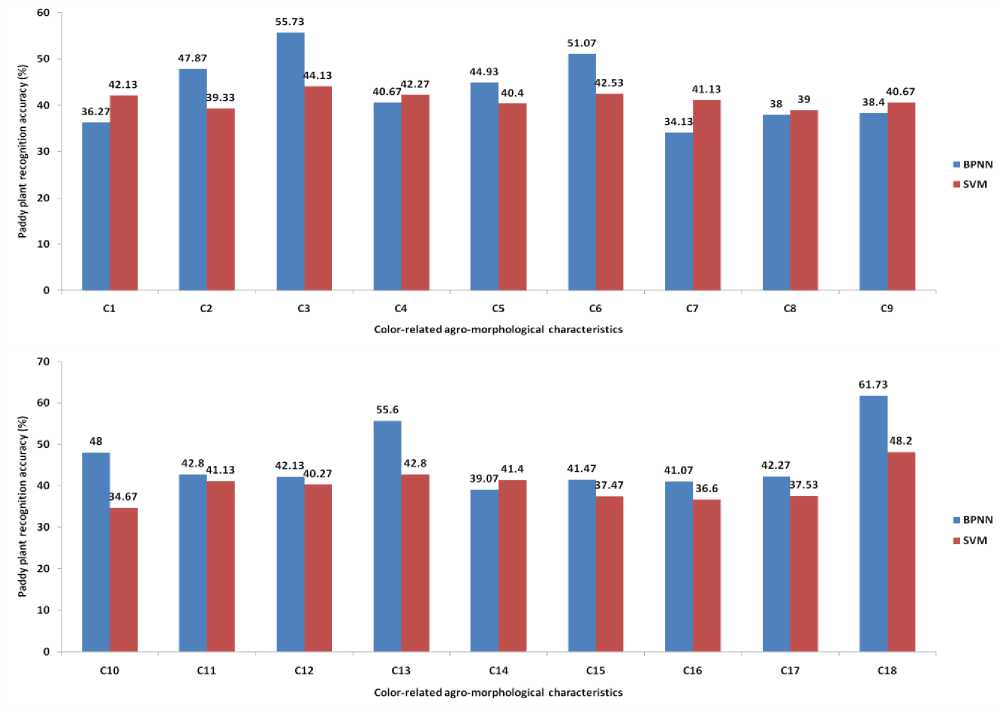
Fig.4. Recognition efficiency comparision between the BPNN and SVM classifiers using individual color-related agro-morphological characteristics
Table 5. BPNN based recognition results using combined agro-morphological characteristics from all the plant growth stages
|
Sl. No. |
Set of combined agro-morphological characteristics |
Paddy plant variety recognition accuracy (%) |
Average recognition accuracy (%) |
||||||||||||||
|
V1 |
V2 |
V3 |
V4 |
V5 |
V6 |
V7 |
V8 |
V9 |
V10 |
V11 |
V12 |
V13 |
V14 |
V15 |
|||
|
1 |
{C1 thro C18} |
69 |
72 |
66 |
69 |
65 |
69 |
70 |
73 |
66 |
68 |
62 |
69 |
66 |
65 |
60 |
67.27 |
Table 6. SVM based recognition results using combined agro-morphological characteristics from all the plant growth stages
|
Sl. No. |
Set of combined agro-morphological characteristics |
Paddy plant variety recognition accuracy (%) |
Average recognition accuracy (%) |
||||||||||||||
|
V1 |
V2 |
V3 |
V4 |
V5 |
V6 |
V7 |
V8 |
V9 |
V10 |
V11 |
V12 |
V13 |
V14 |
V15 |
|||
|
1 |
{C1 thro C18} |
66 |
68 |
64 |
65 |
70 |
56 |
67 |
68 |
67 |
58 |
66 |
58 |
70 |
66 |
73 |
65.47 |
Table 7. BPNN based recognition results after applying PCA
|
Sl. No. |
Set of combined agro-morphological characteristics |
Paddy plant variety recognition accuracy (%) |
Average recognition accuracy (%) |
||||||||||||||
|
V1 |
V2 |
V3 |
V4 |
V5 |
V6 |
V7 |
V8 |
V9 |
V10 |
V11 |
V12 |
V13 |
V14 |
V15 |
|||
|
1 |
{C1 thro C18} |
71 |
74 |
71 |
69 |
73 |
67 |
64 |
72 |
76 |
68 |
65 |
76 |
76 |
73 |
76 |
71.40 |
Table 8. SVM based recognition results after applying PCA
|
Sl. No. |
Set of combined agro-morphological characteristics |
Paddy plant variety recognition accuracy (%) |
Average recognition accuracy (%) |
||||||||||||||
|
V1 |
V2 |
V3 |
V4 |
V5 |
V6 |
V7 |
V8 |
V9 |
V10 |
V11 |
V12 |
V13 |
V14 |
V15 |
|||
|
1 |
{C1 thro C18} |
73 |
76 |
67 |
63 |
71 |
66 |
70 |
73 |
66 |
73 |
75 |
63 |
73 |
69 |
74 |
70.13 |
Table 9. BPNN based paddy plant variety recognition results obtained by combining agro-morphological characteristics from four different plant growth stages separately
|
Sl. No. |
Growth stage |
Set of combined agro-morphological characteristics |
Paddy plant variety recognition accuracy (%) |
Average recognition accuracy (%) |
||||||||||||||
|
V1 |
V2 |
V3 |
V4 |
V5 |
V6 |
V7 |
V8 |
V9 |
V10 |
V11 |
V12 |
V13 |
V14 |
V15 |
||||
|
1 |
Booting |
{C2, C3, C4, C5} |
56 |
55 |
59 |
54 |
53 |
63 |
58 |
62 |
65 |
50 |
54 |
52 |
67 |
61 |
59 |
57.87 |
|
2 |
Anthesis half-way |
{C6, C7, C8, C9} |
63 |
60 |
59 |
64 |
61 |
54 |
57 |
63 |
55 |
68 |
65 |
54 |
55 |
59 |
58 |
59.67 |
|
3 |
Milk development |
{C10, C11, C12} |
51 |
45 |
46 |
55 |
40 |
43 |
40 |
52 |
43 |
48 |
50 |
55 |
49 |
44 |
51 |
47.47 |
|
4 |
Maturity |
{C13, C14, C15, C16, C17, C18} |
72 |
75 |
73 |
72 |
68 |
67 |
67 |
66 |
68 |
72 |
76 |
75 |
66 |
74 |
73 |
70.93 |
Table 10. SVM based paddy plant variety recognition results obtained by combining agro-morphological characteristics from four different plant growth stages separately
|
Sl. No. |
Growth stage |
Set of combined agro-morphological characteristics |
Paddy plant variety recognition accuracy (%) |
Average recognition accuracy (%) |
||||||||||||||
|
V1 |
V2 |
V3 |
V4 |
V5 |
V6 |
V7 |
V8 |
V9 |
V10 |
V11 |
V12 |
V13 |
V14 |
V15 |
||||
|
1 |
Booting |
{C2, C3, C4, C5} |
60 |
42 |
48 |
50 |
55 |
54 |
51 |
49 |
45 |
48 |
52 |
54 |
52 |
61 |
55 |
51.73 |
|
2 |
Anthesis half-way |
{C6, C7, C8, C9} |
49 |
52 |
55 |
51 |
54 |
53 |
50 |
55 |
51 |
52 |
53 |
51 |
51 |
55 |
50 |
52.13 |
|
3 |
Milk development |
{C10, C11, C12} |
35 |
40 |
38 |
37 |
40 |
46 |
44 |
44 |
42 |
47 |
40 |
40 |
49 |
42 |
42 |
41.73 |
|
4 |
Maturity |
{C13, C14, C15, C16, C17, C18} |
60 |
61 |
69 |
58 |
70 |
67 |
62 |
62 |
60 |
59 |
60 |
61 |
70 |
61 |
67 |
63.13 |
Table 11. BPNN based paddy plant variety recognition results after applying PCA
|
Sl. No. |
Growth stage |
Set of combined agro-morphological characteristics |
Paddy plant variety recognition accuracy (%) |
Average recognition accuracy (%) |
||||||||||||||
|
V1 |
V2 |
V3 |
V4 |
V5 |
V6 |
V7 |
V8 |
V9 |
V10 |
V11 |
V12 |
V13 |
V14 |
V15 |
||||
|
1 |
Booting |
{C2, C3, C4, C5} |
74 |
78 |
75 |
76 |
76 |
74 |
77 |
74 |
66 |
72 |
78 |
76 |
80 |
74 |
82 |
75.47 |
|
2 |
Anthesis half-way |
{C6, C7, C8, C9} |
80 |
72 |
84 |
86 |
74 |
81 |
74 |
76 |
72 |
82 |
88 |
78 |
83 |
76 |
79 |
79.00 |
|
3 |
Milk development |
{C10, C11, C12} |
60 |
63 |
51 |
54 |
55 |
59 |
61 |
55 |
43 |
59 |
54 |
55 |
53 |
59 |
60 |
56.07 |
|
4 |
Maturity |
{C13, C14, C15, C16, C17, C18} |
95 |
90 |
91 |
87 |
92 |
88 |
90 |
92 |
88 |
93 |
92 |
94 |
87 |
96 |
93 |
91.20 |
Table 12. SVM based paddy plant variety recognition results after applying PCA
|
Sl. No. |
Growth stage |
Set of combined agro-morphological characteristics |
Paddy plant variety recognition accuracy (%) |
Average recognition accuracy (%) |
||||||||||||||
|
V1 |
V2 |
V3 |
V4 |
V5 |
V6 |
V7 |
V8 |
V9 |
V10 |
V11 |
V12 |
V13 |
V14 |
V15 |
||||
|
1 |
Booting |
{C2, C3, C4, C5} |
75 |
90 |
65 |
80 |
85 |
82 |
72 |
69 |
69 |
78 |
67 |
72 |
75 |
74 |
69 |
74.80 |
|
2 |
Anthesis half-way |
{C6, C7, C8, C9} |
79 |
69 |
69 |
69 |
78 |
76 |
77 |
88 |
83 |
87 |
83 |
85 |
90 |
90 |
65 |
79.20 |
|
3 |
Milk development |
{C10, C11, C12} |
43 |
50 |
59 |
55 |
58 |
52 |
57 |
58 |
52 |
58 |
52 |
50 |
61 |
55 |
51 |
54.07 |
|
4 |
Maturity |
{C13, C14, C15, C16, C17, C18} |
85 |
89 |
85 |
88 |
90 |
86 |
88 |
80 |
85 |
87 |
86 |
82 |
89 |
85 |
90 |
86.33 |
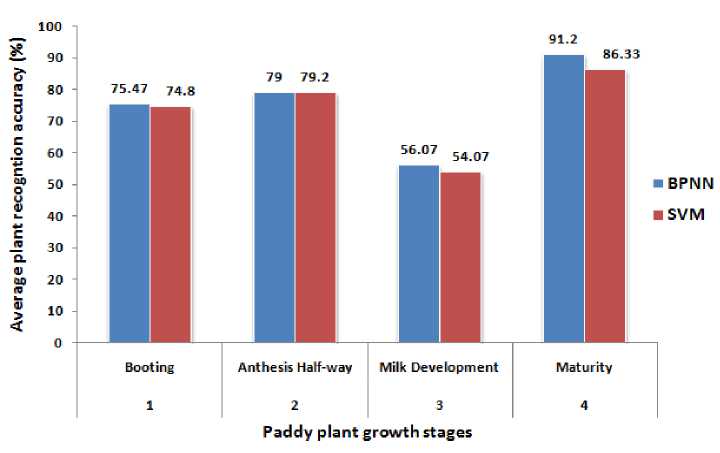
Fig.5. Paddy plant recognition efficiency comparison between BPNN and SVM classifiers using combined agro-morphological characteristics from respective plant growth stages
-
IV. Conclusion
The present work has explored the use of computer vision and image processing techniques for the recognition of 15 paddy varieties from their plant images. The color variations in 18 agro-morphological plant characteristics have been analyzed using three different color models. A set of six combined agro-morphological plant characteristics recorded during the maturity growth stage gives the highest average paddy plant recognition accuracies of 91.20% and 86.33% using the ANN and SVM classifiers respectively. The BPNN classifier performance is found to be better than the SVM classifier for the work done. The proposed work has a number of advantages when compared with the traditional DUS testing approach for paddy plant recognition, including rapidness and lower cost. The work involves both image processing and pattern recognition techniques have significance to the real world categorization of crop varieties and it can be extended to categorize wheat, barley and maize varieties from the plant images. However the morphological characteristics are not quite enough to discriminate among paddy plant varieties. Furthermore, morphological characters are often influenced by environment, thus making it difficult to assess them quickly and objectively, and requiring repeated observations. In addition, the paddy plants must be grown from seed germination to maturity stage for generation of adequate agro-morphological characters. The proposed methodology can be integrated with the molecular technology approach for unambiguous and quick recognition of similar or closely related paddy plant varieties. Further, the development of three-dimensional modeling of plant images could be useful in improving the accuracy and precision of color related plant characteristics assessment.
References Automated paddy variety recognition from color-related plant agro-morphological characteristics
- Grillo, O., Blangiforti, S., & Venora, G., (2017). Wheat landraces identification through glumes image analysis. Computers and Electronics in Agriculture, Volume 141, pp. 223-231.
- Perez-Sanz, Fernando, Pedro J. Navarro, and Marcos Egea-Cortines, (2017). Plant phenomics : an overview of image acquisition technologies and image data analysis algorithms. GigaScience, Volume 6, pp. 1-18.
- Suchit Purohit and Savita R. Gandhi, (2017). Application of Sparse Coded SIFT Features for Classification of Plant Images. International Journal of Image, Graphics and Signal Processing 9, Volume 10, pp. 50.
- Sridhar, T. C., Dushyantha, B. M., Kumar, B. R. and Nishanth, G. K., (2016). Morphological Characterization of Traditional Rice (Oryza sativaL.) Genotypes of Southern Transitional Zone, Karnataka, According to DUS Test Guidelines. Research Journal of Agricultural Sciences, Volume 7(2), pp. 317-323.
- Joly, A., Goëau, H., Bonnet, P., Bakić, V., Barbe, J., Selmi, S., Yahiaoui, I., Carré, J., Mouysset, E., Molino, J.F. and Boujemaa, N., (2014). Interactive plant identification based on social image data. Ecological Informatics, Volume 23, pp. 22-34.
- Caglayan, A, Guclu O, Can A., (2013), A plant recognition approach using shape and color features in leaf images. In: Petrosino A. (eds) Image analysis and processing- ICIAP 2013, Lecture Notes in Computer Science, Springer, Berlin, Heidelberg Volume 8157, pp. 161–170.
- Korir, N. K., Han, J., Shangguan, L., Wang, C., Kayesh, E., Zhang, Y., & Fang, J., (2013). Plant variety and cultivar identification: advances and prospects. Critical reviews in biotechnology 33, Volume 2, pp. 111-125.
- Yang W, Duan L, Chen G, Xiong L, Liu Q. (2013). Plant phenomics and high-throughput phenotyping: accelerating rice functional genomics using multidisciplinary technologies. Current Opinion in Plant Biology, Volume 16, pp. 180–187.
- Subudhi, H. N., Samantarays, S., Swain, D. and Singh, O.N., (2012). Collection and agro-morphological characterization of aromatic short grain rice in eastern India. African Journal of Agricultural Research 7, Volume 36, pp. 5060-5068.
- Kumar, N., Belhumeur, P. N., Biswas, A., Jacobs, D. W., Kress, W. J., Lopez, I. C., & Soares, J. V., (2012). Leafsnap: A computer vision system for automatic plant species identification. In Computer vision–ECCV, Springer, Berlin, Heidelberg, pp. 502-516.
- N Shobha Rani, LV Subba Rao and B C Viraktamath, (2006). National Guidelines for the conduct of tests for Distinctness, Uniformity and Stability: Rice (Oryza sativa L) – Zero Draft, Directorate of Rice Research, Rajendranagar, Hyderabad – 500030, Andhra Pradesh, India. pp. 39.
- Luccheseyz L, Mitray S., (2001). Color image segmentation: a state-of-the-art survey. In: Proceedings of the Indian National Science Academy. Volume 67, pp. 207–221.
- Ito, Hiroshi, and Tomoya Akihama, (1962). An approach for the symbolization of colors in rice plant and its adoption for the classification of rice varieties, Japanese Journal of Breeding 12, Volume 4, pp. 221-225.
- Shearer, S.A. and R.G. Holmes. (1990). Plant identification using color co-occurrence matrices. Transactions of the ASAE 33, Volume 6, pp. 2037-2044.
- Garg, Ishu, and Bikrampal Kaur, (2016), Color based segmentation using K-mean clustering and watershed segmentation. In Computing for Sustainable Global Development (INDIACom), 3rd International Conference, IEEE, pp. 3165-3169.
