Automatic dead zone detection in 2-D leaf image using clustering and segmentation technique

Author: Rajat Kumar Sahoo, Ritu Panda, Ram Chandra Barik, Samrendra Nath Panda
Journal: International Journal of Image, Graphics and Signal Processing @ijigsp
Article in issue: 10 vol.10, 2018.
Free access
Plant is a gift of almighty to the living being in the earth. Leaf is an essential component for any types of plant including crops, fruit and vegetables. Before the scheduled decay of the leaf due to deficiency there are patches of dead zone spot or sections generally visible. This paper introduces a novel image based analysis to identify patches of dead zone spot or sections generally visible due to deficiency. Clustering, colour object based segmentation and colour transformation techniques using significant salient features identification are applied over 12 plant leaves collected naturally from gardens and crop fields. Hue, saturation and Value based and L*a*b* colour model based object analysis is being applied over diseased leaf and portion of leaf to identify the dead zone automatically. Derivative based edge analysis is being applied to identify the outline edge and dead zone segmentation in leaf image. K-means clustering has played an important role to cluster dead zone using colour based object area segmentation.
Hue Saturation Value (HSV), k-means, Saliency feature, Red Green Blue (RGB), Segmentation, L*a*b* color model, Grey threshold
Short address: https://sciup.org/15016000
IDR: 15016000 | DOI: 10.5815/ijigsp.2018.10.02
Text of the scientific article Automatic dead zone detection in 2-D leaf image using clustering and segmentation technique
Published Online October 2018 in MECS
India is a country with a population of nearly 846 billion. It acquires 2nd position after China among world’s most populous country. Here, about 70% of the population is dependent on agriculture which is a source is earning for them. The agriculture is the most important aspect which adds to Indian economy. But due to this climatic changes, issues like global warming are giving rise to the new born (pests, insects) which are giving rise various kinds of diseases. The plant parts like stem, roots, fruits and mostly the leaves are infected a lot which results in low yield. The most common diseases are blights, rusts, rot, mildew etc. The identification and detection of these diseases are simply done through naked eyes and thus the redundant use of chemicals becomes a curse to the farmers.
The invention of computer is a great gift of science to the mankind. With the advancement of technology the computers have a great impact in all spheres. Now-a-days, it is used in agricultural and horticulture sectors even. The various disease affected area, the parts of the plants eaten by the insects are not yet precisely studied due to complexity of visual pattern. Hence, there has been increasing demand for more specific study or to detect the affected area of the plant. The management of this diseases from pests, insects and to study the affected area more precisely this image processing technique can be used. This image processing technique can be used to detect the infected area of diseased leaf, stem or fruit. This can help to find the shape of the affected area and to study the affected area i.e. the diseased area caused by fungal, bacterial or any pathogen.
-
II. Related Work
Peifeng Xu, Gangshan Wu, Yijia Guo, Xiaoyin chen, Hetong Yang, Rangbiao Zhang in the paper “Automatic Wheat Leaf
Rust Detection and Grading Diagnosis via Embedded Image Processing System” [1] proposed the image recognition and rust detection technology for wheat leaf disease. The captured image of wheat leaf rust was converted to G single channel grey image of RGB model. Then using Sobel operator method, the vertical edges were detected on the grey image and the background of the image was eliminated. Then the noisy points found on the point set were filtered out through flood filling algorithm. Finally, the disease affected area ratio was calculated to get the disease level diagnosed. Manisha Bhange and H.A.Hingoliwala in the paper “Smart Farming: Pomegranate Disease Detection Using Image
Processing” [2] proposed the method of detection of disease in pomegranate fruit using the already loaded dataset of images in the system. At first the input image provided by the user was resized and then its parameters like colour, morphology, CCV and clustering were obtained using kmeans algorithm and then through SVM the provided image whether infected or not was detected.
A diagnostic model was approached for the management of the cucumber crop by CLASE (Central Laboratory of Agricultural Expert System) using conventional expert system. [3] The image processing phases i.e. enhancement, segmentation, feature extraction and classification were used in order to diagnose the disease affected in the provided leaf. The leaves affected by Leaf miner, Powdery and Downey were tested. This approach of integrating image analysis technique into diagnostic expert system has reduced the emerging errors between system and the user.
The wavelet based image processing technique for the detection of the damage in pip fruit was proposed by Brendon J. Woodford, Nikola K. Kasabov and C. Howard Wearing in paper “Fruit Image Analysis using Wavelets” [4, 16]. The pests i.e. the leaf-roller, codling moth, and apple leaf curling midge found in the orchard was used studying this technique. A set of Doubenchies wavelet were used for the extraction of the important features. The comparing the standard deviations for the three color components was done to find out the matches in the image. The Euclidean distance between the feature coefficients of the image and that of the querying image was calculated and was sorted out that the image matching to the query was one with the smallest distance.
Prof. Sanjay B. Dhaygude and Mr. Nitin P. Kumbhar in the paper “Agricultural Plant Leaf Detection Using Image Processing” [5] explains the four processing schemes for the detection of disease caused by viruses, bacteria, fungi using the processing scheme i.e. for the taken RGB image a colour transformation complex was designed as the converted image, HSI was used as a colour descriptor. Next, the threshold value and green pixels were covert and removed. After that the removal of green pixels and the useful segments masking were extracted using the computed threshold level and the segmentation was done. Finally, using SGDM matrix the texture statistic is computed.
The various infected rice plant’s images for the disease detection involved a software prototype system in the paper [7]. The image segmentation techniques as well as the soft computing techniques were used for the detection of the infected plant. The images of diseased rice plant’s leaf suffering from leaf blast and having brown spots were taken and the infected parts were detected using image processing and image growing techniques. The features of the images were also extracted using zooming algorithms and the classification of the diseased images were done through Self Organize Map (SOM) neural network.
Vijai Singh and A. K Misra in the paper “detection of plant leaf Disease using image segmentation and soft computing technique” [8] proposed the method of automatic detection and classification of plant leaf disease using various algorithms for image segmentation technique. The genetic algorithms are used for the detection of symptoms at very early stages which proved useful for monitoring in big farms automatically.
In paper [9] the grape leaf disease was detected using hybrid intelligent system. The self-organizing maps and Back propagation neural networks techniques were used for the recognition of colours of the grape leaf. The grape leaf pixels in the image were segmented and then modified self-organizing feature maps with genetic algorithms for segmentation and support vector machines for classification are used. Gabor wavelet was used for the filtration of segmented image that allows the system to analyse leaf disease color features.For classification of grape leaf disease Support vector machines were the availed.
The appearance of pathogens in the crop is a severe threat leading to a great loss in crop yield. In paper [10] the classification of cotton disease automatically based on feature extraction foliar system was done from the image. The energy of wavelet transform and SVM techniques were used for classification. The healthy plant, the other infected from Ramularia disease or infected with Bacterial blight or infected with Ascochyta Blight or infected with some other unknown disease were the five possible diagnose made.
An approach has been made to detect the disease caused by spores in paper [11].The colour images was transformed to grey and some sort of correction was done like image sharpening, grey level correction etc. The Median filter and canny edge algorithm techniques were used to process the edges of the grey image.The image was processed by using morphological features like dilation, erosion, opening etc. after the threshold binary image was obtained.
Qing Yao, Zexin Guan, Yingfeng Zhou, Jian Tang, Yang Hu, Baojun Yang proposed Image processing techniques and Support Vector Machine (SVM) techniques for the detection and classification of rice diseases early and accurately in paper[12]. The disease spots, their shape and texture were segmented and extracted. The rice bacterial leaf blight, rice sheath blight and rice blast were detected through the SVM method. An accuracy of 97.2% results was obtained for the detection of diseased spot through this SVM technique.
A method for detection of soyabean rust and exploration of its quantifying severity has been proposed in paper [13]. For detection of soyabean rust caused by Phakopsora pachyrhizi using both multispectral CCD camera and portable spectrometer the images of soyabean rust severity were collected. To detect the rust infection possibility different forms of vegetation indices were used and a difference vegetation index (DVI) gave a positive correlation with reflectant difference. The images were used to extract the ratio of infected area, lesion color index and rust severity index and the leaf disease detection and its severity was also done through it.
Chaudhary Piyush et al. in the paper titled “Color transform based approach for disease spot detection on plant leaf” [15, 16] gave a picture through the comparison of effect of HIS, CIELAB, YCbCr color space. The median filter was used for mollifying the image and finally, the Ostu method was applied and the threshold value was calculated to find the diseased spot. CIELAB colour model was used to remove the noise shown by camera flash, vein etc.
Many dimension of scientific research is solely depends the dataset. In this paper the real life data set samples are collected from gardens, crop fields etc. mentioned in table 1. Table 1 diseased leaf sample collection and description
Table 1. Diseased leaf sample collection and description
|
Plant Specimen and Botanical Name |
Description |
Diseases |
|
Codiaeum variegatum Euphorbiaceae |
It is an evergreen shrub. The leaf colour generally appears to be a combination of green, pink, orange, yellow etc. The leaf is 10-15 cm in length and is linear to lance shaped to oval |
The rust disease in croton leaf is a type of fungal origin. The raised pustules caused by the fungus belonging to order pucciniales appears to be yellow to brown in colour |
|
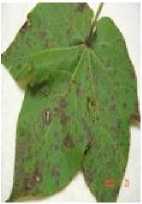
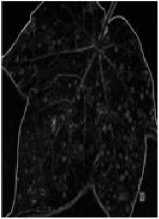
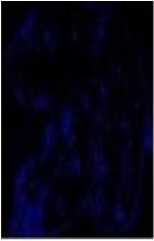
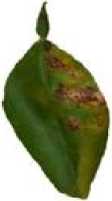
Butea monosperma Fabaceae |
It is a tall plant with long, bright, orange red flower and is called the flame of the forest. The leaves are pinnately compound. The fruit produced is a pod. |
The plant affected by angular leaf spot has brown irregular spots which are angular in shape which are generally dried ones. |
|
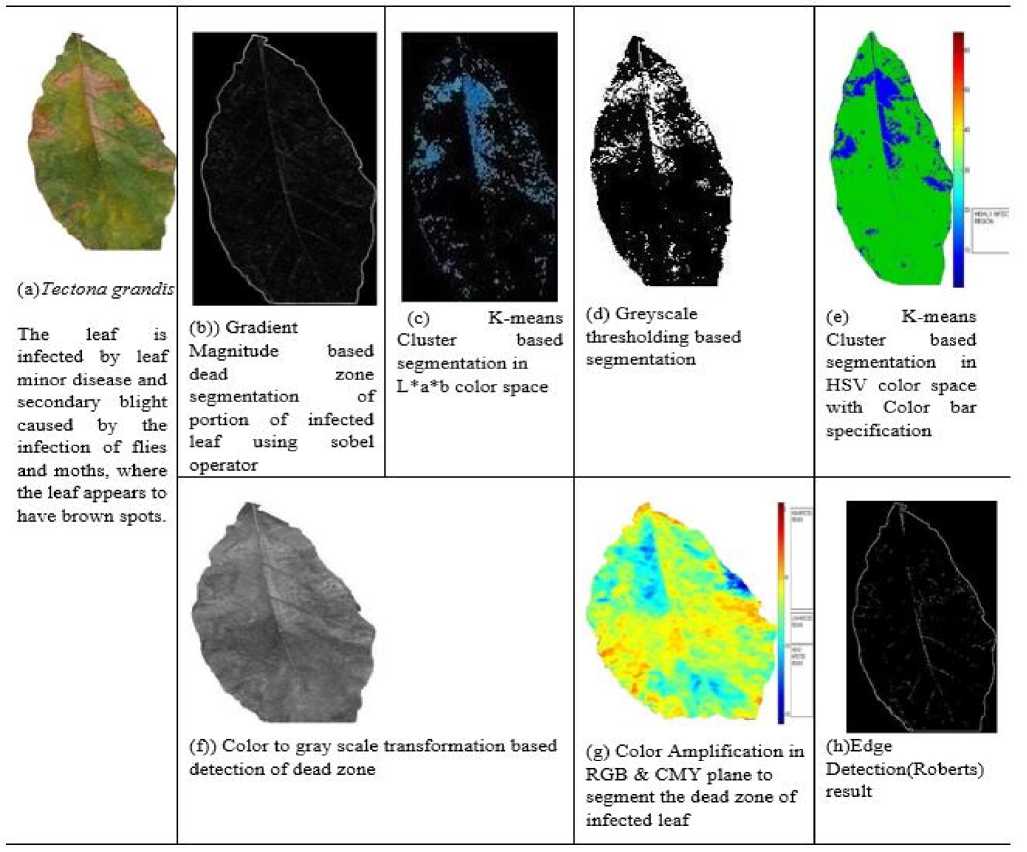
Tectona grandis Lamiaceae |
It is a tall tree with grey to brown branches. The leaves are ovate to elliptical in shape. The flowers born are white in colour. The timber obtained from it is economically beneficial |
The leaves are infected by leaf miner disease and by pest causing secondary blight. Here the larvae of flies or moths or pests generally feeds on the tissues with low amount of tannins and the leaves appears having white or brown or black or yellow spots. |
|
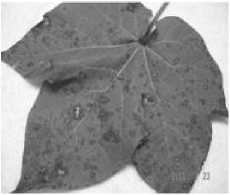
Gossypium spp. Malvaceae |
It is a tall tree with grey to brown branches. The leaves are ovate to elliptical in shape. The flowers born are white in colour. |
Foliar leaf spot disease occur due to potassium deficiency in the plant, where the plant leaf get a number of spots which clearly denotes more potassium deficiency in the plant. |
|
Tabernasemontana divaricata Apocynaceae |
The plant is an evergreen shrub. The leaves are large, green glossy. The flowers appear to be white in colour and the plant is a shrub. |
The leaf blight disease is a fungal disease caused due to phytopthora sp. The lesions appear to be brown in colour having net like appearance covered by yellow colour area. |
|
Citrullus lanatus Cucurbitales |
It is an annual plant having usually 3 lobes which are themselves lobed. The leaves are generally large, hairy, alternate, and coarse and get rough when old. |
It is caused by Oomycete Pseudoperonospora cubensis which generally infect the leaves causing small green or yellow spots on the underside of the leaves. The foliage turns eventually brown and curls upward. Necrotic spot with hyaline margin |
|
Solanum melongena Solanaceae |
It is a perennial plant generally grown in temperate climate having a white to purple colour flower with 5 lobed corolla and yellow stamen. |
Phomosis blight disease is fungal disease caused by phomopsis vexans causing smaller circular spots in the leaves which become grey to brown with irregular margins and dried up region. |
|
Aegle marmelos Rutaceae |
The leaf of this plant generally appears to be tripiniate. The leaf here appears to be oblong pyriform in nature. |
The appearance of the leaf in brown dead zone texture is due to the deficiency of micronutrients like Boron, Copper, and Sulfur and so on. The affected seems to be brown and corky in appearance. |
|
Citrus limon Rutaceae |
It is a perennial plant, generally grown in gardens of medettaranian places. The leaves are elliptical or lanceolate and pointed. The fruits seems dark green colour when raw and dark yellow colour after ripening. It is a rich source of flavonoids, vitamin C and certain essential oils. |
This citrus canker in lemon is caused by a bacteria Xanthomonas axonopodis . The lesions appears to be brown and corky in appearance on leaves and also in stem and fruits. |
|
♦ Mangifera indica Anacardiaceae |
The leaves of the plant are evergreen, alternate, broad and long. The flowers produced in the terminal panicles are white |
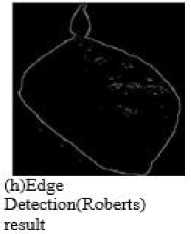
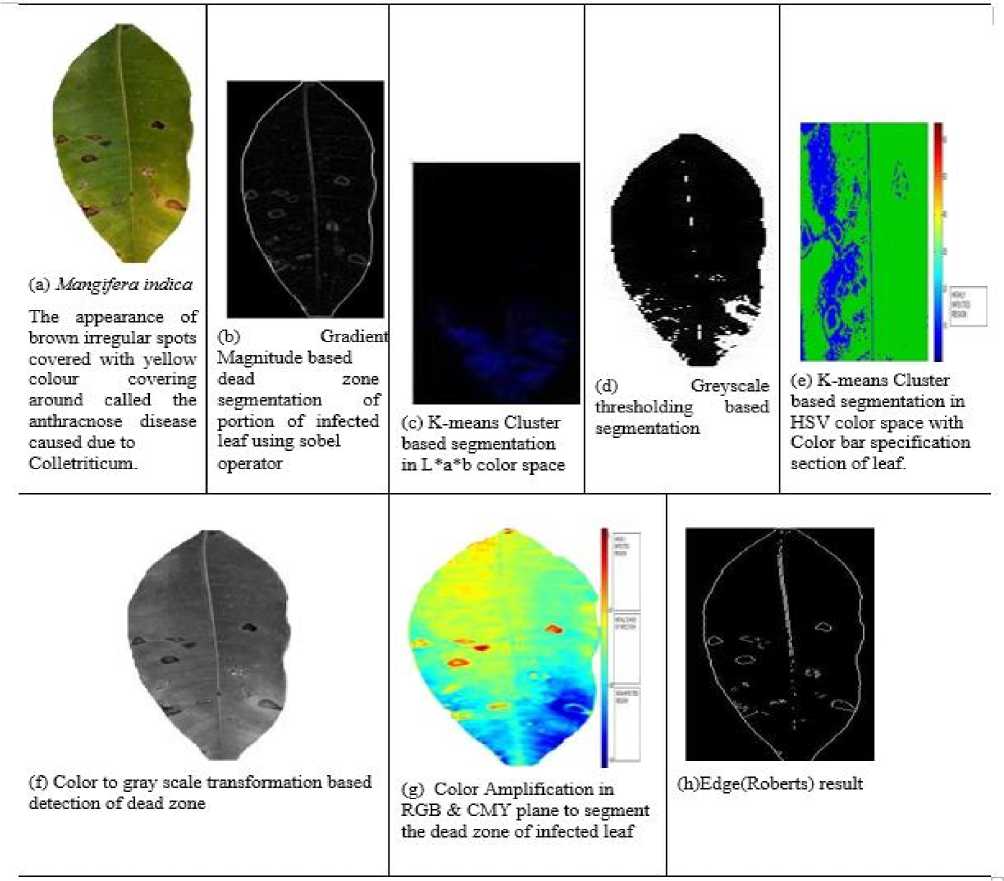
Anthracnose leaf spots in mango, this is a type of fungal disease caused due to Glomeralla cingulate or Colletriticum gloeosporoides. The spots caused due to this appears black or brown present on the leaf margins which are irregular in shape. |
|
Cucumis sativus Cucurbitaceae |
The plant is a creeping vine that roots in ground and grows up by other supporting frames. It has large leaves that form a canopy over the fruits. |
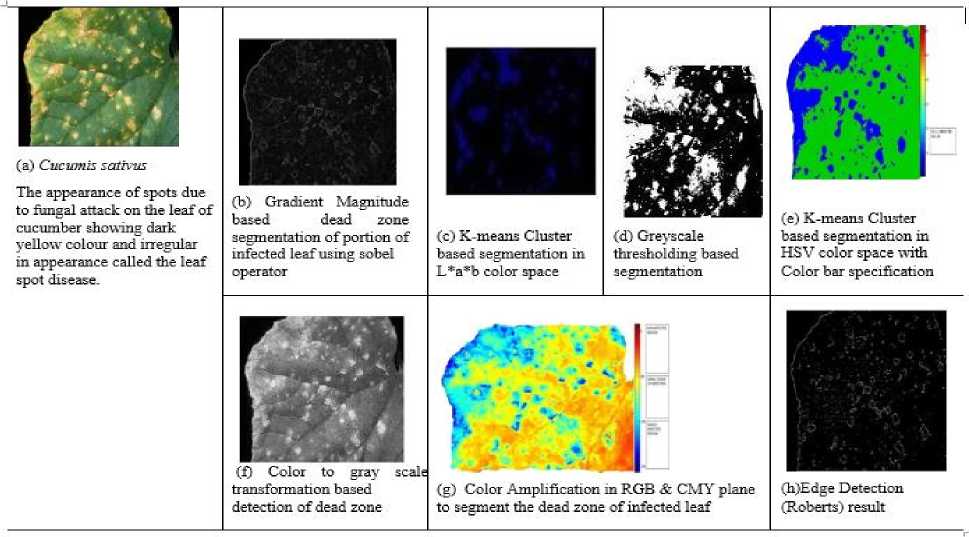
Leaf spot disease in the cucumber is generally a fungal disease that cause spots to appear on the leaves of this plant leading to stunted growth and lower-quality fruit |
|
Solanum lycopersicum Solanaceae |
The plant is dicot, vine and grow as a series of branching stems, with terminal bud at tip. The leaves are mostly the compound type with densely glandular hairy. |
Early blight is a type of fungal disease caused by Alternaria sp. The leaf get irregular dark brown .spots which enlarge in to a series of concentric ring surrounded by yellow area. |
Any scientific research arena is influenced by emerging ideas and method proposed by scientific community. This paper depicts a novel empirical analysis of dead zone as non alive portion detection in a leaf dataset which is collected from natural sources. Then the leaf dataset is passed in a normalization process using popular and common image processing methodology as Contrast Stretching, Denoising and Resizing. Different texture identification method is applied such as Edge detection (Sobel, Roberts), Grey scale Thresholding, Color to grey transformation, Saliency based detection, K-means clustering based detection using L*a*b and HSV color model. The architectural flow of this paper is being mentioned in fig. 1. The dataset is being collected naturally from garden plants and fields.
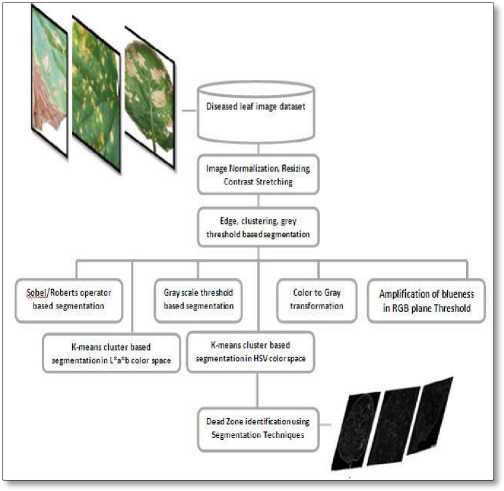
Fig.1. Overall flow of the proposed work
-
A. Distance Metric over K-means Clustering
Clustering is an unsupervised learning approach which is applied to find solution in many dimensions of science and Engineering problems in last two decade. Among many clustering algorithm k-means algorithm has played a significant role by categorizing the data based on the distance such as Euclidean and Manhattan etc. Represented in equation 1 and 2
If x(x 1 ,x2 ..xn) and y(y 1 ,y2 ..yn) are two points in image space then the Euclidean distance in n-space can be mathematically represented as
D(x,y) = D(y,x) = T^M - xt)2 (1)
V^ i T^x j -iq)2 (2)
The points are clustered around cluster center or centroid ц; V i = 1,2,.....k , which is achieved by minimixing objective or distance
Where there are k clusters s , , i = 1,2 ... к and g , is the centroid or mean point of all the points x j £ S j [17].
-
B. Saliency Calculation
Radhakrishna Achanta et al. proposed a saliency based feature calculation where saliency is determined as the local contrast of an image region with respect to its neighborhood at various scales which is evaluated as the distance between the average feature vectors of the pixels of an image sub region with the average feature vector of the pixels of its neighborhood [18]. This allows obtaining a combined feature map at a given scale by using feature vectors for each pixel, instead of combining separate saliency maps for scalar values of each feature. At a given scale, the contrast based saliency value for a pixel at position (i; j) in the image is determined as the distance D between the average vectors of pixel features of the inner region R1 and that of the outer region R2 (Figure 2) as:
:-У( ''';. . ; :/. 1 \' . /:| (3)
Where N1 and N2 are the number of pixels in R1 and R2 respectively, and v is the vector of feature elements corresponding to a pixel. The distance D is a Euclidean distance if v is a vector of uncorrelated feature elements, and it is a Mahalanobis distance (or any other suitable distance measure) if the elements of the vector are correlated which is mentioned in equation 1 and 2.
-
C. Edge Detection
First order derivative in image processing are implemented using magnitude of gradient [19]. For a function f(x, y) the gradient off at coordinates (x, y) is defined as 2-D column vectors in equation 4 as
Д/ = grad ( f) = [^] =
£T dx 9f . ay.
The rate of change off at location (x, y) is given by Equation 5.
Mag(Vf) = Tax2 + Tay2 (5)
Convolution of filter or Mask with spatial co-ordinate based entire image is done to obtain the edge detected or segmented image shown below the filter mask of and weighted matrix.
|
2i |
2'. |
2з |
2i |
Z: |
|
2. |
2^ |
z6 |
23 |
2. |
|
2- |
2b |
25 |
Roberts Method:
Robert mask having matrix convolve with the entire image using horizontally and vertically in both x and y spatial coordinate respectively. Roberts mask is represented as below
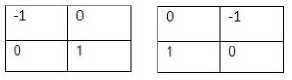
Horizontal derivative approximate as Equation 6 and vertical derivative approximate as Equation 7.
gx = (Z 4 - Z 1 ) (6)
gy = (Z 3 - ^ 2 ) (7)
Sobel Method:
Sobel mask having 3 matrix convolve with the entire image to increase edge intensity below
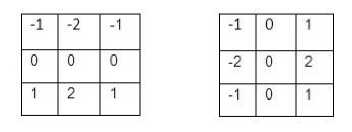
Horizontal derivative approximate as Equation 8 and vertical derivative approximate as Equation 9.
gx = ( Z 3 + 2Z 6 + Z9) - ( Z 1 + 2Z 4 + Z 7 ) (8)
gy = (z 7 + 2z 8 +z9) - (Z 1 + 2Z 2 +Z 3 ) (9)
-
D. Color Model
Chromaticity present in color model plays an important player to segment background object from foreground object. Most of the image processing techniques process the problem image based on a color specification and color model. In this paper the diseased leaf image has being processed over HSV and Y*a*b based color model specification.
HSV Color Model : Whenever humans view a color objects it is expressed in terms of Hue, Saturation and Value as brightness. Hue represents the pure color prominence among other colors it is represented in terms of angle ranging from 0 to 360 degree where Red(0-60),Yellow(60-120),Green(120180),Cyan(180-240),Blue(240-300),Magenta(300-360). Saturation stands for amount of gray or white light diluted with pure color to fade it. Value is an added component for saturation describes the brightness or intensity property of the color which ranging from 0 to 100% where 0 is black and 100 stands for brightest color. HSV color component can be drawn from primary color model (RGB) which can be mathematically expressed in equation 10 and 11 as
The value or Brightness component is mathematically represented in equation 13 as
V= max (r,g,b) (13)
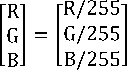
For making the computational efficiency the RGB component is normalized from the range 0-255 as, 0-1 by the equation 14 as
L*a*b* Model: L*a*b* represents a 3D color model. L* represents the lightness of the color L*=0 signifies black and
L*=100 signifies diffuse white. The range of a*, b* is independent of the color space. Based on CIELAB
Mathematically L*a*b* is being represented in equation 15 as
L*= 116у© — 16
a* = 500 ( f ( X; ) - f(9)
b* = 2 оо(г ( 7П )-г(^ ))
ы \
9
if B
H { 360-9 ifB>G
Xw Yn, Zn are CIE tristimulus values of white.
Where
9 =
cos
I
1 [(R-G)+(R-B)]
[(R-G) 2 + (R-B)(G-B)] 2
I
The Saturation can be mathematically represented in equation 12 as
S = 1" (R+G+B5 [min|R,G,B)] (12)
V. Result & Analysis
Empirical Analysis has been done using MATLAB over I3 Processor. The dataset samples are collected from gardens, crop fields and few from online sources then all are passed to a common normalized process. After that all infected images passed to various stages of image processing filters by which the dead zone are being segmented automatically. Due to variation of texture and color in leaf image dataset many segmentation technique is applied to segment and visualize the dead zone.
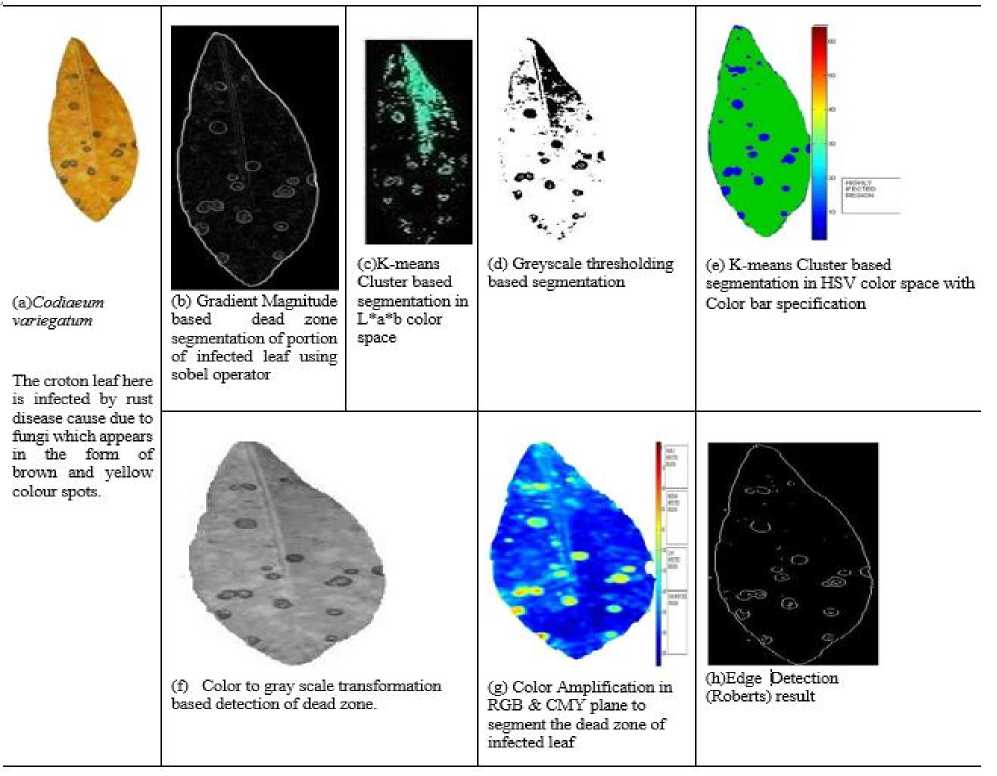
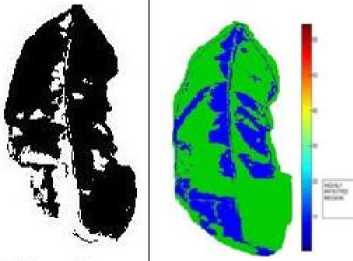
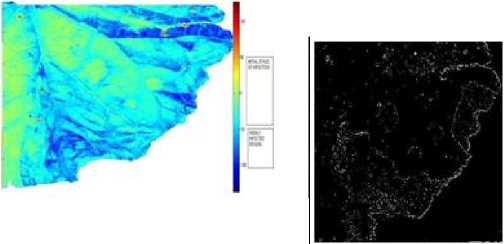
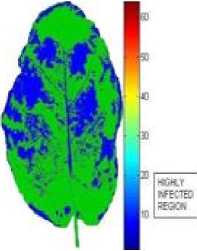
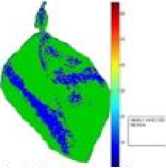
In fig. 2.1 (e) through the k-mean clustering method the infected region is indicated by the blue colour appearance ranging from the ranges of 10-20 pixel intensities.
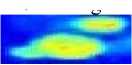
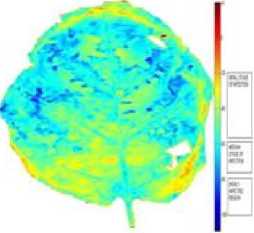
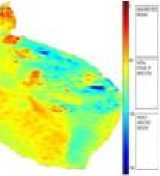
Fig. 2. 1(g) the area of colour (within the range of 200 -180) exhibits that those area of leaf are the non-infected portions where the uredial spores have not developed i.e. those area are not yet infected by the pathogen (pucciniales).
The area of colour (range within 140-100) are the low infected region having very few or trace amount of uredial and the development of the rust is generally poor.
The region of the leaf exhibiting the colour

(of both the ranges i.e. within 100-140 as well as of 40-80)
are the one moderately infected where the rust is slightly developed.
The region of the leaf exhibiting the colour
(of both the ranges i.e. within 100-140 as well as of 40-80) are the one where the infection is more than normal, the uredial are more in number, well developed and scattered.
The region of the leaf exhibiting the colour
(of the ranges 100-140, 40-80 and 0-40)
are the one the uredial number is abundant, luxuriant development of rust pustules, classified to be the highly infected region.
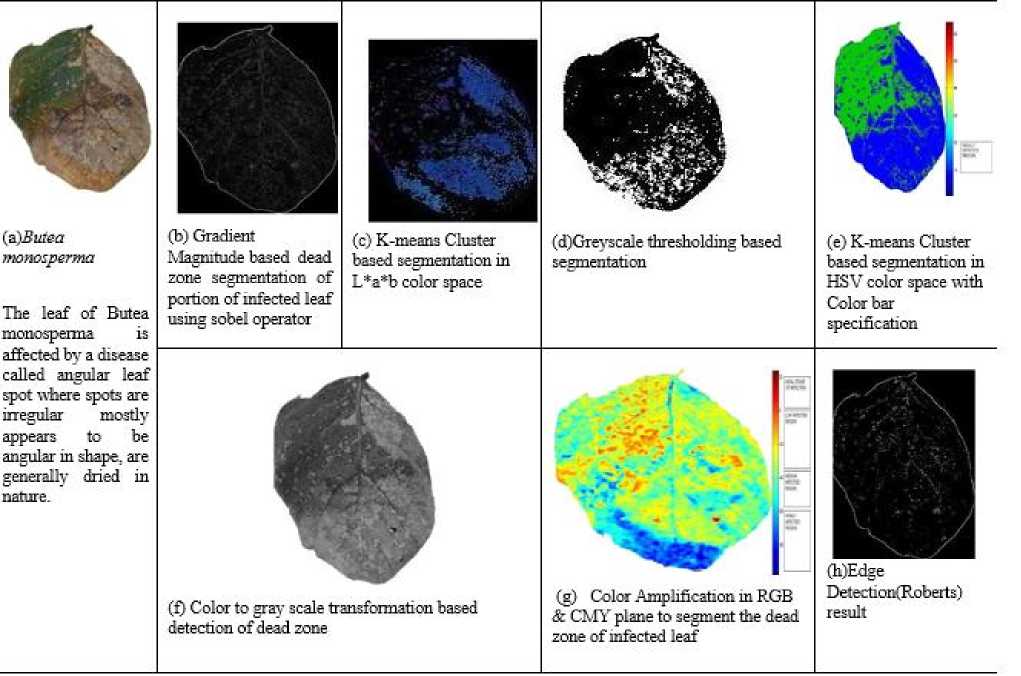
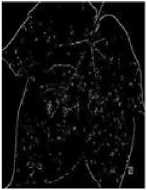
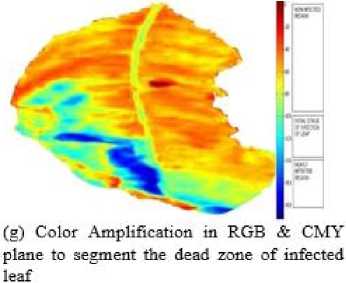
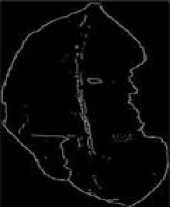
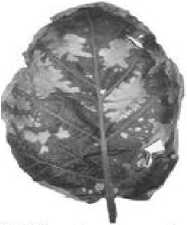
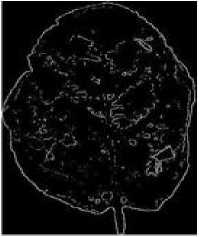
Fig. 2.2. (a) Original Butea monosperma image (b) Gradiant& magnitude image analysis of section of Butea monosperma leaf image (c) Pseudocolor cluster based dead zone identification (d) greyscale Threshold image of original image identifying dead zone (e) K-means cluster HSV based dead zone identification (f) Color to gray scale transformation based detection of dead zone (g) Color Amplification in RGB & CMY plane to segment the dead zone of infected leaf (h) Simply edge based dead zone as spot detection by Robert Method.
In fig. 2.2. (e) Through the k-mean clustering method the infected region is indicated by the blue colour appearance ranging from the ranges of 10-20.
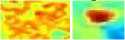
In Fig. 2.2. (g) The region of the leaf showing the colour (within the range of -20 to 0) shows that the bacterial infection have been initiated in that area.
The region of the leaf exhibiting the colours
range 0-20 exhibits the less infected area where primary infection starts and the appearance of minute spots occurs.
The region of the leaf exhibiting the colour range 20-60 exhibits the bacteria multiply itself and the secondary infection starts where the size of the spot increases and appears to be irregular in shape.

The region of the leaf exhibiting the colour range 60-80 exhibits the highly infected stage where the infected area increases in size and becomes darker in colour i.e. brown to black in appearance.
The region of the leaf exhibit the colour
1 (range
of 20-40) are the one where the lesions on the leaf appear to be darker in colour surrounded by the purple concentric rings.
The region of the leaf exhibit the colour

(range
of 0-20) are the highly infected area where the mycelium becomes separate, branched and darker in colour.
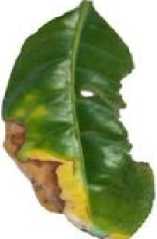
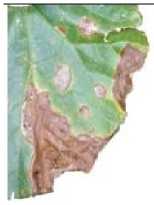
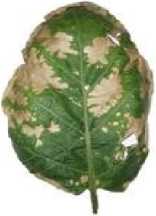
(a) Gossyptum spp
The leaf of this plant shows brown spots
indicating folia disease caused due potassium deficiency.
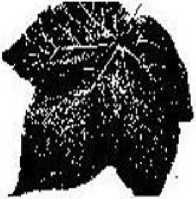
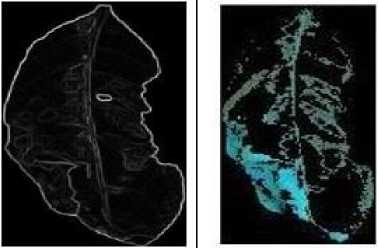
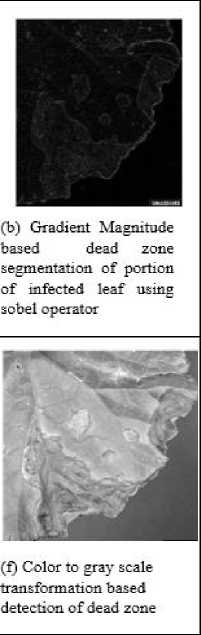
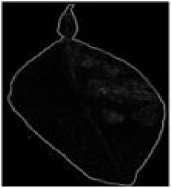
(b) Gradient Magnitude based dead zone segmentation of portion of infected leaf using sobel operator
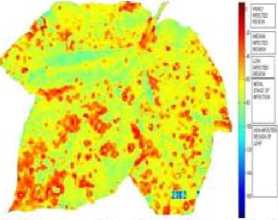
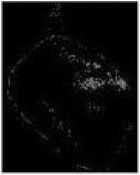
(c) К-means Cluster based segmentation in L*a*b color space
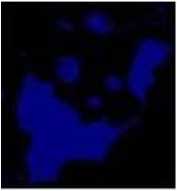
(f) Color to gray scale transformation based detection of dead zone
(d) Greyscale thresholding based segmentation
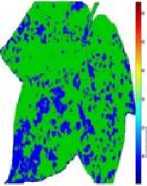
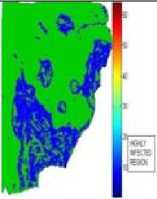
(e) К-means Cluster based segmentation in HSV color space with Color bar specification
(h)Edge
Detection(Roberts) result
In fig. 2.4. (e) through the k-mean clustering method the infected region is indicated by the blue colour appearance ranging from the ranges of 10-20.
In Fig. 2.4. (g) The region of the leaf exhibiting the colour ■■ (within the range of 100-180) is the noninfected region.
The region of the leaf exhibit the colour (range of 80-100 has initial growth) i.e. the hyphae are intercellular and penetrate into the cells of the infected tissues.
The region of the leaf exhibit the colour range of 40-80 are the one with low infected region the infected region starts becoming brown in colour.
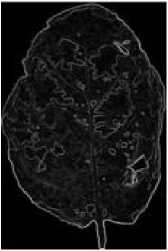
(^Tabernasemoniana divaricata
The plant attacked by fungi phytopthora sp. Causing leaf blight disease appears to be irregular brown colour covered by yellowr colour area appearing to oily or soapy in nature.
(b) Gradient Magnitude based dead zone segmentation of portion of infected leaf using sobel operator
(c) К-means Cluster based segmentation in L*a*b color space
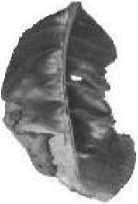
(f) Color to gray scale transformation based detection of dead zone
(d) Greyscale thresholding based segmentation
(e) K-means segmentation space with specification
Cluster based in HSV color Color bar
(h)Edge Detection(Roberts) result
In fig. 2.5. (e) Through the k-mean clustering method the infected region is indicated by the blue colour appearance ranging from the ranges of 10-20.
In Fig. 2.5. (g) The region of the leaf exhibiting the colour ^- within the range of 0-80 are the noninfected region.
The region of the leaf exhibiting the colour within the range of 100-120 are the one with the where

the infection has slightly started i.e. the phytopthora hyphae has penetrated into the cell of invaded tissue.
The region of the leaf exhibiting the colour within the range of 120-140 are the one with the conidia number is more and the region is somewhat more infected than normal.
The region of the leaf exhibiting the colour within the range of 140-180 are the one possessing well developed conidia with darker in colour.
(a) Citrulltis lanatus
The leaf is infected by
Oomycetes
Pseudoperonospora
an cubensis where the foliage turns brown and curls upward.
(с) К-means Cluster based segmentation in L*a*b color space
(d) Greyscale thresholding based
segmentation
(e К-means Cluster based segmentation in HSV color space with Color bar specification
(h)Edge Detection(Roberts) result
In fig. 2.6. (e) through the k-mean clustering method the infected region is indicated by the blue colour appearance ranging from the ranges of 10-20.
In Fig. 2.6.(g) the region of the leaf exhibiting the colour within the range of -50 to -100 is the non-infected region.
The region of the leaf exhibiting the colour

within the range of 0-50 exhibits the initial stage of infection where the number of spore of the fungal infection is less and the hyphae is not well developed.
The region of the leaf exhibiting the colour

within the range of 50-100 exhibits the highly infected area where the hyphae is well developed and the infected area becomes covered with yellow colour edges and the infected areas appears to corky.
■
The region of the leaf exhibiting the colour within the range of 40-60 exhibit are the one where the eggs laid are by the insects are matured.
The region of the leaf exhibiting the colour within the range of 80-100 exhibit the one when the leaf miner larvae inside the leaf feeds the soft inner tissues, when they are very small in size.
The region of the leaf exhibiting the colour

within the range of 100-120 exhibits the highly infected one where the leaf miner seriously injure the plant as they become adult and find the way out of the leaf.
(a)Solanum me longe па
The leaf is infected by a fungal disease caused by phomopsis vexans where the leaf turns grey to brown with irregular margins.
(b) Gradient Magnitude based dead zone segmentation of portion of infected leaf using sobel operator
(С) К-means Cluster based segmentation in L*a*b color space
(d) Greyscale thresholding based segmentation
(f) Color to gray scale transformation based detection of dead zone
(e) К-means Cluster based segmentation in HSV color space with Color bar specification
(h)Edge
Detection(Roberts) result
In fig. 2.7. (e) through the k-mean clustering method the infected region is indicated by the blue colour appearance ranging from the ranges of 10-20.
In Fig. 2.7. (g) the region of the leaf exhibiting the colour within the range of 0 to 40 exhibit the noninfected area.
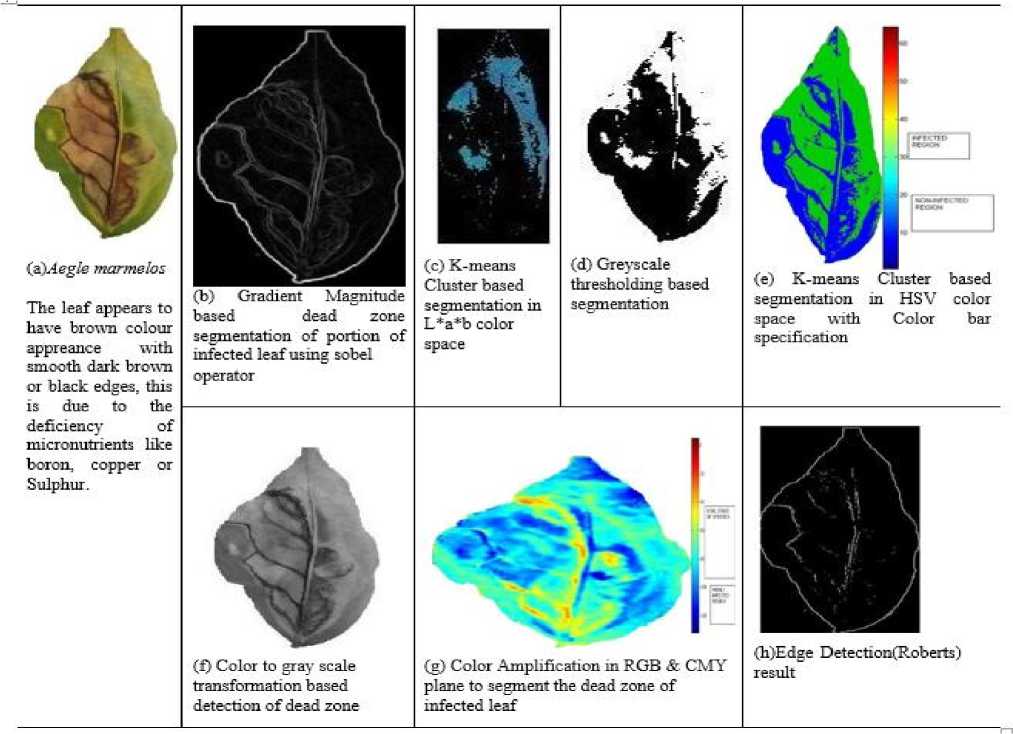
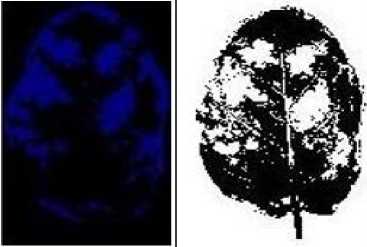
In fig 2.8(e) through the k-mean clustering method the infected region is indicated by the blue colour appearance ranging from the ranges of 10-20.
In Fig 2.8(g) the area of the leaf exhibiting colour the range of 0-40 exhibit the area where no micronutrient deficiency is seen.
The area possessing the colour

ange of 40-80
shows that the supply of micronutrient is less in amount as compared to the normal.
The area of the leaf exhibiting the colour

ange of
100-120 exhibits that this region highly lack the amount of micronutrient to be provided to the leaf for its growth.
(e) К-means Cluster based segmentation in HSV color space with Color bar specification
(a) Citrus limon
The lemon leaf shows brown corky and dry parts due to the occurance of citrus canker by Xanthomonas bacteria.
(b) Gradient Magnitude based dead zone segmentation of portion of infected leaf using sobel operator
(c) К-means Cluster based segmentation inL*a*b color
(d) Greyscale thresholding based segmentation
(f) Color to gray scale
transformation based
detection of dead zone
The Fig. 2.9.(g) the region of the leaf exhibiting the colour
range within 0-50 is in the non-infect ed regi on.
The region of the leaf exhibiting the colour range of 50-100 are the where the bacteria starts infecting i.e. starts infecting and are less in number.
The region of the leaf exhibiting the colour range within 100-150 are the one where the bacterial infection is more due the presence of more number and leading to the formation of canker.
In fig.2.10. (e) through the k-mean clustering method the infected region is indicated by the blue colour appearance ranging from the ranges of 10-20.
In the fig. .2.10.(g) the area of the leaf exhibiting the colour range within 100-150 are the non-infected parts.
The area exhibiting the region of color range within 50-100 are less infected as the infecting mycelium is narrow and hyaline in natured. The area exhibiting the colour range within 0-50 are highly infected as the mycelium is well matured and the conidia is matured and present in one or more numbers.
In fig .2.11. (e) through the k-mean clustering method the infected region is indicated by the blue colour appearance ranging from the ranges of 10-20.
In the Fig.2. 11. (g) The region of the leaf exhibiting the colour within the region of 0-50 is not infected one.
The region of the leaf exhibiting the colour range 100150 exhibits the stage where the mycelium starts penetrating into invaded tissue.
The region of the leaf exhibiting the colour within the range of 100-150 is the one where the hyphae becomes branched, separate and appears to be dark in colour.
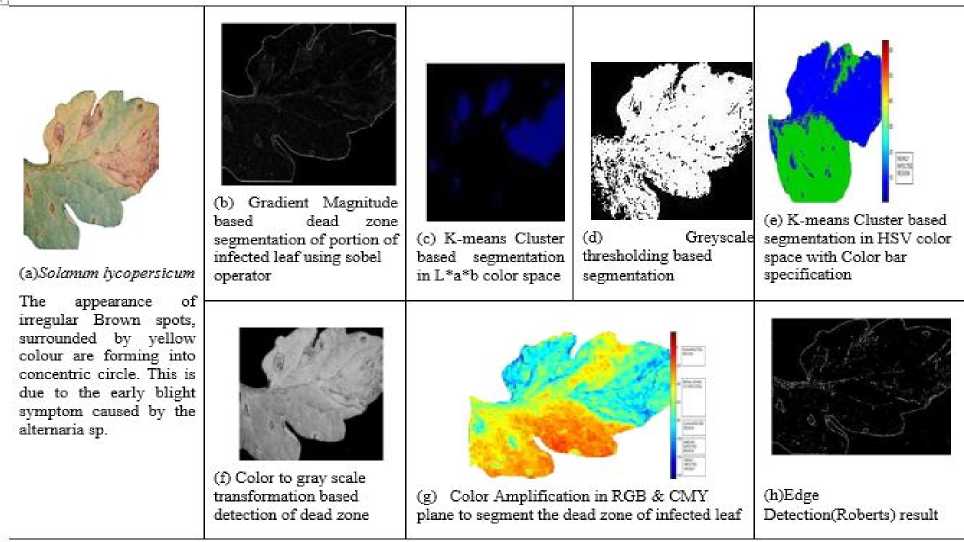
In fig .2.12. (e) through the k-mean clustering method the infected region is indicated by the blue colour appearance ranging from the ranges of 10-20.
In the Fig. 2.12. (g) The region of the leaf exhibiting the colour range 0-20 exhibits the portion which is not infected by the alternaria species. The region of the leaf exhibiting the colour range 20-80 exhibits the area where the penetration of hyphae into the cells occurs. The region of the leaf exhibiting the colour range 80-120 exhibits the stage where the mycelia is narrow and not fully developed. The region of the leaf exhibiting the colour range 120-140 exhibits the stage where the mycelia is branched, septate and the infected areas appears to be darker in colour due to exposure of conidia.
-
A. Histogram Analysis
The 100th scan line of few leaf image data sample spatial co-ordinate pixel intensities along x-axis with all y-axis shown in figure 13 the random PDF distribution
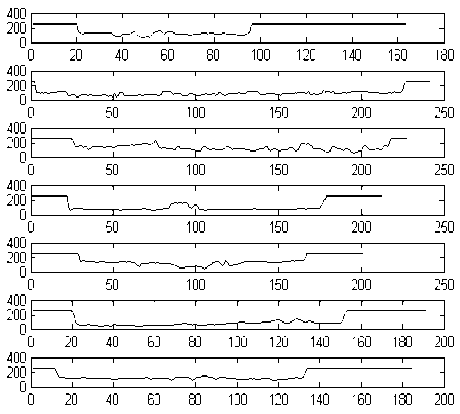
Fig.13. Plotting of 100th scan line spatial co-ordinate pixel intensities along x-axis with all y-axis shows the random Probability Distribution Function in grey plane of Codiaeum variegatum, Butea monosperma, Solanum melongena , Tabernasemontana divaricata, Aegle marmelos, Citrus limon, Tectona grandis respectively.
Distribution of data is being displayed by histogram specification or histogram equalization. In this paper the acquisition of dataset is done in different background from garden and fields and the leaves having dead zone has not equally distribution of data or pixel intensities. Few sample leaf histogram specification are being plotted which is shown in figure 14. Being the difference in texture and color specification the distribution of pixel intensities with respect to histogram in each Red, Green and Blue plane are unequal in nature.
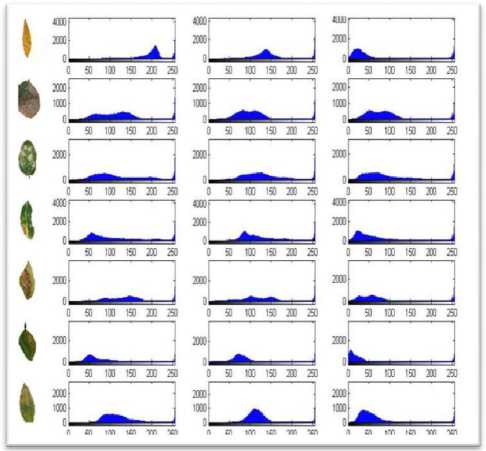
Fig.14. demonstrates the Histogram plot of few leaf sample along red, green, plane.
-
VI. Conclusion
A novel empirical analysis has done in this paper to mimic the dead zone present in different leaf sample in an effective way. Gradient and magnitude based segmentation, edge based segmentation, HSV based color segmentation using k-means clustering, Grey threshold based segmentation, and Salient feature based segmentation approach applied over lively leaf samples to identify the dead zone automatically. The cause of the dead zone is being justified in this paper. This work is effective to detect the dead zone in a leaf.
References Automatic dead zone detection in 2-D leaf image using clustering and segmentation technique
- Peifeng Xu, Gangshan Wu, Yijia Guo, Xiaoyin chen, Hetong Yang, Rangbiao Zhang “Automatic Wheat Leaf Rust Detection and Grading Diagnosis via Embedded Image Processing System” International Congress of Information and Communication Technology (ICICT 2017).Procedia Computer Science 107 (2017) 836 – 841.
- Manisha Bhange and H.A.Hingoliwala “Smart Farming: Pomegranate Disease Detection Using Image Processing”. Second International Symposium on Computer Vision and the Internet (VisionNet’15). Procedia Computer Science 58 (2015) 280 – 288
- Mohammad El –Helly, Ahmed Rafea, Salwa El – Gamal And Reda Abd El Whab “Integrating Diagnostic Expert System With Image Processing Via Loosely Coupled Technique”, Central Laboratory for Agricultural Expert System (CLAES).
- Brendon J. Woodford , Nikola K. Kasabov and C. Howard Wearing[1999] Fruit Image Analysis using Wavelets , Proceedings of the ICONIP/ANZIIS/ANNES.
- Prof. Sanjay B. Dhaygude and Mr. Nitin P. Kumbhar “Agricultural Plant Leaf Detection Using Image Processing” International Journal of Advanced Research in Electrical, Electronics and Instrumentation Engineering Vol. 2, Issue 1, January 2013. ISSN: 2278 – 8875
- M. S. Prasad Babu and B. Srinivasa Rao “Leaves Recognition Using Back Propagation Neural Network Advice For Pest and Disease Control On Crops”, IndiaKisan.Net: Expert Advissory System.
- Santanu Phadikar & Jaya Sil “Rice Disease Identification Using Pattern Recognition Techniques”, Proceedings of 11th International Conference on Computer and Information Technology (ICCIT 2008) 25-27 December, 2008, Khulna, Bangladesh
- Vijai Singh and A. K. Misra in the paper “Detection of plant leaf disease using image segmentation and soft computing technique”. INFORMATION PROCESSING IN AGRICULTURE 4 (2017) 41–49.
- A.Meunkaewjinda, P.Kumsawat, K.Attakitmongcol and A.Srikaew “Grape leaf disease detection from color imagery system using hybrid intelligent system”. Proceedings of ECTICON, 2008, IEEE, PP-513-516.
- Alexandre A. Bernardes, Jonathan G. Rogeri, Roberta B. Oliveira, Norian Marranghello, Aledir S. Pereira, Alex F. Araujo and Joao Manuel R. S. Tavares. “Identification of Foliar Diseases in Cotton Crop”. J. M. R. S. Tavares and R. M. Natal Jorge (eds.), Topics in Medical Image Processing and Computational Vision, Lecture Notes in Computational Vision and Biomechanics 8, DOI: 10.1007/978-94-007-0726-9_4, 1 Springer Science Business Media Dordrecht 2013. pp 67-85
- Xu Pengyun& Li Jigang [2009] Computer assistance image processing spores counting, 2009 International Asia Conference on Informatics in Control, Automation and Robotics, IEEE computer society, pp-203-206
- Qing Yao, Zexin Guan, Yingfeng Zhou, Jian Tang, Yang Hu, Baojun Yang “Application of support vector machine for detecting rice diseases using shape and color texture features”, 2009 International Conference on Engineering Computation. IEEE computer society, pp79-83
- Di Cui, Qin Zhang , Minzan Li, Youfu Zhao ,Glen L. Hartman “Detection of soybean rust using a multispectral image sensor”, Springer Science Business Media, LLC 2009. Sens. & Instrument. Food Qual. (2009) 3:49–56
- Xinhong Zhang & Fan Zhang “Images Features Extraction of Tobacco Leaves”. 2008 Congress on Image and Signal Processing, IEEE computer society, pp-773776.
- Chaudhary Piyush et al. “Color transform based approach for disease spot detection on plant leaf.Int Comput Sci Telecommun 2012;3(6)
- Jayamala K. Patil, Raj Kumar “Advances in image processing for detection of plant diseases”. Journal of Advanced Bioinformatics Applications and Research ISSN 0976-2604 Vol 2, Issue 2, June-2011, pp- 135-141
- R.C. Barik, R. Mishra “Comparative Analogy on Classification and Clustering of Genomic Signal by a Novel Factor Analysis and F-Score Method” S.S. Dash et al. (eds.), Artificial Intelligence and Evolutionary Computations in Engineering Systems, Advances in Intelligent Systems and Computing, Springer, India pp399-409.
- Achanta R., Estrada F., Wils P., Susstrunk S. (2008) Salient Region Detection and Segmentation. In: Gasteratos A., Vincze M., Tsotsos J.K. (Eds) Computer Vision Systems. ICVS 2008. Lecture Notes in Computer Science, vol 5008. Springer, Berlin, Heidelberg
- Girish N. Chaple, R. D. Daruwala, Manoj S. Gofane “Comparisons of Robert, Prewitt, Sobel operator based edge detection methods for real time uses on FPGA”, IEEE Conference (ICTSD-2015), Feb. 04 – 06, 2015, Mumbai, India.
