Automatic Fungal Disease Detection based on Wavelet Feature Extraction and PCA Analysis in Commercial Crops

Author: Jagadeesh D. Pujari, Rajesh.Yakkundimath, Abdulmunaf. Syedhusain. Byadgi
Journal: International Journal of Image, Graphics and Signal Processing(IJIGSP) @ijigsp
Article in issue: 1 vol.6, 2013.
Free access
This paper describes automatic detection and classification of visual symptoms affected by fungal disease. Algorithms are developed to acquire and process color images of fungal disease affected on commercial crops like chili, cotton and sugarcane. The developed algorithms are used to preprocess, segment, extract and reduce features from fungal affected parts of a crop. The feature extraction is done with discrete wavelet transform (DWT) and features are further reduced by using Principal component analysis (PCA). Reduced features are then used as inputs to classifiers and tests are performed to classify image samples. We have used statistical based Mahalanobis distance and Probabilistic neural network (PNN) classifiers. The average classification accuracies using Mahalanobis distance classifier are 83.17% and using PNN classifier are 86.48%
Fungal disease, Discrete wavelet transform, Principal component analysis, Mahalanobis distance, Probabilistic neural network
Short address: https://sciup.org/15013162
IDR: 15013162
Text of the scientific article Automatic Fungal Disease Detection based on Wavelet Feature Extraction and PCA Analysis in Commercial Crops
Published Online November 2013 in MECS
India ranked within the world's five largest producers of over 80% of agricultural produce items, including many commercial crops. Agriculture is still the largest economic sector and plays a major role in socioeconomic development of India. Agriculture in India is the means of livelihood of almost two thirds of the workforce in India. India has over 210 million acres of farm land. Jowar, wheat, sunflower, cereals are the major crops. Apple, banana, sapota, grapes, oranges are the most common fruits. Sugarcane, cotton, chili, groundnuts are the major commercial crops.
Agricultural production of the world sustains annual loss of about 20 to 30% on an average due to plant diseases in different crops and in different countries.
According to NABARD (National Bank for agriculture and rural development) India loses about 30% of its crops due to pests and diseases each year. The damage due to these is estimated to be Rs.60, 000 crores annually.
Plant disease diagnosis is an art as well as science. The diagnostic process (i.e. recognition of symptoms and signs), is inherently visual and requires intuitive judgement as well as the use of scientific methods. Many disease produce symptoms which are the main tools for field diagnosis of diseases showing external symptoms out of a series of reactions that take place between host and pathogen. As such, several important decisions regarding safe practices, the production and processing of plant have been made in the recent past.
Photographic images of plant disease symptoms and signs used extensively to enhance description of plant diseases are invaluable in research, teaching and diagnostics etc. Plant pathologists can incorporate these digital images using digital image transfer tools in diagnosis of plant diseases. Images often do not possess sufficient details to assist in diagnosis, resulting in waste of time, misshaping the diagnostician to arrive at incorrect diagnosis. Farmers experience great difficulties and also in changing from one disease control policy to another i.e. intensive use of pesticides. In the absence of comprehensive knowledge, disputes over costs, benefits, and the potential for harm of chemical pesticides easily become polarized (Pinstrup-Andersen, 2001).
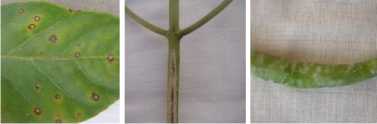
(a) (b) (c)
Figure 1. Visual fungal symptoms affected on: (a) chili leaf; (b) chili stem ;(c) chili fruit
Farmers are more concerned about the huge costs involved in these activities and severe loss. The cost intensity, automatic correct identification and classification of diseases based on their particular symptoms is very useful to farmers and also agriculture scientists. Early detection of diseases is a major challenge in horticulture and agriculture science. Development of proper methodology, certainly of use in these areas. One of the main concerns of scientists is the automatic disease diagnosis and control. (Basvaraj .S. Anami et al; 2011).
Computer vision Systems developed for agricultural applications, namely detection of weeds, sorting of fruits in fruit processing, classification of grains, recognition of food products in food processing, medicinal plant recognition etc. In all these techniques, digital images are acquired in a given domain using digital camera and image processing techniques are applied on these images to extract useful features that are necessary for further analysis.
Plant diseases are caused by pathogens. Hence a pathogen is always associated with a disease. In other way, disease is a symptom caused by the invasion of a pathogen that is able to survive, perpetuate and spread. Most plant diseases are caused by bacteria, fungi, virus, etc of which fungi are responsible for a large number of diseases in plants. Most of the published work is focused on generic disease affected on crop (Jayamala K. Patil et al; 2011). No work has been stated with respect to fungal disease affected on commercial crops using image processing techniques.
The objective of this study was (I) to detect and classify type of fungal disease symptom affected on Commercial crops (II) to detect diseased leaf, fruit and stem/stalk. The samples of fungal affected images are shown in Fig.1.
The paper is organized into four sections. Section 2 gives the proposed methodology. Section 3 describes results and discussions. Section 4 gives conclusions of the work.
-
II. PROPOSED METHDOLOGY
In the present work tasks like image acquisition, preprocessing, segmentation, feature extraction, feature reduction and classification are carried out. The detailed block diagram of adopted methodology is shown in Fig.2. The classification tree is given in Fig.3.
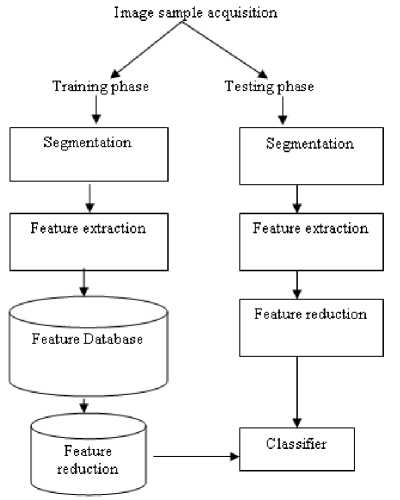
Figure 2. Block diagram of adopted methodology
-
A. Image set
The set of 2616 fungal affected image samples on commercial crops like chili (Capicum annuum), cotton (Gossypium hirsutum) and sugarcane (Sacharum Officinarum) are considered for work. The image sample was obtained from department of plant pathology at the University of Agricultural Sciences, Dharwad, INDIA. The chosen fungal disease symptoms affected on different parts of commercial crops are chili stem anthracnose, chili stem powderymildew, chili fruit anthracnose, chili fruit powdery mildew, chili fruit rot, chili leaf anthracnose, chili leaf powdery mildew, chili alternaria leaf spot, cotton stem fusarium wilt, cotton alternaria leafspot, cotton leaf fusarium wilt, cotton leaf graymildew, sugarcane leaf smut, sugarcane leaf redrot, sugarcane stem redrot.Table.1 shows scientific classification of fungal symptom affected on each commercial crop type along with affected part.
-
B. Image preprocessing
The single crop image is captured by analog camera. Then preprocessing steps applied over image. The preprocessing of image includes shade correction, removing artifacts, formatting. Formatting deals with storage representation and setting the attributes of the image. Image samples are segmented using grab cut segmentation (Justin.F et al; 2006). The grab cut segmentation method is used to segment regions between foreground and background. The foreground region depicts the affected stem, leaf or fruit of each crop type. Fig.4 shows segmented image after applying grab cut segmentation method.
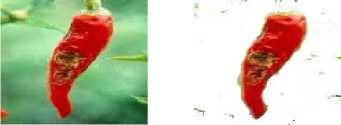
(a) (b)
Figure 4. Foreground region showing affected chili fruit: (a) Input image; (b) Segmented image
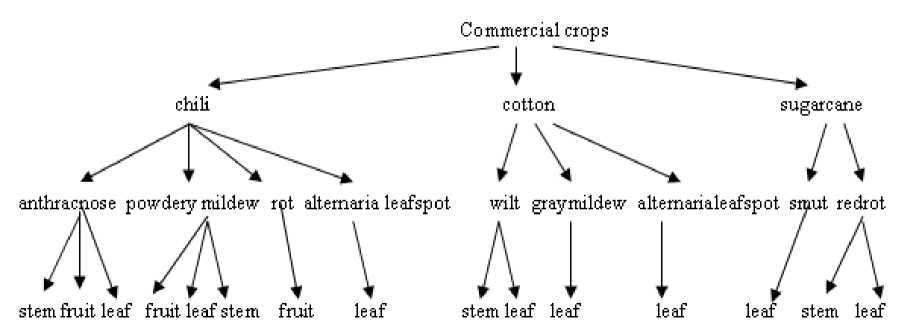
Figure 3. Classification tree
-
C. Wavelet based feature extraction
Once the image have been segmented the identified regions, features are extracted from the image. The image height and width are set to even multiples of 512 and 512 pixels respectively and separated into three matrices corresponding to the original images’ Red, Green and Blue color components (P.S.Hiremath et al; 2006).In this work, we have proposed a method to extract features based on discrete wavelet transform (DWT). The image samples are subjected to 2D wavelet decomposition using Daubechies db4 wavelets which is applied to each color component resulting in a 512x512 matrix of each color component. The coefficients of approximation (CA1) and sub-image details are obtained for each color component. The subimage details co-efficients are described as a horizontal (CH1), vertical (CV1) and diagonal (CD1). The numbers of co-efficient generated by first level decomposition are very large and may not be suitable for classification (E.-S.A.Dahshan et al; 2010).
TABLE I. Scientific classification of fungal symptoms affected on Commercial crops
|
F ungal Symptom |
Causal organism |
Family |
Order |
Class |
Sub division |
Affe ete d p art |
|
Chili Anthracnose |
C olletotrichum c ap sici |
M elac oniac e ae |
Melancon! ales |
Coelomycetes |
D euteromyc otina |
Stem, leaf, fruit |
|
Chili P owdery mildew |
Leveillula tauric a |
Frysiphac e ae |
Frys ip hales |
Pie eto myc ete s |
A s cornyc otina |
Stem, leaf, fruit |
|
Chili F ruit |
C olletotrichum cap sici |
gl о me tell ac e ae |
glome rellale s |
s ordariomyc etidae |
As cornycota |
fruit |
|
Chili Alter aria leaf spot |
Altemaria alternata |
pleosporales |
pleosporales |
dothide omycetes |
pie о sporomy c etidae |
leaf |
|
C otton Altemaria leaf spot |
Altemaria mac to sp ore |
pieоsporaceae |
pleosporales |
dothide omycetes |
pie о sporomyc etidae |
le af |
|
Cotton Wilt |
Fusarium oxysp orum |
N e ctriac e ae |
hyp о ere ale s |
s ordariomyc ete s |
As corny cota |
Stem, le af |
|
Sugarc ane S mut |
Sporisorium scitamineum |
sporisorium |
us til a gin :al e s |
u s tili a gin о my c e t e s |
В asidio myc ota |
le af |
|
Sugarc ane red rot |
Glomerella tucumanensis |
gl о me tell ac e ae |
Incertae sedis |
s ordariomyc ete s |
s ordariomyc etidae |
Stem, le af |
It also increases the computation time. The approximation coefficients are therefore further decomposed yielding the next level.
The DWT with db4 is applied to each color component at level two resulting in a 256x256 matrix for each color component. Db4 wavelet transform at level two decomposition get the approximation (CA2), horizontal (CH2), vertical (CV2) and diagonal (CD2) details.
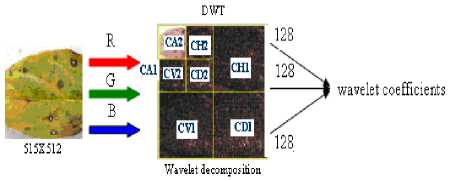
Figure 5. Process of applying discrete wavelet transformation
As the level of decomposition is increased, compact but coarser approximation of the image is obtained. Thus, wavelets provide a simple hierarchical framework for interpreting the image information (Namita Aggarwal et al; 2012). The third level and further levels of wavelet decomposition greatly reduces the input vector size but results in lower classification percentage. The wavelet features extracted at decomposition level two are therefore considered for classifiers. A sub-matrix of 128x128 is extracted from the top left hand quartile which indicates approximation co-efficients (CA2) of each color component matrix resulting in 16,384x3=49,152 wavelet co-efficients. The three 128x128 color component sub-matrices are combined to form a feature vector of wavelet co-efficients of 49,152. (Brendon J. Woodford et al; 2003).The wavelet feature extraction applied on image is shown in Fig.5. Algorithm.1 gives the wavelet feature extraction procedure.
Algorithm 1 : Wavelet feature extraction
Input : 24-bit color image of size 512 x 512
Output : Wavelet feature set
Start
Step1 : Separate Red, Blue and Green component from
RGB space
Step2 : Apply 2D-DWT, db4 to each color component at level one.
Step3 : Compute wavelet based co-efficients for each of the R, G, B channels.
Step4 : Repeat step 2 & 3 at level two.
Step5 : Separate and calculate approximation wavelet co-efficients at level two for R, G, B.
Step6 : Combine co-efficients to form feature vector
Stop
With the second level decomposition, the feature vector size (49,152) is too large to be given as an input to a classifier which results in lower classification accuracy. In machine learning, during the training of the classifiers, if the numbers of image features are large, it can lead to ill-posing and over fitting, and reduce the generalization of the classifier. One way to overcome this problem is to reduce the dimensionality of features. To reduce the dimensionality of the large set of features of dataset, in our work, we proposed the use of Principal Component Analysis (PCA).
-
D. PCA based feature reduction
PCA is a dimensionality reduction algorithm that can be used to significantly speed up feature learning algorithm. It is a way of identifying patterns in data, and expressing the data in such a way as to highlight their similarities and differences. Since patterns in data can be hard to find in data of high dimension, PCA is a powerful tool for analyzing data. The other main advantage of PCA is that once patterns in the data were found, data can be compressed by reducing the number of dimensions, without much loss of information. PCA uses linear Transformations to map data from high dimensional space to low dimensional space. The low dimensional space can be determined by Eigen vectors of the covariance matrix.
Row feature vector is the matrix with the eigenvectors in the columns transposed so that the eigenvectors are in the rows, with the most significant eigenvector at the top and Row data adjust is the mean-adjusted data transposed, i.e.; the feature items in each column, with each row holding a separate dimension. Final feature is the final feature set, with feature items in columns, and dimensions along rows. The eigenvector with the highest eigenvalue is the principle component of the data set. By ignoring the components of less significance the final feature set will have less dimensions than original (Lindsay I Smith, 2002). Algorithm.2 gives wavelet features reduction procedure using PCA.
Algorithm 2: Wavelet feature reduction using Principal Component Analysis
Input : Output of Algorithm 1.
Output : Reduced Wavelet features
Start
Step1 : Obtain the mean value D of the wavelet feature set “D”.
Step2 : Subtract the mean value D from D. From these values a new matrix “M” is obtained.
Step3 : Calculate the co-variance matrix;
C=MMT
Step4 : Calculate the eigenvectors and eigenvalues of the covariance matrix
Step5 : Choose components and form a feature vector
Feature Vector = (eig1, eig2, eig3 ……..eign) Step6 : Derive the new wavelet feature set.
Final feature = Row feature vector x Row data adjust
Stop
The number of wavelet features reduced from PCA is 262 for red, green and blue color components. The features from these three color components are combined to form feature vector of 786 features which are given as input to the classifiers.
-
III. CLASSIFIERS
-
A. Statistical Classifier Using Squared Mahalanobis
Minimum Distance
The Mahalanobis distance is a very useful way of determining the similarity of a set of values from an unknown sample to a set of values measured from a collection of known samples. One of the main reasons the
Mahalanobis distance method is used is that it is very sensitive to inter-variable changes in the training data. In addition, since the Mahalanobis distance is measured in terms of standard deviations from the mean of the training samples, the reported matching values give a statistical measure of how well the spectrum of the unknown sample matches (or does not match) the original training spectra. This method belongs to the class of supervised classification. Since this work is, a feasibility study to analyze whether such techniques give accurate enough results, so that the technology is viable for an autonomous harvester, supervised classification is a good approach to test the efficacy of the method.
The underlying distribution for the complete training data set was a mixture of Gaussian model. The next step is to calculate the statistics representing those classes. The procedure until this stage represented the training phase, where in, we calculate the necessary statistical features various classes. After the parameter sets were obtained, the classifier was tested on the test images for each class. This constitutes the testing phase.
The classifier was based on the squared Mahalanobis distance from the feature vector representing the test image to the parameter sets of the various classes. It used the nearest neighbor principle. The squared Mahalanobis distance metric is calculated using equation. (1).
r2=(x-μ)T Σ-1(x-μ) (1)
Where,
‘x’ is the N-dimensional test feature vector (N is the number of features considered),
‘μ’ is the N-dimensional mean vector for a particular class
‘Σ’ is the N x N dimensional co-variance matrix.
During testing phase of the method, the squared Mahalanobis distance, for a particular test vector is calculated with all the classes. The test image is then classified using the minimum distance principle. The test image is classified as belonging to a particular class to which its squared Mahalanobis distance is minimum among the calculated distances (Nikhil Niphadkar).
-
B. Probabilistic Neural Network Classifier
Recent resurgence of interest in artificial neural networks has resulted in different models for real-world applications. Artificial neural networks are the massively parallel structures of simple processing units that can be used for solving computationally complex tasks such as image processing, computer vision, pattern recognition etc.
We have used Probabilistic neural networks (PNN) for classification in this work (D.S.Guru et al; 2011). When an input is presented, the first layer computes distances from the input vector to the training input vectors, and produces a vector whose elements indicate how close the input is to a training input. The second layer sums these contributions for each class of inputs to produce as its net output a vector of probabilities. Finally, a compete transfer function on the output of the second layer picks the maximum of these probabilities, and produces a 1 for that class and a 0 for the other classes. The reason in selecting PNN is that it has fast training process orders of magnitude faster than backpropagation, an inherently parallel structure, guaranteed to converge to an optimal classifier as the size of the representative training set increases, no local minima issues, training samples can be added or removed without extensive retraining. The classification procedure is depicted in Algorithm.3.
Algorithm 3 : Recognition and Classification of fungal symptoms affected on Commercial crops
Start
Step1 : Accept the fungal affected images on chili, cotton and sugarcane
Step2: Extract wavelet based features using Algorithm 1.
Step3 : Perform feature reduction using Algorithm 2.
Step4 : Train the classifiers with reduced features
Step5 : Accept test images and perform Step 2 & 3.
Step6 : Recognize and classify the images using classifiers
Stop
-
IV. RESULTS AND DISCUSSIONS
All the algorithms used in this work are implemented using MATLAB 7.0. The image samples are divided into two halves and one half is used for training and other is for testing. Around 15% image samples are used for validation of the designed classifier model.
The percentage accuracy is defined as the ratio of correctly recognized image samples to the total number of test image samples. The Percentage accuracy is given by equation. (2).
Correctly Re cognised Im age Samples Percentage Accuracy = *100
Total Number of Test Image
From Fig.6 the highest recognition and classification accuracy of 94% is observed with cotton alternaria leaf spot and the lowest of 72% is observed with sugarcane leaf redrot using Mahalanobis distance classifier.
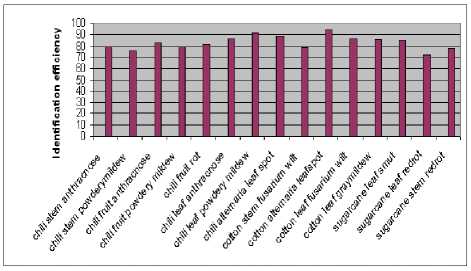
Figure 6. Average classification accuracy using Mahalanobis distance classifier per class
From Fig.7 the highest recognition and classification accuracy of 96% is observed with cotton leaf graymildew and the lowest of 78% is observed with cotton stem fusarium wilt using PNN classifier.
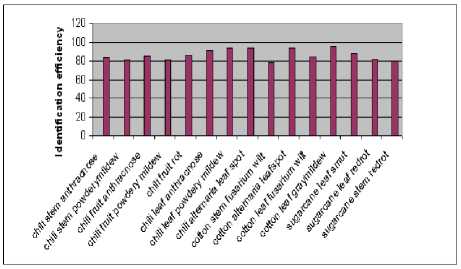
Figure7. Average classification accuracy using PNN per class
The average classification accuracies for Mahalanobis distance and PNN classifiers are 83.17% and 86.48% respectively as shown in Fig.8.
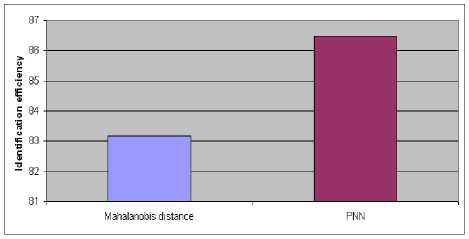
Figure 8. Average classification accuracies for Mahalanobis distance and PNN classifiers
Fig.9 shows average computational time for individual classifiers of which PNN classifier has 25% speed up over Mahalanobis distance classifier.
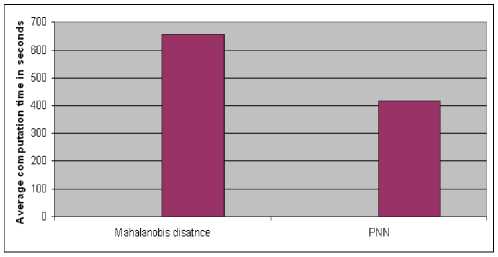
Figure 9. Computational time for Mahalanobis distance and PNN classifiers
Fig.10 shows the performance of individual classifiers with respect to True positive rate (TPR), False positive rate (FPR), Precision, Recall and F-measure.
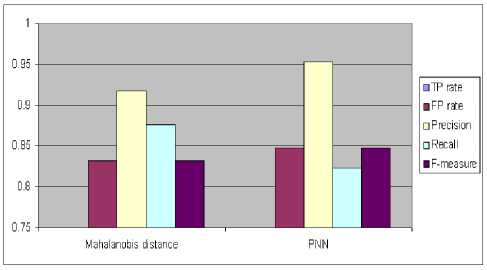
Figure 10. Comparison of classifiers with various parameters
-
V. CONCLUSIONS
The technology leverage farmers can take up to asses the crop, look at the possibility of diseases at early stages, take decision on possible treatment, and the like. The identification of the symptoms of fungal diseases, by means of a machine vision system may support farmers in proper assessment of crops. Here we used image samples of commercial crops that showed visual symptoms of a fungal disease. Features were extracted from affected region and used as inputs to a Mahalanobis distance and PNN classifiers. The classification accuracy and computational speed up for training taken by classifiers shows that PNN classifier works better for our approach.
The work carried out has relevance to the real world classification of commercial crop disease and it involves both image processing and pattern recognition techniques. For future study, different neural network architectures, Support Vector machine (SVM), Statistical methods can be used for classification. We can extend this project to classify disease affected on fruits, vegetables, cereals etc.
Acknowledgements
References Automatic Fungal Disease Detection based on Wavelet Feature Extraction and PCA Analysis in Commercial Crops
- J.D. Pujari, Rajesh.Yakkundimath, A.S.Byadgi (2013), “Grading and Classification of anthracnose fungal disease in fruits”, International Journal of Advanced Science and Technology, Vol.52.
- Arman Arefi and Asad Modarres Motlagh (2013) , “Development of an expert system based on wavelet transform and artificial neural networks for the ripe tomato harvesting robot”, AJCS 7(5):699-705, ISSN:1835-2707.
- Heena Patel and Saurabh Dave (2012), “An application of Radon and Wavelet Transforms for Image Feature Extraction”, International Journal of Electronics and Communication Engineering, Volume 1,Issue 2, Pages 1-8.
- Namita Aggarwal, R. K. Agrawal (2012), “First and Second Order Statistics Features for Classification of Magnetic Resonance Brain Images”, Journal of Signal and Information Processing, 2012, 3, 146-153 doi:10.4236/jsip.2012.32019 Published Online May 2012 (http://www.SciRP.org/journal/jsip).
- A. Phinyomark, A. Nuidod, P. Phukpattaranont and C. Limsakul (2012), “Feature Extraction and Reduction of Wavelet Transform Coefficients for EMG Pattern Classification”, Electronics and Electrical Engineering. – Kaunas: Technological, No. 6(122). – P. 27–32.
- Y. Zhang* and L. Wu (2012), “An MR Brain images classifier via principal component analysis and kernel support vector machine”, Progress In Electromagnetics Research, Vol. 130, 369-388.
- Jayamala K. Patil, Raj Kumar (2011), “Advances in image processing in image processing for detection of plant diseases”, Journal of Advanced Bioinformatics Applications and Research Volume 2, Issue 2, Pages 135-141.
- Lili N.A, F. Khalid, N.M. Borhan (2011), “Classification of Herbs Plant Diseases via Hierarchical Dynamic Artificial Neural Network after Image Removal using Kernel Regression Framework”, International Journal on Computer Science and Engineering Vol. 3 No.1.
- D. Moshou, C. Bravo , R. Oberti , J.S. West , H. Ramon , S. Vougioukas , D. Bochtis (2011), “Intelligent multi-sensor system for the detection and treatment of fungal diseases in arable crops”, Biosystems Engineering (1 0 8) Pages 3 1 1 -3 2 1.
- D S Guru, P B Mallikarjuna, S Manjunath (2011), “Segmentation and Classification of Tobacco Seedling Diseases”, COMPUTE '11 Proceedings of the Fourth Annual ACM Bangalore Conference.
- Basvaraj .S. Anami, J.D.Pujari and Rajesh.Yakkundimath (2011), “Identification and Classification of Normal and Affected Agriculture/horticulture Produce Based on Combined Color and Texture Feature Extraction”, International Journal of Computer Applications in Engineering Sciences, Vol 1, Issue 3.
- H. Al-Hiary, S. Bani-Ahmad, M. Reyalat, M. Braik and ALRahamneh (2011), “Fast and Accurate Detection and Classification of Plant Diseases”, International Journal of Computer Applications, Volume 17– No.1.
- Miroslaw Miciak (2010), “Radon Transformation and Principal Component Analysis Method Applied in Postal address recognition task”, International Journal of Computer Science and Applications, Vol. 7 No. 3, pp. 33 – 44.
- E.-S. A. Dahshan, T. Hosny and A.-B. M. Salem (2010), “A Hy- brid Technique for Automatic MRI Brain Images Classification,” Digital Signal Processing, Vol. 20, No. 2, pp. 433-441.
- A. Camargo, J.S. Smith (2009), “Image pattern classification for the identification of disease causing agents in plants”, Computers and Electronics in Agriculture (66) Pages 121–125.
- Qing Yao, Zexin Guan, Yingfeng Zhou, Jian Tang, Yang Hu and Baojun Yang (2009), “Application of support vector machine for detecting rice diseases using shape and color texture features”, International Conference on Engineering Computation.
- Mehdi Lotfi, Ali Solimani, Aras Dargazany, Hooman Afzal, Mojtaba Bandarabadi (2009), “Combining Wavelet Transforms and Neural Networks for Image Classification”, 41st Southeastern Symposium on System Theory University of Tennessee Space Institute Tullahoma, TN, USA, March 15-17.
- Geng Ying, Li Miao, Yuan Yuan and Hu Zelin (2008), “A Study on the Method of Image Pre-Processing for Recognition of Crop Diseases”, International Conference on Advanced Computer Control.
- Kuo-Yi Huang (2007), “Application of artificial neural network for detecting Phalaenopsis seedling diseases using color and texture features”, computers and electronics in agriculture (57), Pages 3–11.
- P.S.Hiremath, S. Shivashankar and Jagadeesh Pujari (2006), “Wavelet based features for color texture classification with application to CBIR”, International Journal of Computer Science and Network Security, VOL.6 No.9A.
- R. Pydipati, T.F. Burks and W.S. Lee (2006), “Identification of citrus disease using color texture features and discriminate analysis”, Computers and Electronics in Agriculture, Volume 52, Issue 1-2, Pages 49-59.
- Justin F. Talbot, Xiaoqian Xu Implementing Grab Cut. Brigham Young University, Revised: April 7, 2006.
- Duy-Dinh Le and Shin’ichi Satoh (2005), “An Efficient Feature Selection Method for Object Detection”, ICAPR, LNCS 3686, pp. 461–468.
- Brendon J. Woodford, Da Deng and George L Benwell(2003), “A wavelet-based neuro-fuzzy system for data mining small image sets”, CRPIT Series Volume 32, ISBN 1 920682 14 7.
- Pinstrup-Andersen (2001), “The Future World Food Situation and the Role of Plant Diseases”, DOI: 10.1094/PHI-I-2001-0425-01.
- Carsten Rother, Vladimir Kolmogorov, Andrew Blake (1991), "Grab Cut - Interactive Fore-ground Extraction using Iterated Graph Cuts”, Microsoft Research Cambridge, UK.
- Orchard, M. T., Bouman, C. A. (1991), “Color Quantization of Images”, IEEE Transactions on Signal Processing 39, 12, 2677-2690.
- Mohd Zafran, Hadzli Hasim, Robbaiah,yuslindawati, “Identification of Psoriasis Lesion Features Using Daubechies D4 Wavelet Technique”, Recent Researches in Communications, Electronics, Signal Processing and Automatic Control”, ISBN: 978-1-61804-069-5.
- Keyun Tong(2010), “Wavelet Transform And Principal Component Analysis Based Feature Extraction”.
- Nikhil Niphadkar, Shashikiran Prabhakar and Venkat Jayaraman, “Disease Detection and Classification of Citrus leaves using Feature Weighted Mahalanobis and Neural Networks Classifiers”, EEL 6825 - Pattern Recognition, University of Florida.
- Jain, Anil K. Fundamentals of Digital Image Processing. Englewood Cliffs, NJ: Prentice-Hall, 1989.
- Digital Image. Processing. Using MATLAB®. Second Edition. Rafael C. Gonzalez.
- Matlab neural network toolbox documentation. MathWorks.Inc[Online].Available:http://www.mathworks.com/access/helpdesk/help/toolbox/nnet /radial10.html#8378.
- Pattern classification.R. O. Duda, P. E. Hart and D. G. Stork, John Wiley & Sons, 2000.
- Dr. K T. Chandy, “Important Fungal Diseases”, Booklet No. 342, Plant Disease: Control: PDCS – 4.
