Automatic Image Segmentation Base on Human Color Perceptions

Author: Yu Li-jie, Li De-sheng, Zhou Guan-ling
Journal: International Journal of Image, Graphics and Signal Processing(IJIGSP) @ijigsp
Article in issue: 1 vol.1, 2009.
Free access
In this paper we propose a color image segmentation algorithm based on perceptual color vision model. First, the original image is divide into image blocks which are not overlapped; then, the mean and variance of every image back was calculated in CIEL*a*b* color space, and the image blocks were divided into homogeneous color blocks and texture blocks by the variance of it. The initial seed regions are automatically selected depending on calculating the homogeneous color blocks' color difference in CIEL*a*b* color space and spatial information. The color contrast gradient of the texture blocks need to calculate and the edge information are stored for regional growing. The fuzzy region growing algorithm and coloredge detection to obtain a final segmentation map. The experimental segmentation results hold favorable consistency in terms of human perception, and confirm effectiveness of the algorithm.
Color image segmentation, visible color difference, region growing, human color perception
Short address: https://sciup.org/15011951
IDR: 15011951
Text of the scientific article Automatic Image Segmentation Base on Human Color Perceptions
Published Online October 2009 in MECS
Image segmentation refers to partitioning of an image into different regions that are homogeneous or “similar” in some image characteristics. It is usually the first task of any image analysis process module and thus, subsequent tasks rely strongly on the quality of segmentation[1]. In recent years, automatic image segmentation has become a prominent objective in image analysis and computer vision. Various techniques have been proposed in the literature where color, edges, and texture were used as properties for segmentation. Using these properties, images can be analyzed for use in several applications including video surveillance, image retrieval, medical imaging analysis, and object classification.
On the outset, segmentation algorithms were implemented using grayscale information only (see [2] for a comprehensive survey). The advancement in color technology facilitated the achievement of meaningful segmentation of images as described in [3, 4]. The use
Manuscript received January 14, 2009; revised June 15, 2009; accepted July 23, 2009.
of color information can significantly improve discrimination and recognition capability over graylevel methods. However, early procedures consisted of clustering pixels by utilizing only color similarity. Spatial locations and correlations of pixels were not taken into account yielding, fragmented regions throughout the image. Statistical methods, such as Classical Bayes decision theory, which are based on previous observation have also been quite popular[5,6]. However, these methods depend on global a priori knowledge about the image content and organization. Until recently, very little work had used underlying physical models of the color image formation process in developing color difference metrics.
By regarding the image segmentation as a problem of partitioning pixels into different clusters according to their color similarity and spatial relation, we propose our color image segmentation method automatically. (1) Selects seeds region for image using block-based region growing and perceptual color vision model in the CIE L*a*b* color space; (2) Generates a final segmentation by utilizing an effective merging procedure using fuzzy algorithm and color-edge detection. Our procedure first partitions the original image into non-overlapping range blocks, calculate mean and variance of range blocks, sub-block in a color image will be grouped into different clusters, and each detected receive a label, with the same label is referred as a seed region grow into the higher seed regions areas. The seeds that have similar values of color and texture are consequently merged using fuzzy algorithm and color-edge detection to obtain a final segmentation map. The algorithm takes into account the fact that segmentation is a low-level procedure and as such, it should not require a large amount of computational complexity. Our algorithm is compiled in a MATLAB environment and tested over a large database (~100 images) of highly diverse images. The results indicate that our proposed methodology performs favorably against the currently available benchmarks.
The remainder of the paper is organized as follows. In section II, a review of the necessary background required to effectively implement our algorithm is presented. The proposed algorithm is described in Section Ш. After that, application of the proposed algorithm is discussed in section ^, and we draw our conclusion in the last section.
-
II. BACKGROUND
are obtained by setting R = G = B = 100 in equation
q e
X Y Z 1 )
.
X7 ’ Y T ’ Z T J J
-
A. color space conversion
The choice of the color space can be a very important decision which can dramatically influence the results of the segmentation. Many images are stored with RGB format, so it is easier for the subsequent of the RGB color space is used. The main disadvantage of the RGB color space in applications with natural images is a high correlation between its components: about 0.78 for r BR (cross correlation between the B and R channel), 0.98 for r RG and 0.94 for r GB [7] . It makes the choice of the RGB threshold very difficult. Another problem is the perceptual non-uniformity, such as the low correlation between the perceived difference of two colors and the Euclidian distance in the RGB space. In this paper, we choose CIE L*a*b* color space to work on due to its three major properties:
-
(1) Separation of achromatic information from chromatic information; (2) uniform color space, and (3) similar to human visual perception [8].
The definition of CIE L*a*b* is based on nonlinearly-compressed CIE XYZ color space coordinates, which is derived from RGB as follows equation (1):
-
B. Visible color difference
Recent researches indicate that most of color image segmentation algorithms are very sensitive to color difference calculation or color similarity measure[9]. It is safe to say that the accuracy of color difference calculation determines the performance of various color image segmentation approaches.
The perceptual difference between any two colors can be ideally represented as the Euclidean distance between their coordinates in the CIE L*a*b* color space, and are considered perceptually distinguishable[10].
In CIE L*a*b* color space, the L * is brightness degree in meter system, and a*, b* is color degree in meter system. Thus, the brightness degree difference ***
between ( L 1 , a 1 , b 1 ) and ( L 2 , a 2 , b 2 ) is
V L = L* - L2
The difference of chroma is
22 22
V C = v a 1 + b 1 - \a 2 + b 2 difference of hue
V H * = tan-1
*
b4-
V a 1J
tan
*
b2V a 2 J
.
and the is
|
X |
2.7689 |
1.7517 |
1.1302 |
R |
|
|
Y |
= |
1.0000 |
4.5907 |
0.0601 |
G |
|
. Z _ |
0.0000 |
0.0565 |
5.5943 |
_ B _ |
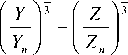
Based on this definition, L*a*b* is defined as
Overall Colour difference can be expressed by the geometry distance of space:
***
V E * = ( X L ) 2 + ( X C ) 2 + (ZH_)2 (4)
K L S L K C S C K H S H
follows:
L * = 116 f — J 3 -16
n J f X )3 f Y )3 V X n J V Y J
• a * =500
b * = 200
Where
f ( q ) = •
q /3 , if q > 0.008856
7.787 q + 16116 , otherwise
( X n , Yn , Z n ) represents a reference white as
defined by a CIE standard illuminant, in this case, and
The parametric factors K L , K C and K H are set for correcting the variations contributed from experimental or background conditions. To compute the CIE94 color difference V E 94 , the following parameter valves are set for V E * in (4):
KL = Kc = KH = 1, SL = 1
LC H L
SC = 1 + 0.045C ,SH = 1 + 0.015C
V L > 0 , it shows the sample color is paler and higher in brightness compared the standard color. Contrarily it is low.
V C * > 0 , it shows the sample color is partial red compared the standard color. Contrarily it is partial green.
V H * > 0 , it shows the sample color is partial yellow compared the standard color. Contrarily it is partial blue.
The unit of chromatism is NBS (the abbreviation of National Bureau of Standards, then it has a NBS chromatism unit when V E = 1). A 24-bit color image contains up to 16 million colors. Most of the colors can not be differentiated by human beings, because human
eyes are relatively less sensitive to colors. Y.H.Gong’s [11] research show there is close relation between the human color perception and the NBS color distance, The NBS color distance is devised through a number of subjective color evaluation experiments to better approximate human color perception, which is shown in table.1. Moreover, the values of E* ab can be roughly classified into four different levels to reflect the degrees of color difference perceived by human. The color difference is hardly perceptible when E* ab is smaller than 3.0; is perceptible but still tolerable when E* ab between 3.0 and 6.0; and is usually not acceptable when E*ab is larger than 6.0. Hence, in this paper, we define a color difference to be “visible” if its E*ab value is larger than 6.0.
T able .1 THE CORRESPONDENCE BETWEEN THE HUMAN
COLOR PERCEPTION AND THE NBS units
|
NBS unit |
Human perception |
|
<3.0 |
Slightly different |
|
3.0 - 6.0 |
Remarkably different But acceptable |
|
6.0 - 12.0 |
very different |
|
12.0 - |
Different color |
C. Color Gradient:boundary edge
The color gradient is used for a gradual blend of color which can be considered as an even gradation from low to high values. Mathematically, the gradient of a two-variable function (here the image intensity function) is at each image point a 2D vector with the components given by the derivatives in the horizontal and vertical directions. At each image point, the gradient vector points in the direction of largest possible intensity increase, and the length of the gradient vector corresponds to the rate of change in that direction.
Wesolkowski compared several edge detectors in multiple color space, and he draw the conclusion that the performance of Sobel operator is superior to others[12]. So Sobel operator is used in this paper, Figure.1 shows the proposed boundary Sobel operator masks: (a) horizontal mask and (b) vertical mask. To construct a color contrast gradient, the eight neighbors of each pixel are searched to calculate the difference of lightness and the color-opponent dimensions with each neighbor pixel. Here the color difference replaces the color contrast gradient, and V E denotes the color difference between two pixels, which is determined by equation (4). Let V x , V y denotes the gradient along x and y direction respectively. And the 3*3 mask is showed in Figure.2.
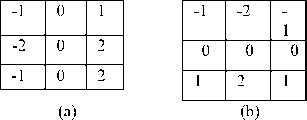
Figure.1 Boundary Sobel operator masks:
(a) horizontal mask, (b) vertical mask
|
a 1 |
a 2 |
a 3 |
|
a 4 |
( x , y ) |
a 5 |
|
a 6 |
a 7 |
a 8 |
Figure.2 3 X 3 neighborhood region
vx = ( a 6 + 2 a 7 + a8 )-(al + 2 a 2 + a3 )= VE (a 6, a1) + 2VE (a 7, a 2 ) + VE (a8, a 3)
v = (a3 + 2 a 5 + a 8) - (a1 + 2 a 4 + a6)
y 3 5 8 1 4 6 (7)
= V E (a 3, a1) + 2 VE (a 5, a 4) + VE (a8, a 6)
Then the magnitude of the Sobel operator can be calculated as follows:
G = ^vx2 + Vy2 (8)
As Based upon this definition of color contrast gradient, it is possible to build up the following color edge detection application.
The conventional region-edge integrating algorithm stores the edge information on the pixel itself. When there are different regions on both sides of a certain edge, however, it is necessary to decide which region the edge pixel itself belongs to, and this makes the algorithm cumbersome. In this paper, we propose to store the edge information not on a pixel itself but on a boundary between pixels[13,14]. We define the boundary pixel as the pixel that virtually exists between two real pixels and that has an infinitesimal width. The advantages of using the boundary pixels to keep the edge information, which we call the boundary edge, are as follows: (1) the control of region growth becomes easier and (2) the whole algorithm becomes simpler. In this paper set the threshold T to filter the low gradient and only store the boundary pixel with high gradient.
-
III. proposed algorithm
Figure.3 has shown the architecture of the proposed algorithm. Firstly, an input color image is conversed from RGB color space into CIEL*a*b* color space, and choose a block size n x n. The block size should be just small enough that the eye will average color over the block. Divide the input image into small and nonoverlapping rectangular block, calculate mean and variance of range blocks, we need to construct a suitable method to display the data in order to investigate relationships of the regions. The data can be modeled using an (N, P) matrix, where N is the total number of blocks in the image, and P is the total number of variables that contain information about each block. The range blocks can classify two different blocks, we apply region growing and visible color difference to obtain initial seed regions. Thirdly, the color sobel detector is used to detect the texture blocks, using the acquired
Lab data, the magnitude of the gradient G ( i , j ) of the
xi
1 n * n
nn i =1 j =1
x ij
color image field is calculated. Fourthly, the initial seed regions are hierarchically merged based on the color spatial and adjacent information; the segmented color image is outputted at last. The rest parts of this section will discuss the details.
Input Image
(R,G,B)
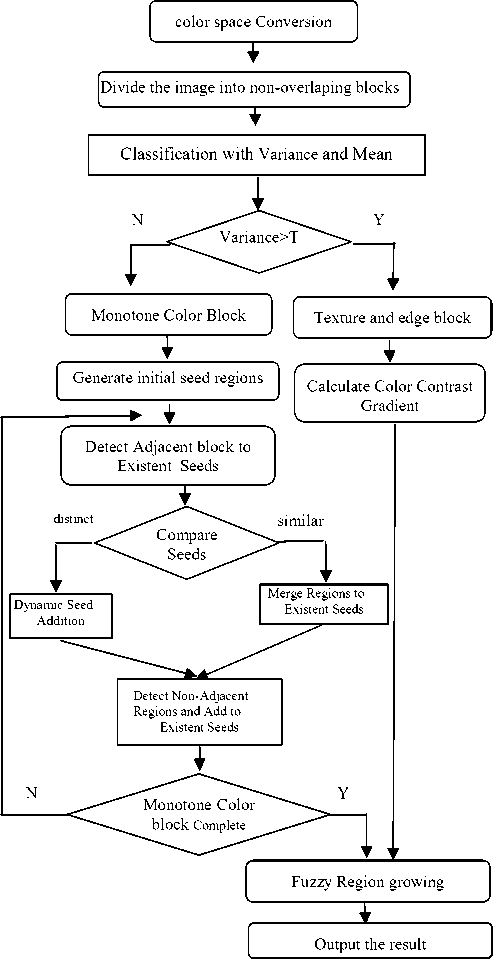
Figure.3 The architecture of the algorithm
-
A. C LASSIFICATION WITH V ARIANCE AND M EAN
In this paper, the block variance and mean are the methods to classify. Blocks variance is usually used to classify the simplicity or complexity for each block. The average color value ( l , a , b ) of block is defined as:
The variance variance value ( vl , va , vb ) of block is defined as follows:
nn
-
5, =----- У У ( Х„ - x, ) x n * n £ ^l j
Where n is the size of the block and
( * * X *V . - . , , ~ -
L , a , b )) is the pixel value of the range blocks.
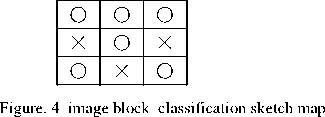
The image blocks are classified into two different groups according to variance difference: one is monotone color block; the other is texture and edge block there is a variety of color. The variance value of monotone color block is very small, same time texture block is very big because of the edge, the variance value can set the threshold T to distinguish between two different types of image block, the value 0.05 is selected as the threshold based on our experiments, if a higher value is used, a smaller number of pixels will be classified as homogenous color blocks and some objects may be missed; oppositely, a higher number of pixels will be classified as texture block and different regions may be connected. Figure.4 has show the image block classification sketch map.
-
B. I NITIAL S EED R EGIONS G ENERATATION
After the segmentation of block partitioning, there will be a problem of over-segmentation. Those small over segmented regions should be merged into a large region to get the initial seed regions, to satisfy the need of image analysis and other follow-up treatment. The initial seed regions are generated by detecting all monotone color block in the image. In order to prevent multiple seed generation within monotone and connected image blocks, the first requirement is to enforce that seeds region be larger than 0.25% of the image. The reason of this rule is that the tiny region often is blotted region. The second requirement is to enforce the color different distance V E ij >6.0 any of seed regions. It is briefly described as follows:
-
1) Select monotone color block within the image;
-
2) Detect adjacent monotone color block, calculate the color different distance between candidate and its nearest neighbor seed region, if V E ij <6.0, merge regions to existent seed region, else add a new seed region.
-
3) Detect non-adjacent monotone color blocks, calculate the color different distance between candidate and its nearest neighbor seed region, if V E ij <6.0, merge
regions to existent seed region, else add a new seed region.
-
4) Scan the runs, and assign preliminary labels and recording label equivalences in a local equivalence table.
After previously processed, there are totally m different color seed regions { 5 1 , 5 2 , 5 3 ... s m } , they corresponding n homogeneous color regions, a color set may remark one or more color blocks that aren’t adjacent in spatial location, label the homogeneous color blocks with its own sequence number to declare the initial seed regions, record as { B 1 B 2 , L B n } .
-
C. Fuzzy region-Growing Algorithm
The number and the interior of the regions are defined after marker extraction. However a lot of undecided pixels are not assigned to any region. Most of them are located around the contours of the regions. Assigning these pixels to a given region can be considered as decision process that precisely defines the partition. The segmentation procedure in the present investigation is a fuzzy region-growing algorithm that is based on a fuzzy rule. Our final objective is to split an original image I into a number of homogeneous but disjoint regions R j by one-pixel width contours:
n
I = URj, RIRk = ф j* k (10) j=1
The region growing is essentially a grouping procedure that groups pixels or sub regions into larger regions in which the homogeneity criterion holds. Sarting from a single seed region, a segmented region is created by merging the neighboring pixels or the adjacent regions around a current pixel. The operations are repeatedly performed until there is no pixel that does not belong to a certain region.
Since our strategy in segmenting natural color images is an effective combination of an accurate segmentation by the color difference and the color gradient, and a rough segmentation by the local fractal dimension feature, it is inevitable to employ a technique for information integration. We adopt fuzzy rules to integrate the different features. We use the following criteria where each fuzzy rule has a corresponding membership function.
[Rule 1] the first image feature is the color difference between the average value g ave (R k ) of a region and the value of a pixel g(i,j) under investigation:
VE = |gave (Rk )- g(i, j) (11)
The corresponding fuzzy rule for fuzzy set SMALL is R1: If color difference is small then probably merge else probably not merge.
[Rule 2] The second intensity feature is the color contrast gradient, or the value of the boundary edges between the pixel and its adjacent region. A new pixel may be merged into a region if the gradient is low. If the gradient is high, the pixel will not be merged. We employ the boundary Sobel operator to calculate the color gradient and to achieve an accurate segmentation at the strong-edge regions. The boundary edges effectively protect the unnecessary growth of regions around the edges. The fuzzy rule for fuzzy set LOW becomes:
R2: If gradient is low then probably merge else probably not merge.
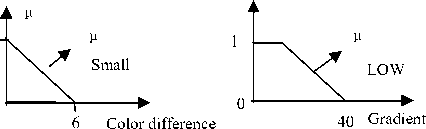
Figure. 4 The membership functions for fuzzy rules
1.0
μ (m)
0.5
1.0
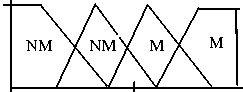
Figure.5 The fuzzy sets used for interface
m
Figure.4 shows the two membership functions corresponding to each fuzzy rule. After the fuzzification by the above two rules, min-max inference takes place using the fuzzy sets shown in Figure.5. Then the conventional centroid defuzzification method is applied. A pixel is applied. A pixel is really merged when the homogeneity criterion is satisfied to an extent of 50% after defuzzification.
The fuzzy region growing processing is briefly described as follows:
-
1) For one of the initial seed regions { B 1 B 2, L Bm } , first from the upper left corner of the adjacent texture blocks, seeked the pixels that has the same color and features, and merged them into the seek region. When the adjacent sub-block has been accepted, the seed region grows as a new seed region, updated the new seed region’s features. Repeated the process until the near of sub-blocks have not acceptable, the suspension of the process of growth.
-
2) Repeat (1) until all seed regions growing are accomplished.
-
D. Merge Small Regions
Though over-segmentation problem is diminished through above procedures, in most case a further process of eliminating the small regions is still required to produce the more clear objects or homogenous regions. In our algorithm, those small regions occur often along the contour of objects or inside a complex region due to compound texture. Thus, the merger of the region aimed at the effective removal of noise and image detail will be merged into the connected area.
The merged processing is given as follows.
-
1) The tiny region is regarded as bloted region and to be filtered;
-
2) The other fragmented region is merged base on the spatial location relation with the adjacent region.
(c)
(d)
The relation of spatial location between objects is given as follows. If an object were entirely surrounded by another object, or at least three directions, as shown in figure.6 and figure.7, that belongs to an interior object, we merged it into peripheral region. If the target is not surrounded by the other object, as shown in Figure.8, it was regarded as a border and merged with the conditions of edge.
|
1 |
1 |
1 |
1 |
1 |
|
1 |
1 |
2 |
1 |
1 |
|
1 |
1 |
2 |
2 |
1 |
|
1 |
2 |
2 |
1 |
1 |
|
1 |
1 |
1 |
1 |
1 |
Figure.6 An object was entirely surrounded by another object
|
1 |
1 |
1 |
1 |
2 |
|
1 |
1 |
2 |
1 |
2 |
|
1 |
1 |
2 |
2 |
2 |
|
1 |
2 |
2 |
1 |
2 |
|
1 |
1 |
1 |
1 |
2 |
Figure. 7 An object was surrounded by another object from three directions
|
1 |
1 |
3 |
3 |
3 |
|
1 |
1 |
2 |
3 |
3 |
|
1 |
1 |
2 |
2 |
3 |
|
1 |
2 |
2 |
3 |
3 |
|
1 |
1 |
1 |
3 |
3 |
Figure.8 A small object located in two objects
(e)
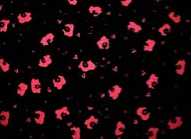
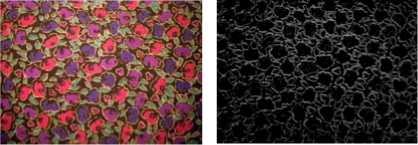
Figure 9. fabric image segmentation experimental results
Finally, if the number of pixels in a region is lower than a given smallest-region threshold that is determined by the size of image, we will merge this region into its neighborhood with the smallest color difference.
(a) Original image (b) color contrast gradient
(c) Green object (d) Purple object
This rule is the last step in our segmentation algorithm. Based on our experiments, we select 1/150 of the total number of pixels of the given color image as the threshold. This procedure repeats until no region has size less than the threshold. Finally, a segmented image is produced.
(a) (b)
(c)
(d)
-
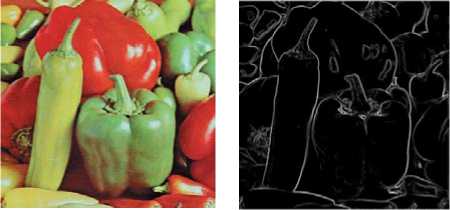
IV. Experiment simulation and result analysis
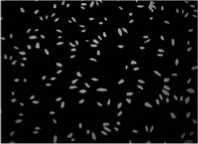
To verify the performance of the proposed segmentation algorithm, we experiment with color remote sensing images and natural images. We show results of some of these experiments. Figure.9 and Figure.10 show some typical results of our color image segmentation algorithm.
In fact, we can compare our algorithm and traditional SRG algorithm here. Our method use region rather than pixel as initial seeds. In this sense, high-level knowledge of the image partitions can be exploited through the choice of the seeds much better because region has more information compared to pixels.
(a)
(b)
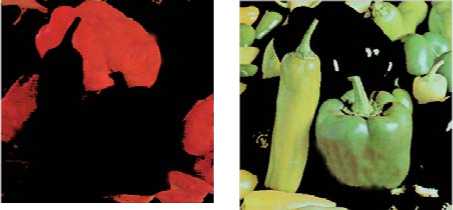
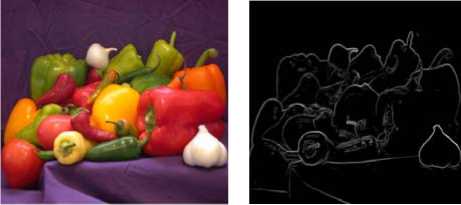
Figure 10. capsicum image segmentation experimental results
(a) Original image (b) color contrast gradient
(c) Red capsicum (d) Green capsicum
(a) (b)
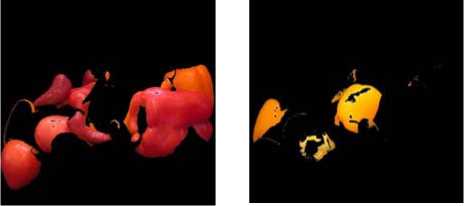
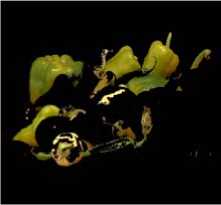
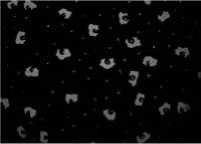
Figure 11. capsicum image segmentation experimental results
(a) Original image (b) color contrast gradient
(c) Red capsicum (d) yellow capsicum (e)green capsicum
-
V. Conclusion
This work presents a computationally efficient method designed for automatic segmentation of color images with varied complexities. Firstly, the original image is divide into rectangular image blocks which are not overlapped; then, the mean and variance of each image black was calculated in CIE L*a*b* color space, and the image blocks were divided into homogeneous color blocks and texture blocks by the variance of it. The Initial seed regions are automatically selected depending on calculating the homogeneous color blocks’ color difference in CIE L*a*b* color space and spatial and adjacent information. The color contrast gradient of the texture blocks need to calculate and the information of boundary pixels are storage. Finally, the region growing and merging algorithm was to use and achieve the segmentation result.
The meaningful experiment results of color image segmentation hold favorable consistency in terms of human perception and satisfy the content-based image retrieval and recognition process. There are mainly two disadvantages in our algorithm. First, although using the fixed threshold values can produce reasonably good results, it may not generate the best results for all the images. Second, when an image is highly color textured (i.e. there are numerous tiny objects with mixed colors), our algorithm may fail to obtain satisfied results because the mean value and variance could not represent the property of the region well. How to combine other properties such as texture into the algorithm to improve segmentation performance is the point of our further research.
Acknowledgment
This paper is fully supported by the National Science and Technology Infrastructure Program of China (No.13001790200701).
References Automatic Image Segmentation Base on Human Color Perceptions
- ZHANG YU-JIN. Image project(media), image analysis. Beijing. Tsinghua University Press, 2005
- H. Cheng, X. Jiang, Y. Sun and J. Wang, Color image segmentation: Advances & prospects, Pat. Rec., Vol. 34, No. 12, pp. 2259-2281, Dec. 2001.
- J. Wu, H. Yan, and A. Chalmers, “Color image segmentation using fuzzy clustering and supervised learning”, Journal of Elec. Imag., Vol. 3, No. 4, pp. 397–403, Oct. 1994.
- P. Schmid, Segmentation of digitized dermatoscopic images by two-dimensional color clustering, IEEE Trans. on Med. Image., Vol. 18, No.2, pp. 164–171, Feb. 1999.
- Daily, M.J., J.G. Harris, K.E. Olin, K. Reiser, D.Y. Tseng, and F.M. Vilnrotter, Knowledge-based Vision Techniques Annual Technical Report. U.S. Army ETL, Fort Belvoir, VA, October, 1987.
- Healey, G. and T. Binford, The Role and Use of Color in a General Vision System. Proc. of the DARPA IU Workshop, Los Angeles, CA, pp. 599-613, February, 1987.
- GONG Sheng-rong, Digital image processing and analysis. Beijing. Tsinghua Unversity Press, 2005
- G.Wyszecki and W.Stiles, Color Science: Concepts and Metheds, Quantitative Data and Formulae, 2nd ed. New York: Wiley, 1982.
- H.D. Cheng, X.H. Jiang, Y. Sun, et al. “Color image segmentation: advances and prospects”. Pattern Recognition, 2001, pp. 2259- 2281
- Qi Yonghong and Zhou Shshenqi, “Review on Uniform color space and Color Difference Formula”, Print World, 2003.9:16-19.
- Gong Y.H, Proietti G. Image indexing and retrieval based on human perceptual color clustering. The international conference on computer vision, Munbai, 1998
- S. Wesolkowski, M.E. Jernigan, R.D. Dony, “Comparison of color image edge detectors in multiple color space”. ICIP-2000, pp. 796 – 799
- J. Maeda, V.V.Anh,T.Ishizaka and y. suzuki, “ Integration of local fractal dimension and boundary edge in segmenting natural images” , Proc. IEEE Int. Conf. on Image Processing, vol.I, pp.845-848, 1996.
- J. Maeda, T. Lizawa, T. Ishizaka, C. Ishikawa and Y. Suzuki, “Segmentation diffusion and linking of boundary edges”, Pattern Recognition, vol.31(12), pp.1993-1999, 1998.
- Ye Qixiang, Gao Wen, Wang Weiqiang, Hang Tiejun. “A Color Image Segmentation Algorithm by Using Color and Spatial Information”. Journal of Software. 2004, 15(4):522-530.
- Hsin-Chia Chen, Sheng-Jyh Wang. “The use of visible color difference in the quantitative evaluation of color image segmentation”. Vision, image and signal processing, IEEE proceedings. 2006, Vol.153, pp.598 - 609.
