Automatic Recognition and Counterfeit Detection of Ethiopian Paper Currency

Author: Jegnaw Fentahun Zeggeye, Yaregal Assabie
Journal: International Journal of Image, Graphics and Signal Processing(IJIGSP) @ijigsp
Article in issue: 2 vol.8, 2016.
Free access
Currency recognition is a technology used to identify currencies of various countries. The use of automatic methods of currency recognition has been increasing due its importance in many sectors such as vending machine, railway ticket counter, banking system, shopping mall, currency exchange service, etc. This paper describes the design of automatic recognition of Ethiopian currency. In this work, we propose hardware and software solutions which take images of an Ethiopian currency from a scanner and camera as an input. We combined characteristic features of currency and local feature descriptors to design a four level classifier. The design has a categorization component, which is responsible to denominate the currency notes into their respective denomination and verification component which is responsible to validate whether the currency is genuine or not. The system is tested using genuine Ethiopian currencies, counterfeit Ethiopian currencies and other countries' currencies. The denomination accuracy for genuine Ethiopian currency, counterfeit currencies and other countries' currencies is found to be 90.42%, 83.3% and 100% respectively. The verification accuracy of our system is 96.13%.
Ethiopian Currency, Currency Recognition, Counterfeit Detection
Short address: https://sciup.org/15013949
IDR: 15013949
Text of the scientific article Automatic Recognition and Counterfeit Detection of Ethiopian Paper Currency
Published Online February 2016 in MECS
Currency is used almost everywhere in the world to facilitate business. Although electronic commerce is emerging as an alternative means of making business without the use of paper currency, it is still an indispensable part of everyone’s daily routine. There are various currencies all over the world, and each of them looks totally different and unique. This difference can be due to the size of the paper currency, or color or pattern drawn on the paper. Manual identification and counterfeit detection of currencies a difficult task requiring specially trained examiners which requires human labor and time. Since currency has great importance in facilitating the management of the economy of countries at large, automatic recognition of currency becomes a great area of interest for researchers and developers [17]. Currency recognition is an image processing technology that is used to identify currency of various countries. In general, currency recognition systems usually have four major processes: image acquisition, preprocessing, feature extraction and classification [1, 4, 19, 21]. Image acquisition is an activity of acquiring the currency image in a digital form using a specific hardware designed for this purpose, usually scanner or camera. Image acquisition is followed by preprocessing which is required to improve the currency image by suppressing unnecessary distortions or enhancing major image features important for further recognition processes. Feature extraction is a type of dimensionality reduction that efficiently represents interesting parts of the currency image as a compact feature vector. The types of features used for recognition purpose play crucial role in currency recognition systems. There are mainly two types of features: structural feature and statistical feature. Structural feature describes geometrical and topological characteristics of pattern by representing its global and local properties whereas statistical feature describes characteristic measurements of the pattern. Some of the features commonly used for currency recognition are Scale-Invariant Feature Transform, Binary Robust Invariant Scalable Key points, Speeded Up Robust Feature, etc. [3, 7, 11, 16, 22]. Classification is the final phase of the currecny recognition process where the decision about a given currency image is made based on the extracted feature sets. The decision could be rejection or identification of the currency image into one of the valid banknotes of a given country.
The aim of currency recognition system is to help machines recognize different currencies and to help people work with convenience and efficiency. An efficient currency recognition system is vital for automation in many sectors such as vending machine, railway ticket counter, banking system, shopping mall, currency exchange service, etc. Automatic machines capable of recognizing banknotes are currently used in the developed part of the world in automatic dispensers of a number of different products ranging from cigarettes to bus tickets, as well as in many automatic banking operations [5, 13, 17]. Some other countries have been attempting to develop systems that recognize their respective currencies
[9, 10, 12, 14, 15, 18]. To the best of our knowledge, however, there is no research and development work focused on recognition of Ethiopian paper currency which is known as Birr. Thus, the purpose of this work is to design and develop a system that can identify Ethiopian paper currency and categorize them in their denominations. In addition, the proposed solution identifies counterfeit currency from genuine Ethiopian currencies. The study considers banknotes that are currently functional, i.e., 1 Birr, 5 Birr, 10 Birr, 50 Birr and 100 Birr.
The remaining part of this paper is organized as follows. Section II discusses related works. In Section III, we present the proposed Ethiopian currency recognition system. Experimental results are reported in Section IV. Section V presents conclusion and future works.
-
II. Related Work
The recognition of banknotes has been addressed in several ways depending on their types. Accordingly, various methods have been proposed for recognition of different banknotes. The commonly used methods include artificial neural network, currency characteristic comparison, principal component analysis, local feature descriptors comparison, hidden Markov models, Naïve Bayes classifier, etc. The selection of methods applied to recognize currencies depends on the characteristic features of the currencies.
Debnath et al. [6] used ensemble neural network to recognize Bangladeshi currency where individual neural networks in an ensemble neural network are trained via negative correlation learning (NCL). NCL is used to expertise the individuals on different parts or portion of input patterns in an ensemble. The input patterns used in this work are grayscale values of the currency image. The decision of ensemble is computed using voting scheme where each network gives a vote for a certain class and classification is done by the winning neuron of that network. The authors reported that they obtained promising results even for noisy Bangladeshi currency images.
Colors and texture features have been exploited for recognition of banknotes. García-Lamont et al. [7] employ a method to recognize Mexican banknotes by using artificial vision, where the color and texture features of the banknotes are extracted to classify them. The color and texture features are extracted with the RGB space and the Local Binary Patterns, respectively. The authors report high denomination accuracies due to the fact Mexico, like many other countries, employs colors to recognize the denominations of the banknotes. Similarly, Yan et al. [19] use color and texture features for recognition of US banknotes in which the features are further processed and classified by a Feed-forward Neural Network (FNN). The output of the system is a measurement of the similarity between existing samples and test banknote.
Principal Component Analysis (PCA) is employed by Ahmadi et al. [1] for increasing the reliability of banknote recognition machines. They define a method for validating the reliability where they examine six different bill types of US Dollars. The PCA algorithm is used to extract the main features of US banknotes and to reduce the size of data. Linear Vector Quantization (LVQ) network is applied for classification purpose. On the other hand, Kagehiro et al. [13] take a number of discrete points selected from the entire image where the average of the pixel at each point and its adjacent pixels is taken as the observed value for each point. Then, the distance between a template vectors and the feature vectors from the observation points is used for classification. The authors reported very low errors rates with high-speed processing.
Aoba et al. [2] propose two types of neural networks for recognition of Euro banknotes: a three-layered perceptron and several Radial Basis Function (RBF) networks. They employ three-layered perceptron for classification of banknotes whereas RBF network is used to reject invalid data by estimating the probability distribution of the sample data. Since Euro banknotes have characteristic features in IR images, the system uses infra-red (IR) and visible images as input data.
Verma et al. [18] propose an Indian currency recognition system based on the intrinsic feature of the currency. The texture of the currency is extracted as intrinsic features fur currency recognition, and the class discriminating capability of these features for Indian currency is evaluated. On the other hand, Gogoi et al. [9] classify Indian currency based on a set of unique features such as color, dimension and identification mark. Since each banknote has unique shape as identification mark, Fourier descriptor is used to extract the features. The, classification is made using artificial neural networks.
Liu et al. [15] develop real-time Chinese currency recognition system using a combination of Haar wavelets and Support Vector Machine. The idea of this method is to extract the waveform features and transform them to the Support Vectors with fixed length. The waveform of a banknote is a periodic signal that contains many features and details with varying scales. The Haar features are classified by making use of Support Vector Machine. The authors reported that the recognition system is fast and robust with high accuracy. Multiple-kernel Support Vector Machines is also used to successfully detect counterfeit Taiwanese banknotes by minimizing false recognition rates [20]. In this method, each banknote is divided into partitions and each partition is associated with its own kernels. Then, the luminance histograms of the partitions are taken as the input of the system.
The reviewed papers present different methods to recognize banknotes and/or detect counterfeits. It can be seen that the banknotes of various countries have characteristic features on which recognition systems rely. Accordingly, different classifiers are proposed based on the types of features and the complexity of the problem. Due to such feature variations, none of the methods guarantee us to work effectively across all currencies. Thus, in this paper, we propose four different features (based on color and characteristic features) for recognition and counterfeit detection of Ethiopian banknotes.
-
III. The Proposed System
-
A. s ystem a rchitecture
We propose hardware and software solutions for recognition of Ethiopian paper currency. The Ethiopian paper currency recognition system consists of three major components: currency image acquisition , currency denomination and currency verification . Currency image acquisition is required to capture the images of the currency using scanner and camera. Currency denomination component is responsible for classifying the paper currency into the respective denomination based on the image of the currency captured by scanner whereas currency verification checks whether specific paper currency is genuine or counterfeit based on the image of currency captured by a camera. Currency image acquisition attributes hardware solution to the problem as we use this component to attenuate characteristic features of Ethiopian banknotes by making use of scanner and camera. On the other hand, currency denomination and verification components are software solutions to the problem. The architecture of the proposed Ethiopian paper currency recognition system is shown in Fig. 1.
Currency Image Acquisition
Camera
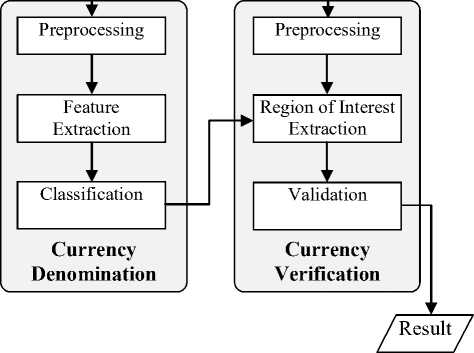
Fig.1. Architecture of the proposed system.
-
B. c urrency i mage a cquistion
The image acquisition component is responsible for acquiring images of paper currencies. Each of the Ethiopian banknotes have distinctive range of colors, sizes, looks, marks, texts and other characteristics that make them unique for identification. Since these features are visible under normal light conditions, they can be captured by scanner. When seen against white light, Ethiopian banknotes are also characterized by having thin golden strip (for 5, 10, 50 and 100 Birr banknotes) and wide golden strip (for 50 and 100 Birr banknotes) bearing the name and sign of National Bank of Ethiopia in Amharic and in English. These features are used to manually check if the currencies are genuine and a digital camera captures such features. Thus, recognition of Ethiopian currencies requires scanner and camera as hardware solutions to capture characteristic features relevant for denomination and verification purposes, respectively. Images of genuine 100 Birr banknotes captured with camera and scanner are shown in Fig. 2.
Thin golden strip Wide golden strip
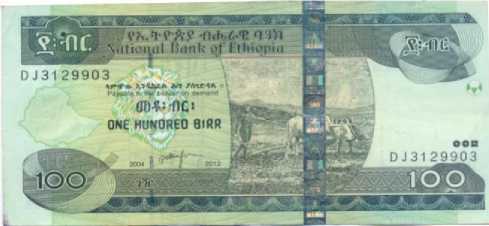
Fig.2. Banknote of 100 Birr captured with camera ( top ) and scanner ( bottom )
-
C. c urrency d enomination
The denomination of a given test image into one of the five Ethiopian banknotes (1, 5, 10, 50 and 100 Birr) is achieved by preprocessing the image, extracting characteristic features from the image and classifying the input image based on the features. Classification is made by comparing the features of input image against standard sample images of banknotes stored as a database.
-
a) Preprocessing
In the preprocessing sub-component, we apply image re-sizing and enhancement with the purpose of preparing the paper currency image to the main image processing activities. All the five Ethiopian banknotes have different sizes. However, size is not used as a feature for classification in the proposed design and the size of the image needs to be similar for comparing the correlation coefficients of the color components among different banknotes. Accordingly, the images of the banknotes are brought to a common size. On the other hand, the quality of the images is degraded for old banknotes. To enhance the quality of such input images, we filter them using a Gaussian filter of window 3x3.
-
b) Feature Extraction and Classification
Feature extraction and classification are the main parts of currency denomination component. Four different feature sets are selected for the classification of the banknotes. These feature sets are dominant color of the image , the distribution of the dominant color , the hue value of the image and Speeded Up Robust Feature (SURF) of the banknotes. Based on these features, the classification of input images into their respective denomination is carried out. The classification process is applied after each feature is extracted. Because of this, the classifier is called a four level classifier. At each stage, a currency image can be a candidate to be classified into one of the five Ethiopian banknotes but needs to pass through the four phases as discussed below.
Phase 1 (Dominant color) : The image is acquired in RGB format and it has three major components; Red (R), Green (G) and Blue (B). The composition of these three components gives the specific color of the currency image [8]. In each image either red or green or blue is the dominating color, i.e., the maximum pixel occupancy in the image. The five Ethiopian banknotes have distinct colors for human vision system. Each color of the banknotes is different because the combination of the primary colors (Red, Green and Blue) is different in each currency. In addition to this, one of the three primary colors has greater pixel occupancy in the image. To find the maximum pixel occupancy, the respective color components of the pixels are added for the entire image, which will give three results in accordance with the three primary colors. Among the three results, the one with maximum pixel sum is considered to be the dominant. We empirically made dominant color analysis on samples of Ethiopian banknotes and it was revealed that:
-
• Red is dominant color for 1 Birr, 10 Birr and 50 Birr;
-
• Green is dominant color for 5 Birr and 100 Birr; and • Blue is dominant color for 5 Birr.
Accordingly, the input image is classified based on the analysis of the dominant color observed in the image. At this level we are still classifying the input image into intermediate results and a final decision is yet to be made after passing through the remaining phases.
Phase 2 (Distribution of dominant color) : The distribution of the dominant color of the input image needs to be compared with the corresponding dominant colors of candidate banknotes identified in Phase 1. This is achieved by computing the correlation coefficient (CC) of the corresponding color values. For example, if the dominant color of the image is red, then we compute the correlation between red component of the input image and the red components of 1 Birr, 10 Birr and 50 Birr, separately. Table 1 shows the dominant color correlations to be computed between input image and the standard sample banknotes.
Table 1. Correlation Between Input And Standard Images
|
Correlation |
Standard currency images |
|||||||||||||||
|
1 Birr |
5 Birr |
10 Birr |
50 Birr |
100 Birr |
||||||||||||
|
R |
G |
B |
R |
G |
B |
R |
G |
B |
R |
G |
B |
R |
G |
B |
||
|
"o S1 “ S | 5 0 -3 q ‘o |
R |
x |
x |
x |
||||||||||||
|
G |
x |
x |
||||||||||||||
|
B |
x |
|||||||||||||||
The correlation coefficient ( CC B ) between the dominant color values of an image A and the corresponding color values of a candidate banknote B is computed as:
ZE ( A mn - A )( B mn — B ) (1) mn
B
JI EE (Amn - A )2 II EE (Bmn - B )2 I У V m n ) V m n / where m and n are pixel coordinates, Amn is the pixel value of the dominant color of the image, and A is mean of A. Empirically, it is found that new Ethiopian banknotes have correlation coefficient of more than 1.0 and degraded Ethiopian banknotes have more than 0.3. Therefore, to include degraded Ethiopian currencies a threshold value (T1) of0.3 was taken. In order for the test image to continue as a candidate into the respective class or denomination, the correlation coefficient needs to be greater than this threshold value. Otherwise, the input image would be considered as counterfeit or nonEthiopian banknote.
Phase 3 (Hue value): The HSV color model, also called HSB (Hue, Saturation, Brightness), defines a color space in terms of three constituent components: hue , saturation and value . Hue is the color type (such as red, magenta, blue, cyan, green or yellow); saturation refers to the intensity of specific hue; and value refers to the brightness of the color [8]. As hue varies from 0 to 1.0, the corresponding colors vary from red through yellow, green, cyan, blue, magenta, and back to red, so that there are actually red values both at 0 and 1.0. As saturation varies from 0 to 1.0, the corresponding colors (hues) vary from unsaturated (shades of grey) to fully saturated (no white component). As value, or brightness, varies from 0 to 1.0, the corresponding colors become increasingly brighter [8]. Among the three components, hue component is selected to compare the different currency images because the other two components could be easily affected by the currency degradation and light effect while the image is scanned or captured. In addition to that, each image has a specific hue value.
In the proposed system, the hue value of the test image is compared with each class of currency image’s hue value. Since the test image is classified in the second classification step, the denomination of the test image is known at this stage. Therefore, the hue value of the test image is compared against the hue value of a standard image of its class. Empirically, it is found that the hue difference (HD) of a genuine Ethiopian paper currency and the standard Ethiopian currency of its type is not more than 75. Therefore, a threshold value (T2) of 75 is used to continue analyzing the input image or reject as counterfeit. If the hue difference between the test image and the standard image is less than 75, that test image is still considered as a candidate of an Ethiopian currency in that specific denomination. Otherwise, it is considered as a counterfeit or non-Ethiopian paper currency.
Phase 4 (SURF matching): In this phase, the SURF features of the input image are extracted for a final decision making on the classes of denominations. The feature extraction and classification process is accomplished using the following five steps.
-
i. Finding the interest points or SURF points: We are required to compute interest points called SURF points. The SURF approximates the second order Gaussian derivate with box filters (mean or average filter), which is able to be calculated fast through integral images. The localization of interest point is determined by the determinant of Hessian matrix. So, interest points are finally localized in scale space and image space by using non-maximum suppression in their 3×3×3 neighborhood [3, 11]. Thousands of SURF
points are detected in each of the five banknotes.
-
ii. Selecting strongest points: The strongest points need to be selected to make the system computationally efficient. Constructing feature vectors and matching thousands of feature points is expensive. Thus, feature points having strong metric or more relevant features need to be selected. By taking the first 100 strongest points, we are able to detect some of the major features which can differentiate the five Ethiopian currencies. Among these features included in the first strongest points are letter and number denomination values written in English and Amharic, alphanumeric note number and currency identification sign for visual impaired people. Figure 3 shows 100 strongest SURF points detected for each Ethiopian banknote.
-
iii. Constructing feature vectors or descriptors: In this step, the feature vectors or descriptors from the selected strongest points are constructed and descriptors from a region around each interest point are extracted.
-
iv. Match features: After the feature vectors are constructed, the relatedness of the feature vector of an input currency image and a standard currency image of that specific denomination is checked. An indexed structure that contains matching features is built and stored for further processing.
-
v. Calculating match percentage: To calculate the match percentage, the matched points and the valid points in
either of the features are counted and the ratio of these two values is taken. An empirical analysis revealed that the match percent for genuine Ethiopian currencies is found to be more than 30. Accordingly, we set a threshold value (T3) of 30 for match percent (MP). Thus, if the match percent between an input image and a standard image of the same denomination is greater than 30, it is classified as an Ethiopian currency with the identified denomination. Otherwise, it is non-Ethiopian currency or counterfeit.
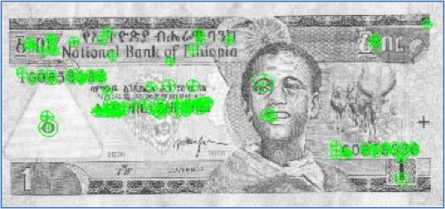
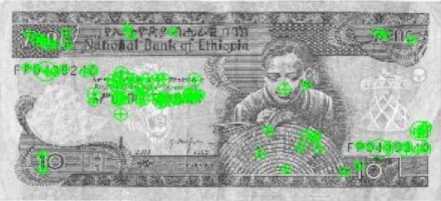
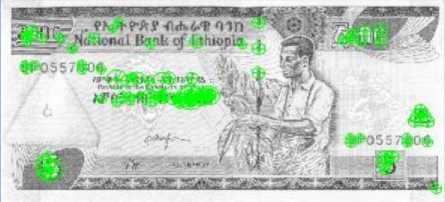
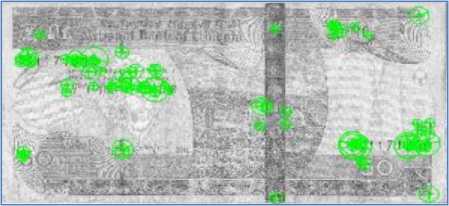
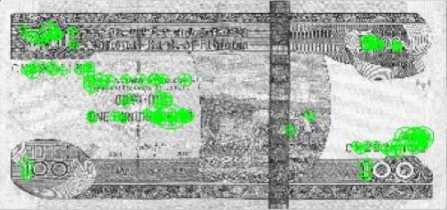
Fig.3. SURF points detected on Ethiopian banknotes ( from top to bottom : 1, 5, 10, 50 and 100 Birr.)
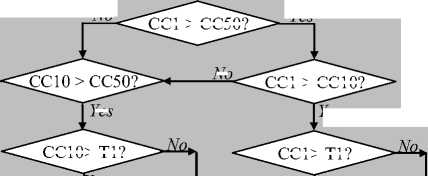
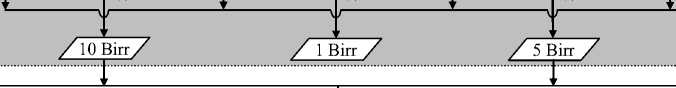
The four levels of feature extraction and classification processes of currency denomination component are illustrated in Fig. 4. Once the final decision is made on the denomination of a given input image, verification process will continue to check if the classified image is genuine or counterfeit.
-
D. c urrency v erification
The task of currency denomination component is to classify an input image into one of the five Ethiopian paper denominations. In this process, non-Ethiopian currencies or counterfeit banknotes with major deviation from genuine Ethiopian banknotes are rejected as counterfeits. However, it is likely that banknotes produced with the purpose of counterfeiting Ethiopian currencies will be classified into one of the five denominations. Thus, results of currency denomination component are further processed to check if the denomination is genuine or not. In Ethiopian paper currencies, there are few features that distinguish the genuine currency from the counterfeit. The
Preprocessed currency image
Key
Feature Extraction

Feature Extraction
Classification
Get Dominant Color

Feature Extraction
Get Correlation of R J I Get Correlation of B
I__
Get Correlation of G
Classification
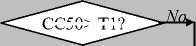
CC50> T1?
Yes
Yes
No
No
No
CC1 > CC10?
Yes
CC10> T1?
CC1> T1?
CC1 > CC50?
Yes
Yes
Yes
No CC100 > CC5?
CC5> T1?
Yes
CC100> T1?
Yes
Feature
Extraction
Get Hue Difference
Get Hue Difference
Get Hue Difference
Get Hue Difference
Get Hue Difference
Classification
HD< T2?
Yes
HD< T2?
Yes
HD< T2?
Yes
HD< T2?
Yes
HD< T2?
Yes
Feature
Extraction
SURF Matching
SURF Matching
SURF Matching
SURF Matching
SURF Matching
Classification
MP> T3?
Yes
/50 Birr 7
MP > T3?
MP> T3?
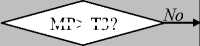
MP> T3?
No
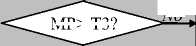
MP> T3?
Yes
2 100 Birr 7
Yes
Yes
Yes
To Currency Verification Component
Counterfeit
Fig.4. Flowchart of feature extraction and currency classification.
most outstanding feature in all denominations, except 1 Birr banknote, is the broken thin golden strip, which becomes solid line when it is seen from the direction of background light. In addition to this thin golden strip, in 50 Birr and 100 Birr, there is a wider golden strip which bears the name and sign of National Bank of Ethiopia in Amharic and in English. These characteristic features are captured by a digital camera which helps to apply verification of the classified banknotes. In addition to the preprocessing step, the verification component has two major processes: region of interest ( ROI ) extraction and validation . However, the techniques we apply on these processes differ due to the difference in the features of banknotes.
-
a) Verification by the Thin Strip
The thin golden strip exists in all Ethiopian banknotes, except 1 Birr banknote. The 1 Birr banknote is assumed to be genuine if it is correctly classified in the currency denomination component. For the rest of paper banknotes, ROI is now considered to be the thin golden strip. The localization of region of interest and validation processes are done using the following steps.
ROI localization : The position of the thin strip is not in a specific location for currencies in a specific denomination. Therefore, the existence of the thin strip is checked by taking a strip iteratively.
Binarization : For better processing, the RGB is converted to HSV color format. From the three HSV components, only saturation and value components are usually exposed to noise. And therefore binarization is applied on these two components of the image with 0.3 value and 0.4 saturation thresholds. This threshold value is set through experiment.
Morphological closing : A morphological closing with a line structural element symmetric with respect to the neighborhood center is applied.
Morphological area opening : A morphological area opening is applied with 30 pixel area to remove objects less than 30 pixel area. The value 30 is set through experiment.
Counting the number of objects : The final verification step is to count the number of objects in the localized image. If the number of objects is one (representing thin golden strip), it is a genuine currency. Otherwise, it is a counterfeit.
-
b) Verification by the Wide Strip
In addition to the thin golden strip, 50 Birr and 100 Birr banknotes have wide strips that would help for further verification. The verification involves the following steps.
ROI localization : The position of the wide strip is similar and, as a result, the ROI is be localized by using pixel coordinates.
Binarization : For better processing, the RGB is converted to grayscale format and the grayscale image is converted to binary image by using an optimal threshold.
The objective of binarization is to mark pixels that belong to true foreground regions with a single intensity and background regions with different intensities. Through experiment, it is found that for genuine Ethiopian currency, a region with pixel value less than 30 is noise. Therefore, binarization is applied with a pixel intensity threshold of 30. This operation considers pixel intensities less than 30 as noise and therefore removes those pixels.
Morphological area opening : Morphological area opening removes from a binary image all connected components (objects) that have less than a given threshold of pixels, producing another binary image. It is assumed that those objects which have less area than the given threshold of pixels are noises that need to be removed from the ROI. In the proposed system, an area opening by 100-pixel object is done.
Morphological closing : Morphological closing of an image is dilation followed by erosion, using the same structuring element for both operations. In the proposed system, a morphological closing with square structural element of size 5 symmetric with respect to the neighborhood centre is applied. This size of the structural element is set through experiment.
Counting the number of objects : If the number of objects is one (representing wide golden strip), it is a genuine currency. Otherwise, it is a counterfeit.
-
IV. Experiment
-
A. Dataset Collection
For evaluating and testing the proposed prototype, different denomination of Ethiopian and non-Ethiopian currencies are collected. Genuine sixty 100 Birr notes, sixty 50 Birr notes, forty 10 Birr notes, forty 5 Birr notes, forty 1 Birr notes are collected. In these notes new, a little old, very old and worn out currency notes are included. To test the verification capability of the system, counterfeit currency notes are collected. Among these counterfeit notes, previous Ethiopian genuine notes are also included. In addition to these currencies, other countries’ currencies are also collected, namely US dollar, Rand, Dirham, and Shilling. Both scanner and camera images of these currencies are acquired and stored for evaluating and testing the system. The scanner used for capturing images is HP Scan jet G2710. Each currency is scanned with a resolution of 200dpi, size 1122 x 570 pixel and saved in a JPEG image. From the scanned image, a standard image is selected from each denomination and stored as a reference for comparing the test currency image. The camera used to capture the images is Canon PowerShot SD1400 IS Digital ELPH with 14.1 Mega pixels. The images of the currency are taken with a background white light, so that the broken thin golden strip to be solid line.
-
B. Implementation
For this work, MATLAB tool is used as a development environment. The SURF extraction and matching are implemented and included in MATLAB ToolBox. Toshiba laptop of the following specification is used for the research: Windows 7 32-bit operating system. The hardware component comprises of Intel(R) Core(TM) 2 Duo CPU of 2.1 GHz, 3GB memory, and 500GB hard disk.
-
C. Test Results
The accuracy of the denomination or denomination rate is measured by the ratio of number of accurately denominated currencies and the total number of currencies tested. And the accuracy of the verification or the verification rate is measured as the ratio of number of accurately verified currencies and the total number of accurately denominated currencies. Both the denomination rate (DR) and verification rate (VR) are calculated for each denomination of Ethiopian currency as follows.
Correctly Denominated Currency Images Total Test Currency Images
VR =
Correctly Verified Currency Images
Correctly Denominated Currency Images
Accordingly, test results show that the average denomination rate is 90.42% with an average processing time of 1.68 second. In the experiment, it was observed that the denomination rate for relatively new currencies of all denominations is 100%. But for very old notes, the denomination rate is between 80% and 90%. On the other hand, 83.3% of 50 Birr and 100 Birr counterfeit bank notes were classified according to their denomination. However, no counterfeit banknote passed the verification component and we achieved 100% accuracy for rejecting counterfeit banknotes. The system was also tested with Dollar, Rand, Shillings, and Dirham. All of these foreign currencies were rejected by the system, which is the other strength of our approach.
-
V. Conclusion and Future Works
We described a system that automatically classifies a given input image into one of the five Ethiopian paper currencies and also checks if the banknotes are genuine or not. Although, to our knowledge, this is the first attempt on Ethiopian currency recognition, we have achieved very promising results that could encourage applying the system in real-world environment. The system can stimulate the economy by facilitating business transactions in a more convenient way. Test results showed that the system is effective in rejecting counterfeit and foreign banknotes. By tuning the parameters and adjusting thresholds, we can even obtain an optimal result. Thus, future work is directed towards improving the performance of the system and installing it in real environment.
References Automatic Recognition and Counterfeit Detection of Ethiopian Paper Currency
- A. Ahmadi, S. Omatu, T. Kosaka and T. Fujinaka (2004). "A reliable method for classification of bank notes using artificial neural networks". Artificial Life and Robotics, 8(2): 133–139.
- M. Aoba, T. Kikuchi and Y. Takefuji (2003). "Euro banknote recognition system using a three-layered perceptron and RBF networks". Transactions on Mathematical Modeling and Its Applications, 44:99–109.
- H. Bay, A. Ess , T. Tuytelaars, L. Gool (2008). "Speeded-Up Robust Features (SURF)", Computer Vision and Image Understanding: Similarity Matching in Computer Vision and Multimedia, 110(3):346–359.
- S. Chae, J. Kim, and S. Pan (2009). "A Study on the Korean Banknote Recognition Using RGB and UV Information," in Communication and Networking, Series of Communications in Computer and Information Science, 56:477–484.
- T. H. Chia and M. J. Levene (2009). "Detection of counterfeit U.S. paper money using intrinsic fluorescence lifetime," Optics Express, 17(24): 22054–22061.
- K. Debnath, S. Ahmed and Md. Shahjahan (2010). "A paper currency recognition system using Negatively Correlated Neural Network Ensemble", Journal of Multimedia, 5(6): 560-567.
- F. Garcia-Lamont, J. Cervantes, A. Lopez (2012). "Recognition of Mexican Banknotes via their colour and texture features", Expert Systems with Applications, Vol. 39.
- L. Georgieva, T. Dimitrova, N. Angelov (2005). "RGB and HSV Colour Models in Colour Identification of Digital Traumas Images", International Conference on Computer Systems and Technologies, Vol. 12, No.1.
- M. Gogoi, S. Ali and S. Mukherjee (2014). "Automatic Indian Currency Denomination Recognition Based on Artificial Neural Network". Proceedings of the 2nd International Conference on Signal Processing and Integrated Networks, Noida, IEEE.
- H. Gou, X. Li, X. Li, and J. Yi (2011). "A Reliable Classification Method for Paper Currency Based on LVQ Neural Network," in Advances in Computer Science and Education Applications, 202:243–247.
- F. Hasanuzzaman, X. Yang, Y. Tian (2011). "Robust and Effective Component-based Banknote Recognition by SURF Features", Proceedings of the 20th Annual Conference on Wireless and Optical Communications, Newark, NJ, pp. 1-6.
- N. Jahangir and A. Chowdhury (2007). "Bangladeshi Banknote Recognition by Neural Network with Axis Symmetrical Masks", In Proc. of 10th International Conference on Computer and Information Technology, 9:1-5.
- T. Kagehiro, H. Nagayoshi and H. Sako (2006). "A hierarchical classification method for US bank notes". Transactions on Information and Systems, E89D (7):2061–2067.
- W. Kavinda, S. Dhammika (2013). "Bank notes recognition device for Sri Lankan vision impaired community", In Proc. of 8th International Conference Computer Science & Education, Colombo, pp. 609-612.
- Y. Liu, L. Zheng and Y. Huang (2014). "Haar-SVM for Real-Time Banknotes Recognition". Journal of Information and Computational Sciences, 11(12): 4031-4039.
- A. Sargano, M. Sarfraz, N. Haq (2013). "Robust features and paper currency recognition system", Proceedings of the 6th International Conference on Information Technology.
- F. Takeda and S. Omatu (1995). "High-speed paper currency recognition by neural networks", IEEE Transaction on Neural Networks, 6(1):73-77.
- K. Verma, B. Singh and A. Agarwal (2011). "Indian Currency Recognition Based on Texture Analysis". Proceedings of the Nirma University International Conference on Engineering (NUiCONE), Gujarat, IEEE.
- W. Yan, J. Chambers and A. Garhwal (2015). "An Empirical Approach for Currency Identification", Multimedia Tools and Applications, 74: 4723-4733.
- C. Yeh, W. Su and S. Lee (2011). "Employing multiple-kernel support vector machines for counterfeit banknote recognition". Applied Soft Computing, 11: 1439-1447.
- E. Zhang, B. Jiang, J. Duan, and Z. Bian, "Research on Paper Currency Recognition by Neural Networks", In Proceedings of the 2nd International Conference on Machine Learning and Cybernetics, Vol. 4, 2003.
- X. Zhu, M. Ren, "A Recognition Method of RMB Numbers Based on Character Features", In Proc. of 2nd International conference on Information, Electronics and Computer, 2014.
