Automatic Robust Segmentation Scheme for Pathological Problems in Mango Crop

Author: S. B. Ullagaddi, S. Viswanadha Raju
Journal: International Journal of Modern Education and Computer Science (IJMECS) @ijmecs
Article in issue: 1 vol.9, 2017.
Free access
Machine vision and soft computing techniques have been promising in the field of agriculture and horticulture to remove the barriers of conventional methods for detecting the plant diseases using different plant parts. Image segmentation technique is first and primary step in all the related researches such as fruit grading, leaf lesion region detection etc. In this paper, a robust technique for Mango crop using different plant parts such as Fruit, Flower and Leaf has been proposed in order to detect the disease more accurately. The captured real time images are pre-processed for illumination normalization and color space conversion before segmentation. The standard K-Means clustering scheme has been made adaptive and edge detection transforms have been applied to improve the segmentation results. Here, the objective function of K-Means clustering technique has been modified and cluster centers also have been updated to segment the diseased parts from images. The results obtained are better in the terms of both general human observation and in computational time.
Image Segmentation, Clustering, Color space, Wavelets, Illumination and Edge Detection
Short address: https://sciup.org/15014937
IDR: 15014937
Text of the scientific article Automatic Robust Segmentation Scheme for Pathological Problems in Mango Crop
Published Online January 2017 in MECS DOI: 10.5815/ijmecs.2017.01.05
India is one of the fastest developing countries with agriculture as the backbone of its economy. Indian economy largely depends on crops grown here. Variety range of crops like fruits, vegetables, grams etc are grown by Indian farmers. The yield and quality of crops can be improved with the use of modern technologies. The management of recurrent fruit crops needs a close attention particularly for the monitoring of diseases affecting production drastically and consequently the post-harvest time. As the progress of agricultural technology being superior, the percentage of those which were dependents on farming decreased. The motive of agricultural research and development was primarily on enhancing yields. Use of a lot of pesticides and nature induced diseases affect the crops to reduce the production. Hence, the challenge remains on researchers to diagnose these diseases and to suggest preventive measures accordingly. Early diagnosis of these diseases is the most precise way. There are number of techniques to detect these diseases. The open eye inspection of experts is the key method which is used in generally for recognition and classification of plant diseases. But, this necessitates incessant monitoring by experts. When there is a big field, this technique becomes more costly and time consuming. Also, the lack of communication between experts and farmers, lack of awareness about these diseases among farmers also maks this approach very much difficult to implement in real world. As a result, an automatic detection of plant diseases in agriculture science the need of the hour.
Among different agriculture fruit crops mango is one of the most preferred fruits all over the world with a big marketplace value. India has been conventionally the main producer of mango in the world. In India there are two main excellent mango varieties which are exported on a large scale. These varieties are Dashehari, which is grown in Northern India and Alphanso which is grown in Southern India. Still, we are holed up far behind in the world export market because our mango crop yield is overwhelmed with numerous problems; such as use of pesticides, severe diseases and physiological disorders. These limitations diminish our whole production and poorly impede the fruit quality. Diagnosis of fruit techniques have been utilized in a variety of areas such as production companies where mango juice are prepared along with the farmers for whom differentiation of these mangoes during storage becomes a tedious job. Computerized automatic detection of these diseases presents a key challenge in order to diagnose the bacterial disease and accordingly grading of fruits. These bacterial growths in crops are going to diminish the yield which is observable in different parts of plants like stem, leaves, flowers and fruits. These diseases also result in the rapid decline of cultivation growth in coming years for the farms. Smart farming is a boost up for the farmers in current scenarios with aids of decision making tool and the available technologies to add on the knowledge, technology and product in order to improve the yield and maximizing the profit.
Mangoes are widely used to prepare juice, fruit bars, ice cream, smoothies, sweet chili sauce, pies or ripened in several forms. Mango can be mashed in small pieces to provide layers on ice creams to blend with milk to prepare flavored milk or milkshakes etc. Mango is also used in pickles and curries all over the India. According to Ayurveda rippened sweet mangoes are considered to be a great source for energy tonic for body while green sour mangoes are the ultimate source of treatments in situations such as dehydration, sunstroke etc. The use of the powder of dried Mango seeds as tooth paste provides strength to the gums and is the best curing method for dental problems and is useful in Gall and Kidney Stones. Burnt ashes prepared from Mango leaves are used in fire burns, applied on the burnt parts to give quick relief to burnt body parts. With hot sand roasting the ripe mango is a cure for dry cough. Sips of mango juice are also used to get relief from cough and bronchial congestion. All these uses of of mango leads us to diagnose the diseases and suggesting the control measures.
There are lots of diseases which occur in mango crop but Powdery Mildew (Oidium Mangiferae) and Anthracnose/ Blossom Blight (Colletotrichum Gloeosporioides) are two main diseases which affect the production of mango crop largely. The symptoms of Powdery Mildew disease are white superficial powdery growth of the fungus which is observed on the inflorescence, trail of inflorescence, early fruits and leaves. Due to this disease, affected flowers may fall before growing into fruits or early grown fruits may fall from the tree branches which may result in more than 70% crop loss. The symptoms of Anthracnose disease are irregular shaped brown or black stains appearing over the leaf surface or early grown fruits. The fungus also may grow quickly in damp situations. Initially these spots on fruits are round shaped but later on they take irregular shapes on the entire leaves or fruit which result in rotten leaves or rotten fruits.
In this paper, a segmentation based detection approach is proposed for recognition and classification of mango diseases using the digital images which have been captured using digital camera. This research effectively works on the pathological problems of mango. After detection and recognition of the disease the decisions can be made for control measures. The detection of mango disease using different parts of plants such as leaves, fruits, flowers and stem has been carried out in the current research. It is the prior step to further process to know the percentage of the disease incidence, symptoms of the disease attack. Therefore, machine based automatic detection and diagnosis of pathogen plays a key role in successful cultivation and marketing of mango crop.
The rest of the paper is organized as follows: The related work carried out by other researchers is presented in section II. The proposed robust method is detailed with system setup to acquire fruit images and process in section III. In section IV experimental results are discussed. The coclusions are drawn in section V.
-
II. Related Work
A variety of digital image processing steps are executed such as acquisition, preprocessing, segmentation, classification and recognition of images of different parts of mango plant. After performing these image processing steps one will be able to detect the affected parts and classify the disease. There are a lot of applications in image processing domain for the development in agriculture science .A number of research papers have been published in the related domain with their respective pros and cons. The K-means and unsupervised learning approach as proposed in [1] for diagnosis of plant diseases by using real time images captured by mobile phones with analysis of visual phenotypes. For cautious sharing of the determined load between the capturing device and main sever installed at laboratory they have used a threshold based offloading technique is used. This technique provides a trade-off between communication cost and the consumption of power for mobile. Here, the research focuses on research on the leaves of plant. Improved k-means clustering based segmentation methodology was implemented for detecting the affected areas in leaves which was found to be quite efficient for smart phones. This algorithm also results in decline of the transmission cost as there is no need of transmitting the complete leaf image.
An automatic plant identification technique from photographs using shape, color and texture features are presented [2] for change in shape of leaf according to age of plant and leaf composition along with conventional hurdles of object recognition such as variation in pose, light and orientation. The designed system allows utilizing a wide range of texture, shape and color features. The result with 60% to 80% accuracy in different type of plant species was observed. In [3] author describes and implement an adaptive technique in order to identify and classify the fruit diseases. Here first the images are segmented and features are extracted in order to distinguish the diseased part of fruits in order to complete the classification which was quite helpful in horticulture filed. The [4] proposed an adaptive approach for identification and experimental validation of fruit diseases. They use image processing techniques to detect the disease in fruits. The segmentation was done using K-means clustering technique and then feature extraction was done. Using these features the images were classified accordingly using support vector machine. The accuracy was found to be approximately 93% here.
Recognition and classification of plant leaf diseases has been implemented in [5] using texture features. The proposed work was an automated and software implementation for detection and classification based on diagnosis of plant leaves. In [6] author use image processing methods to put up the mathematical modeling based growth analysis for crops. Here, no segmentation scheme for the leaves was proposed in critical cases like improper edge locations etc which resulted to be failure of the research. Also, a plenty of researches have extracted a variety of features, such as, junction feature parameters [7] or the number of statistical parameter based features [8]. Conversely, these features use the RGB image histogram and the outcome of the distribution of pixel gray levels, which are still not found to be accurate for differentiating between stripe rust and wheat powdery mildew disease. As a result, it is essential to discover a better technique for extraction of features to in order to discriminate unusual plant diseases, and recognize these diseases accurately. The encouraging results were obtained in terms of either crop pest or disease recognition in [9-13].
The methodologies used for rice leaf disease recognition analyzed in [14] on the basis of the color or pixel characteristics of leaf lesion region. A speedy and precise method was designed which was based on k-means based segmentation. This design also usedsneural network based classification technique for detecting and classifying the leaf disease [15]. However, an automatic classification system of leaf diseases was also designed for stereo and high resolution multispectral images of sugar beet leaves [16]. It can also use segmentation based on optimal threshold value which used weighted Parzen-window [17]. It is also quite good to use Otsu Based segmentation scheme for plant disease grading on leaf images which is easier to implement and precise too [1821].
In [22] the authosr have calculated Optimal Wavelength Features using neural network and ROC (Receiver Operating Characteristic) curves in order to determine the Decay for Citrus Fruit. Here, receiver operating curves are used in order to choose features in multiclass classification issues where with the use of hyper spectral images decay is detected in citrus fruits. Here, the authors have used the multilayer Perceptron classifier. This classifier is trained using a novel learning algorithm which is known as extreme learning machine. This implementation was tested on mandarin images with five types of different labels of classes. The feature set was found to be diminished and success rate of classification was around 89%. The feature selection technique designed to enlarge using ROC curve to classify issues with multi class also. This takes place in two phases, in first phase ranking of features is obtained which have been ordered in respect the discriminated relevance and in the second phase a choice is made for desired number of features from the obtained feature ranking. Here, Discriminated relevance of a feature is determined as the difference between the area under the ROC curve for designed classifier with all the features determined and the area while no effect of features is considered. This calculation also describes the significance of feature values for classifier during the discrimination process; along with the consideration that if discriminated relevance of a feature is higher thet feature will be the having superior discriminatory. However, statistical methods are used to decrease the dimensionality and select features which can be further divided into wrapper and filter techniques [23]. Filter techniques use an indirect measure of the quality of the chosen feature such as calculating the correlation between the dependent parameters class and input set of feature during classification in order to achieve a quicker convergence of the algorithm selected. In addition, the selection method which is used by wrapper methods try to get the best fit between input and the output which is delivered by the use of learning machine taken into account such as neural network. Here, success rate of classification is taken as the parameter which is used to evaluate the performance of classifiers used.
-
III. Proposed Work
Here worked on the segmentation of Mango plant parts such as leaves, flowers and fruits to detect the two types of diseases namely Powdery Mildew and Anthracnose. Initially the captured color images of plant parts are used to perform some image-preprocessing such as channel separation, illumination normalization (if non uniform illumination is exists). Then color space conversion is performed to get the grayness value. On this grayness image we perform Adaptive K-means segmentation to segment the lesion region. To get sharp edges at the boundaries of segmented image the authors apply different edge detection transforms and then combine them in order to obtain the final segmented image. The flow of the proposed work is shown in Fig.1.
-
A. Image Acquisition
The authors have captured 350 numbers of images for each leaf, flower and fruit with normal and diseased using Nikon 16megapixel digital camera during mango spring that is from March to July from mango orchids and Agricultural University at Dharwad district (Karnataka) location. In leaves observed both Powdery Mildew and Anthracnose disease. The flowers are affected by Powdery Mildew disease and the fruits show Anthracnose disease. Each captured image is having the resolution of 4320x3240 pixels.
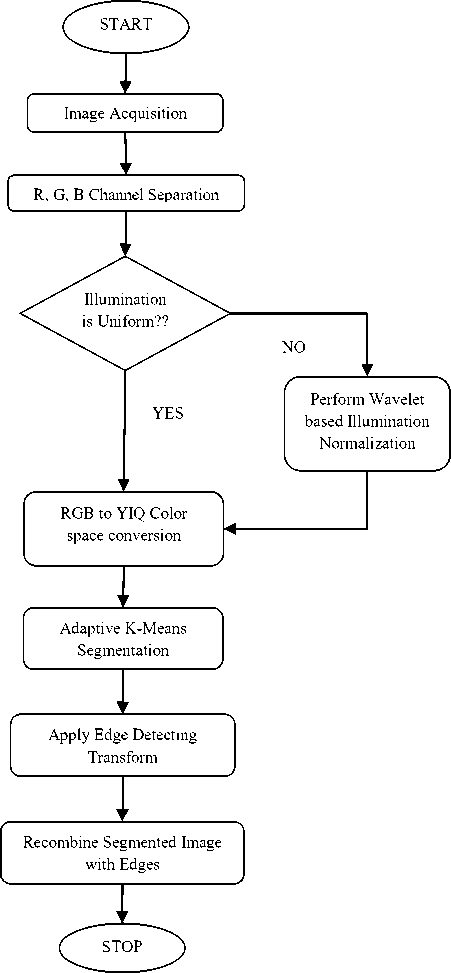
Fig.1. Flow of Proposed Work
-
B. RGB Channel Separation
In the digital image processing world, there are so many number of colors and combinations of which result in a beautiful color image. However, all the colors are basically derived from three basic colors i.e. Red (R), Green (G) and Blue (B). Hence, an RGB or color image has three channels: Red, Green, and Blue. These channels generally pursue the color receptors for human eyes, which are also utilized in computerized digital displays and scanners. Here, a channel is extensive grayscale image for the particular primary color. However, the channel image is also having the same resolution as of original color image. In each channel the pixels are having any value out of 256 gray level (0 to 255) resulting in 8-bit pixel. As a result a color image is having pixel value of 24-bit (8-bit for each channel). Here, from captured RGB images, the authors seperate all the three channels in order to process further.
-
C. Wavelet based Illumination Normalization
During image acquisition, due to external environmental interferences and imaging equipment there may be chances of non-uniform illumination. In order to avoid these disturbances to the consequent image, the author use wavelet transform method to correct nonuniform illumination. The Wavelet transform decomposes an image into two parts namely approximate coefficients and detail coefficients. Histogram equalization on the approximation coefficients can be applied for contrast enhancement and simultaneously detail coefficients can be multiplied by a scalar (>1) in order to obtain edge enhancement. Finally, a normalized image can be reconstructed using these modified coefficients by performing inverse wavelet transform. In the double-band wavelet transform, any signal can be represented using wavelet and scaling basis functions as f to = Zi *0,i ФО,(X) + Z; Z i P j,Pj,t(x) (1)
Where, p j,t is wavelet function at scale of j and Ф ;-,t is the scaling functions at scale j. Also, P j, t are wavelet coefficients and Kj, t are scaling coefficients.
-
D. RGB to YIQ Color space Conversion
[ ; ]=[
0․299
0․596 0․211
0․587
- 0․274
- 0․523
0․114
- 0․322][ G ]
0․312J LsJ
-
E. Adaptive K-Means Clustering
The Adaptive K-Means Clustering technique enhances the segmentation output obtained through the original K-Means technique. The output of K-Means algorithm greatly depends on the initialization i.e. the choice of placement of k-centroids.
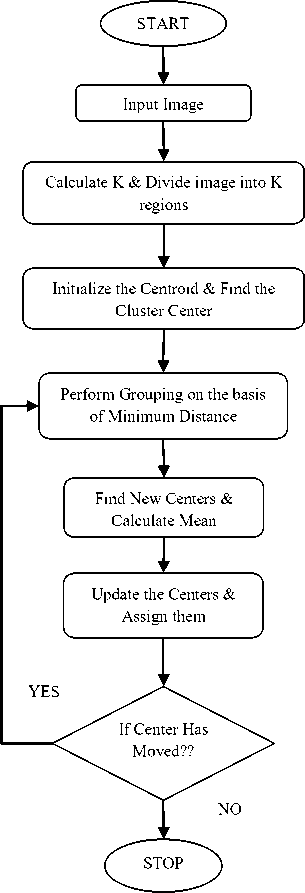
Fig.2. Flow of Adaptive K-Means Clustering Scheme
As location of centroid is changed the output will be changed. In the original K-Means algorithm random number of clusters are taken and assigned with some random location of centers which result in degraded and improper segments. Here, the method is modified in order to evaluate the best number of clusters and their means to obtain proper segments. Here, local minimum and local maximum values are computed from image during initial phase. In adaptive scheme an iterative method is applied by minimization of given objective function in order to produce the optimal value of initial k- centroids. The flow of Adaptive K-Means clustering scheme is shown in Fig.2. These are calculated using following objective function–
=
∑m=l ∑n=i^( ^mm , ^max )
Where, d is the obtained Euclidean distance between local minimum pixel value ^mtn and local maximum pixel value ^max , N represent the number of pixels in image and c is the total number of cluster in image. The objective function for K-Means Segmentation is given by
–
-
Y ( C )= 0․5∗∑^i ∑ c ( j ) =i ∑ ( к ) =i ‖ Tj - Tk ‖ (4)
or , Y ( C )=∑f=1 Numt ∑ c ( i ) =i ‖ Tj - Hi ‖2 (5)
wℎ ere , Hi = ∑ - : (;) v^" f0T =1,2,…, N (6)
& C () =min‖ r, - Hi ‖2 forj =1,2,…, Num (7)
Where, M-i and Numt are mean and number of pixels in i£h cluster. Here, M-i is calculated using eq. (6). During convergence step of adaptive K-means clustering algorithm computations have been decreased to make it fast and reliable. The new centers are found using following steps –
Step-1: Once the new centers are calculated using new assigned elements, mean value for these new centers is calculated.
Step-2: Next, the absolute distance value between the current center and the next center is calculated
Step-3: If the absolute value is found to be greater than the mean value calculated in Step-1, then new center value is updated. otherwise the mean value of current center and next center is assigned to new center value.
Step-4: The above three steps are repeated for all centers.
-
F. Edge Detection
Edge detection or corner detection is also a special type of segmentation technique in digital image processing. This technique enables us to determine the boundaries or shape of the objects. Discontinuity in pixel values is the basic principle on which edge detection works. Point detection or line detection are also sub-types of edge detection only. Generally, derivatives are calculated in order to detect the edges. First-order derivative (Gradient Technique) and Second-order derivative (Laplacian Technique) are two most commonly used methods. Since these methods are prone to noise they are not preferred nowadays. Some different type of methods such as Sobel, Prewitt, and Roberts are most commonly used. The authors have also implemented some more types of edge detection methods along with these traditional methods which have been tabulated in Table-1. The images obtained after segmentation have been processed with these various transforms. These edges are superimposed on the segments in order to get the sharp edges or boundaries of the lesion area in leaf. Magnitude of Gradient or Absolute Gradient and Gradient Phase or Direction of Gradient for these transforms can be calculated as –
ℎ ( ) = arctan
( )
\т2/
Where, and are values obtained from first and second masks of transform respectively for each type of transform. In case of more than two masks these parameters can be calculated as –
( ) =max()
=1,2,…,8(10)
ℎ ( ) = arg(max()
=1,2,…,8(11)
( )= √ + (8)
Table 1. Edge Detection Methods
|
Roberts Method: |
Prewitt Method: |
||||||
|
"- 1 0 " Г 0 - 1" 0 1,10 |
"-1 - 1 - 1" 0 0 0 1 1 1 |
, |
"-1 0 1 " - 1 0 1 _- 1 0 1 J |
||||
|
Sobel Method: |
Fri & Chen Method: |
||||||
|
"-1 - 2 - 1" 0 0 0 1 2 1 |
"-1 0 1" , - 2 0 2 - 1 0 1 |
- 1 -72 - 1 0 0 0 _ 1 V2" 1 1 |
" -1 0 1 " , - V2 0 V2 - 1 0 1 |
||||
|
obinson Metho "1 0 - 1"
"-1 0 1"
|
d: , , |
0 - 1 - 2 " 10 - 1 , 2 10 J 0 1 2 " - 1 0 1 , - 2 - 1 0 J |
0 0 0, . 1 2 1 1 " 1 2 1 " 0 0 0 ,
|
"-2 - 1 0 " - 1 0 1 0 1 2 J "2 1 0 " 1 0 - 1 0 - 1 - 2 J |
|||
|
irsch Method: Г 5 - 3 - 3 5 0 - 3 _ 5 - 3 - 3 Г- 3 - 3 5 - 3 0 5 _- 3 - 3 5 |
" , 1 " , 1 |
"-3 5 5 " - 3 0 5 _- 3 - 3 - 3 1 |
Г- 3 - 3 - 3 "
. 5 5 5 1 " 5 5 5 "
_- 3 - 3 - 3 _ |
, , |
" 5 5 - 3 " 5 0 - 3 _- 3 - 3 - 3 J |
||
-
IV. Results and Discussion
The proposed work has been carried out using MATLAB (MATrix LABoratory) software. The proposed design has been experimented on real time images which were captured using Nikon 16megapixel digital camera during mango spring from mango orchids and Agricultural University at Dharwad, Karnataka, location. Fig.3(a) shows the original captured image for leaves affected by Anthracnose disease and Fig.3(b) shows the segmented results for detection. Fig.4(a) shows images captured for mango fruit affected by Anthracnose and Fig.4(b) shows the segmented results. Similarly, The Fig.5(a) shows the original captured image for mango flowers affected by Powdery mildew disease and fig.5(b) shows the results of segmentation. The segmented images shown here are obtained after performing the steps suggested in flow as shown in Fig.1. The images captured have a complex background and uneven illumination, the most of the works carried using the uniform background images since the the system presents here is the more robust..
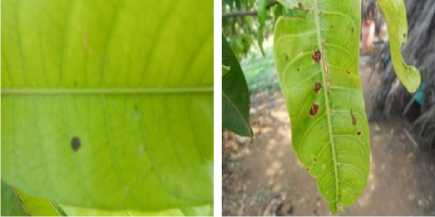
Fig.3a. Original image for leaves
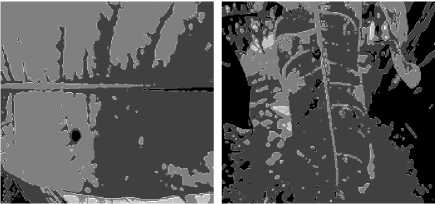
Fig.3b. Segmented Image for Leaves
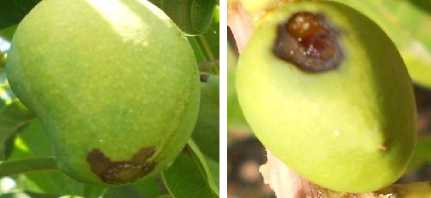
Fig.4a. Original image for fruits
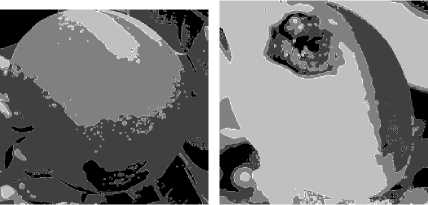
Fig.4b. Segmented Image for Fruits
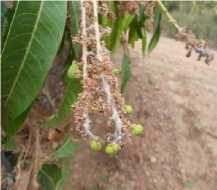
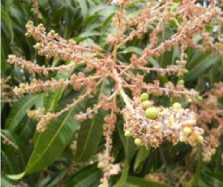
Fig.5a. Original images for Flower
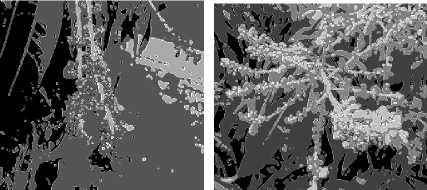
Fig.5b. Segmented Image for Flowers
-
V. Conclusion
In agriculture based economy of our country, it becomes essential to protect the crops and plants from diseases. To design a better identification system it is necessary to analyze all possible plant parts such as leaf, flower, stem and fruit etc. This paper puts efforts to diagnose the lesion area in leaf, flower and fruit images of Mango Trees. For detection Adaptive K-Means based clustering scheme is used along with different types of edge transforms. A wavelet based illumination normalization technique has also been employed to avoid the non-uniform illumination during processing image. The experimental results obtained here are found to be more robust and accurate than existing works. Further, this work will be extended to recognize and classify the Powdery Mildew and Anthracnose diseases with feature extraction and to provide control measures to farmers to take effective decisions and enhance the productivity of crop.
Refrences
-
[1] Shitala Prasad, “Energy Efficient Mobile Vision System for Plant Leaf Disease Identification”, IEEE WCNC'14 Track 4 (Services, Applications, and Business)-2014.
-
[2] B. Yanikoglu, E. Aptoula, C. Tirkaz, “Automatic plant identification from photographs”, Machine Vision and Applications: 1369–1383.Springer-2014.
-
[3] Pushpa B R, Meghana T K, Tripulla K H (2015), “Detection and classification of fungal disease in fruits using image processing technique” in International journal of applied engineering research (IJAER), Vol 10, number 55.
-
[4] Shiv Ram Dubey, Anand Singh Jalal (2012) “Adapted Approach for Fruit disease Identification using Images”, in International Journal of computer vision and image processing (IJCVIP) Vol 2, no. 3:44-58.
-
[5] Yinmao Song, Zhihua Diao, Yunpeng Wang, Huan Wang, “Image Feature Extraction of Crop Disease”, in IEEE Symposium on Electrical & Electronics Engineering (EEESYM), 2012
-
[6] G.E.Meyer, D.A.Davison, “An electronic image plant growth measurement system,” Transactions of the ASAE, 1987, vol.30, no.3, pp.591-596.
-
[7] T.Liu, X.Zhong, C.Sun, W.Guo, Y.Chen, J.Sun, “Recognition of rice leaf diseases based on computer vision,” Scientia Agricultura Sinica, 2014, vol.47, no.4, pp.664-674.
-
[8] Z.Peng, X.Si, X.Wang, H.Yuan, “Feature extraction of cucumber diseases based on computer image processing
technology,”Journal of Agricultural Mechanization Research, 2014, vol.02, pp.179-182,187.
-
[9] L.Yuan, Y.Huang, R.W.Loraamm, et al, “Spectral
analysis of winter wheat leaves for detection and differentiation of diseases and insects,” Field Crops Research, 2014, vol.156, pp.199-207.
-
[10] J .Zhang, L.Yuan, R.Pu, R.W.Loraamm, G.Yang, J .Wang, “Comparison between wavelet spectral features and conventional spectral features in detecting yellow rust for winter wheat,” Computers and Electronics in Agriculture, 2014, vol.100, pp.79-87.
-
[11] J.Zhang, R.Pu, W.Huang, L.Yuan, J.Luo, J.Wang, “Using in-situ hyperspectral data for detecting and discriminating yellow rust disease from nutrient stresses,” Field Crops Research, 2012, vol.134,pp.165-174.
-
[12] J.Zhang, L.Yuan, J. Wang, et al, “Research progress of crop diseases and pests monitoring based on remove sensing,” Transactions of the Chinese Society of Agricultural Engineering, 2012, vol.28, no.20, pp.1-11.
-
[13] J.Zhang, R.Pu, J.Wang ,W.Huang, L.Yuan, J.Luo,
“Detecting powdery mildew of winter wheat using leaf level hyperspectral measurements,” Computers and
Electronics in Agriculture, 2012, vol.85, pp. 13-23.
References Automatic Robust Segmentation Scheme for Pathological Problems in Mango Crop
- Shitala Prasad, "Energy Efficient Mobile Vision System for Plant Leaf Disease Identification", IEEE WCNC'14 Track 4 (Services, Applications, and Business)-2014.
- B. Yanikoglu, E. Aptoula, C. Tirkaz, "Automatic plant identification from photographs", Machine Vision and Applications: 1369–1383.Springer-2014.
- Pushpa B R, Meghana T K, Tripulla K H (2015), "Detection and classification of fungal disease in fruits using image processing technique" in International journal of applied engineering research (IJAER), Vol 10, number 55.
- Shiv Ram Dubey, Anand Singh Jalal (2012) "Adapted Approach for Fruit disease Identification using Images", in International Journal of computer vision and image processing (IJCVIP) Vol 2, no. 3:44-58.
- Yinmao Song, Zhihua Diao, Yunpeng Wang, Huan Wang, "Image Feature Extraction of Crop Disease", in IEEE Symposium on Electrical & Electronics Engineering (EEESYM), 2012
- G.E.Meyer, D.A.Davison, "An electronic image plant growth measurement system," Transactions of the ASAE, 1987, vol.30, no.3, pp.591-596.
- T.Liu, X.Zhong, C.Sun, W.Guo, Y.Chen, J.Sun, "Recognition of rice leaf diseases based on computer vision," Scientia Agricultura Sinica, 2014, vol.47, no.4, pp.664-674.
- Z.Peng, X.Si, X.Wang, H.Yuan, "Feature extraction of cucumber diseases based on computer image processing technology,"Journal of Agricultural Mechanization Research, 2014, vol.02, pp.179-182,187.
- L.Yuan, Y.Huang, R.W.Loraamm, et al, "Spectral analysis of winter wheat leaves for detection and differentiation of diseases and insects," Field Crops Research, 2014, vol.156, pp.199-207.
- J .Zhang, L.Yuan, R.Pu, R.W.Loraamm, G.Yang, J .Wang, "Comparison between wavelet spectral features and conventional spectral features in detecting yellow rust for winter wheat," Computers and Electronics in Agriculture, 2014, vol.100, pp.79-87.
- J.Zhang, R.Pu, W.Huang, L.Yuan, J.Luo, J.Wang, "Using in-situ hyperspectral data for detecting and discriminating yellow rust disease from nutrient stresses," Field Crops Research, 2012, vol.134,pp.165-174.
- J.Zhang, L.Yuan, J. Wang, et al, "Research progress of crop diseases and pests monitoring based on remove sensing," Transactions of the Chinese Society of Agricultural Engineering, 2012, vol.28, no.20, pp.1-11.
- J.Zhang, R.Pu, J.Wang ,W.Huang, L.Yuan, J.Luo, "Detecting powdery mildew of winter wheat using leaf level hyperspectral measurements," Computers and Electronics in Agriculture, 2012, vol.85, pp. 13-23.
- L.P. Li, G.M. Zhou, "Research on image feature extraction of crop disease," Transactions of the CSAE, vol.2S, pp.213-217, 2009.
- Al-Bashish, D., M. Braik and S. Bani-Ahmad, 2011. Detection and classification of leaf diseases using K-means-based segmentation and neural networks based classification. Inform. Technol. J., 10: 267-275. DOI:10.3923/itj.2011.267.275, January, 2011
- Sabine D. Bauer, FilipKorc, Wolfgang Forstner, The Potential of Automatic Methods of Classification to identify Leaf diseases from Multispectral images, Published online: 26 January 2011,Springer Science+Business Media, LLC 2011., Precision Agric (2011) 12:361–377
- Wang Jun, Wang Shitong, Image Thresholding Using Weighted Parzen Window Estimation. Journal of applied sciences 8(5):772-779, 2008, ISSN 1812-5654, Asian Network for Scientific Information, 2008
- Otsu, N., "A Threshold Selection Method from Gray- Level Histograms," IEEE Transactions on Systems, Man, and Cybernetics, Vol. 9, No. 1, 1979, pp. 62-66
- Sezgin, M. and Sankur, B. (2003). "Survey over image thresholding techniques and quantitative performance evaluation", Journal of Electronic Imaging 13 (1): 146–165. DOI:10.1117/1.1631315 (2002)
- Weizheng, S., Yachun, W., Zhanliang, C., and Hongda, W. (2008). Grading Method of Leaf Spot Disease Based on Image Processing. In Proceedings of the 2008 international Conference on Computer Science and Software Engineering - Volume 06 (December 12 - 14, 2008), CSSE, IEEE Computer Society, Washington, DC, 491-494.
- Otsu, N. (1979). "A threshold selection method from gray-level histograms", IEEE Trans. Sys., Man., Cyber.9: 62–66. DOI:10.1109/TSMC.1979.4310076
- D Lorente, N Aleixos, J Gómez-Sanchis, S Cubero, J Blasco, "Selection of optimal wavelength features for decay detection in citrus fruit using the ROC curve and neural networks" Food and Bioprocess Technology 6 (2), pp.530-541
- Guyon, I., & Elisseeff, A. (2003). An introduction to variable and feature selection, Journal of Machine Learning Research, 3, 1157–1182
- D.N.D.Harini and D.Lalitha Bhaskari‖ Identification of Leaf Diseases in Tomato Plant Based on Wavelets and PCA, World Congress on Information and Communication Technologies, 978-1-4673-0125-1 IEEE-2011
