Bidirectional Encoder representation from Image Transformers for recognizing sunflower diseases from photographs

Author: Baboshina V.A., Lyakhov P.A., Lyakhova U.A., Pismennyy V.A.
Journal: Компьютерная оптика @computer-optics
Section: Обработка изображений, распознавание образов
Article in issue: 3 т.49, 2025.
Free access
This paper proposes a modern system for recognizing sunflower diseases based on Bidirectional Encoder representation from Image Transformers (BEIT). The proposed system is capable of recognizing various sunflower diseases with high accuracy. The presented research results demonstrate the advantages of the proposed system compared to known methods and contemporary neural networks. The proposed visual diagnostic system for sunflower diseases achieved 99.57 % accuracy on the sunflower disease dataset, which is higher than that of known methods. The approach described in the work can serve as an auxiliary tool for farmers, assisting them in promptly identifying diseases and pests and taking timely measures to treat plants. This, in turn, helps in preserving and enhancing the yield. This work can have a significant impact on the development of agriculture and the fight against the global food shortage problem.
Image transformer, neural network recognition, image processing, sunflower diseases, bidirectional encoder
Short address: https://sciup.org/140310485
IDR: 140310485 | DOI: 10.18287/2412-6179-CO-1514
Text of the scientific article Bidirectional Encoder representation from Image Transformers for recognizing sunflower diseases from photographs
According to the United Nations, the world population is projected to increase by 2 billion people over the next 30 years [1]. The Food and Agriculture Organization of the United Nations estimates that between 691 million and 783 million people face hunger in 2022, and the number of people experiencing severe food insecurity is around 900 million. Compared to 2019, the number of undernourished people increased by 180 million, and the number of hungry people increased by 122 million [2]. Thus, the task of increasing the volume and quality of food products produced is relevant and requires research to be solved. One way to address this problem is to increase the production of oilseeds such as soybeans, oil palm, sunflowers, and peanuts. These crops not only represent the most important sources of vegetable fat in the world's food supply but are also among the ten largest crops in terms of total calories [3]. Sunflowers are versatile plants that can be grown in various climatic zones, ranging from temperate to subtropical regions. Sunflower meal, a byproduct of oil extraction, contains up to 50% protein, numerous essential amino acids, vitamin B, minerals, and antioxidants, making it a nutritious food for both humans and livestock [4]. In addition, sunflower oil has a wide range of applications in cooking and is used as a component in the production of margarine, butter, bread, etc. [5]. In addition to the undeniable advantages of sunflowers in the food industry, they are also utilized in the production of cosmetics, paints, lubricants, biodiesel fuel, and medicines [6].
Pests and diseases that attack plants can lead to an average yield loss of 20–40 % [7]. Pesticides help prevent such threats, but the use of chemicals to treat fields has negative consequences, such as a decline in the biodiversity of insects, birds, and animals [8], degradation in the quality of soil, water, and air, and can also pose risks to human health [9]. Phytosanitary standards for fields help ensure a large volume of healthy harvest without the use of chemicals. This approach is environmentally friendly, allowing farmers to apply necessary measures on time in the desired area of the field. Assessing the state of the fields, however, is a rather labor-intensive task that requires special attention. Diseases and pests can exhibit various symptoms on different plants, either similar or combined, making it challenging to accurately diagnose them. It is not advisable to check the condition of each plant several times a season, especially if access to it is difficult. Modern computer vision technologies will help farmers solve this task.
Nowadays, neural networks are widely used for image recognition, and the field of agriculture also requires similar technologies to enable comprehensive monitoring of fields from any location worldwide. Many scientists have long been developing systems capable of recognizing plant diseases and pests. We found several researches where authors utilized modern methods to recognize a dataset of sunflower diseases [10]. The work [11] employed a transfer learning and cross-validation approach in conjunction with modern neural architectures such as AlexNet, VGG16, InceptionV3, MobileNetV3, and Effi-cientNet. This approach enabled the achievement of a processing accuracy of 97.9% on a dataset of sunflower diseases. Using the clustering and segmentation algorithms, as well as the Random Forest Algorithm classifier, an accuracy of 95 % was achieved [12]. Segmentation and clustering algorithms improved the value of this indicator to 97.88% when utilizing the ResNet50 architecture [13]. Compact architectures, such as TeenyNet [14], have also demonstrated the ability to recognize sunflower diseases with an accuracy of 98.94% in most cases. Extending the YOLOv5 architecture using the Improved Dwarf Mongoose Optimization Algorithm achieves a high accuracy of 95 % [15]. When using pyramidal squeezed attention, YOLOv5 is able to achieve an accuracy of 95.27 % [16]. Recently, the popularity of algorithms based on visual transformers (ViT) for solving the problem of pattern recognition in images has increased. ViT and its derivatives, such as SE-ViT hybrid networks, are capable of achieving an accuracy of 97.26% [17]. Despite active research on Transformers and their implementation in various applications, they have not yet become widespread for solving specific practical problems.
The paper presents a neural network system for recognizing sunflower diseases from photographs. The proposed system incorporates the latest Transformer architecture, specifically designed for precise detection of image features. During the preprocessing stage, the dataset is augmented with techniques such as normalization, standardization, horizontal and vertical flipping, center cropping, and image rotation. During the training stage of the BEIT neural network architecture, a modified crossentropy loss function is utilized. This function incorporates individually calculated weights for each class within the dataset. By employing this adjustment to the loss function, we can reduce the impact of imbalanced data and prevent the classification outcomes from being skewed towards classes with a high volume of images. The proposed complex has high accuracy, superior to known methods, due to the utilization of a bidirectional image encoder architecture and a modified cross-entropy loss function. The experimental results confirm the effectiveness of the proposed method compared to existing ones.
The rest of the work is organized as follows. The first and second sections present the background of the Bidirectional Encoder representation from Image Transformers model and a description of the proposed system. The third section presents the results of BEIT disease recognition and compares it with state-of-the-art approaches based on convolutional neural networks and well-known works. This is followed by Conclusion.
1. Presentation of a database of images of sunflower diseases
In 2022, a dataset on sunflower diseases was introduced, comprising 2358 original and updated images of various parts of sunflowers from Bangladesh [10]. One of the problems that sunflowers can face is gray mold. The fungus that causes gray mold attacks any part of flower- ing plants, preventing sunflower buds from opening and causing discoloration of mature flowers. As a result, the sunflower inflorescence begins to rot and die within 7–10 days. Another disease that can affect the growth and yield of sunflowers is leaf scarring caused by the fungus Septo-ria helianthi. This is a common plant disease that, although not posing a serious threat on its own, can be harmful when combined with other diseases. Scars damage tissues and can result in leaf wilting [18]. Another common sunflower disease is downy mildew, caused by the obligate parasite Plasmopara halstedii. This disease occurs in almost all countries where sunflowers are cultivated. In case of uncontrolled disease, yield losses can reach 3.5 % of the total, but if control measures are not taken, the probability of total yield loss is 100% [18]. Thus, these diseases pose a significant threat to sunflower cultivation, making their control and prevention crucial for the crop's safety.
The authors of [10] presented two versions of the dataset: 1668 original photographs and 2358 original and augmented images. To supplement the dataset, the authors utilized various augmentations, including image rotation, cropping the central fragment of the image, and more. In our work, we utilized an augmented dataset that was further expanded through various techniques, including normalization, standardization, resizing, cropping of the central fragment, rotating images by 180°, and displaying them vertically and horizontally. Examples of images from the four categories of the dataset are presented in Figure 1, and the distribution of the data is visualized in Figure 2. The image database was not further balanced.
c)
a)
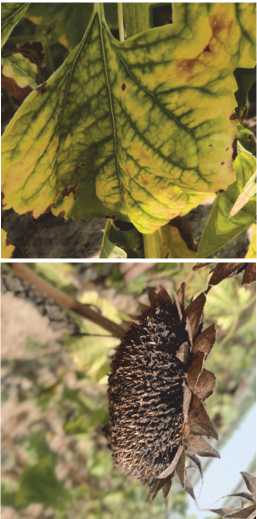
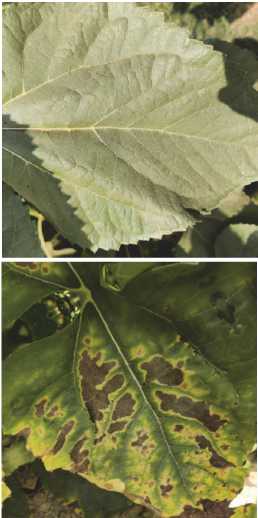
Fig. 1. Classes in the set of images of sunflower diseases [10]: a) downy mildew, b) fresh leaf, c) gray mold, d) leaf scars
d)
b)
2. Bidirectional Encoder representation from Image Transformers description
The input image x is encoded using BEIT to create contextualized vector representations. Their peculiarity lies in the fact that the vector of each feature depends on the context, as is the case with polysemous words in natural language. BEIT is pre-trained using a masked image modeling (MIM) task in a self-supervised learning mode. MIM uses two representations for each image (labels and visual features, or tokens) to reconstruct masked image fragments based on encoding vectors. The image is divided into 14 equal sections, called patches; some of them are masked and then transferred to the Transformer. The model learns to restore features of the original image in masked areas. The image xeRWxHxC is divided into N = WH/ R2 sections xreRnx(r2C), where N is number of sections, C is the number of channels, (W, H) is the size of the input image, and (R, R) is the size of each patch. Image fragments {x'}N1, where xr is a patch and i is its number, ie[1, ..., N], are smoothed into vectors and then linearly projected as word embeddings in BERT [19]. The raw pixels of the fragments are used as input features. So, for 224×224 image, there are 14×14 fragments of 16×16 size. Tokenization is the process of dividing data into parts, which are then embedded in a vector space. For images, splitting into fragments followed by encoding is applicable. So, each image is tokenized into a 14×14 grid. The number of image fragments after splitting it and the number of visual tokens is the same. The image tokenizer receives a sequence of discrete tokens representing the image. Thus, image fragment {x'}N of the image xeRWxHxc is represented by N tokens y = [y 1,.,yN]eEwxh, where E ={1, ..., |E|} is a vocabulary of discrete indices of size |E|=8192. When visually examining tokens, two modules are used: a tokenizer and a decoder. The tokenizer p^(y|x) maps image pixels x to discrete tokens y according to a dictionary. The decoder qv(y|x) reconstructs the input image x based on the visual tokens y. Thus, the recovery problem is represented as ®y~pф(уIx)[log q^(y|x)]. Since tokens are discrete, model training is non-differentiable. To train the model parameters, the Softmax function is used [20].
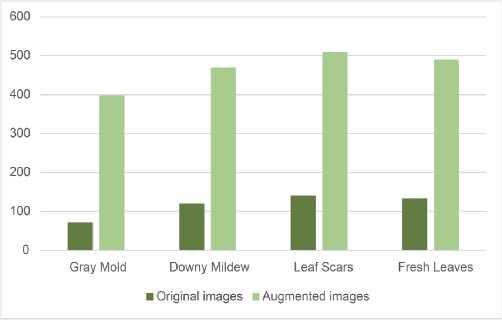
Fig. 2. Data balance in the sunflower disease image dataset
BEIT, like other Transformers, utilizes the selfattention-based architecture of the standard Transformer, which was developed for text data recognition [21]. As mentioned earlier, the input to the Transformer is represented by a sequence of image patches { x ' } ^ , linearly projected to produce the embeddings Ex ' , E e R Wx H x c .
Embeddings are representations of objects, such as images, intended to be used by machine learning models. They are vectors created by a neural network to capture meaningful data about each object. Next, a special token [ S ] and standard trained 1D embeddings E pos e R Nx D for fragment embeddings are added to the input sequence. Input vectors V 0 = [ e S ] , Ex ' , _ , Ex N ] + E pos are fed to the Transformer. The encoder contains L layers of Transformer blocks Vl = Transformer ( Vl –1 ), where l = 1,…, L . The output vectors of the last layer V L = [ v LS ] , v L ,...,v N ] are used as encoded representations for image fragments, where viL is the vector of the i -th image fragment (Figure 3).
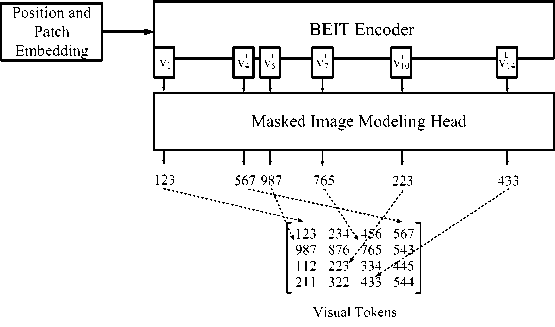
Fig. 3. Coding of fragments and the operational principle of masked image modeling head
To process image fragments, the MIM approach from [22] was used, which involves masking image fragments. A mask is applied to a certain percentage of image patches, completely hiding visual features, followed by the prediction of the corresponding visual tokens. The input image x is divided into N fragments { x ' } N = 1 . Let's to-kenize it into N visual tokens { x ' } N =1 . Following [22], 40% of the image fragments are masked and denoted as Я б {1,., N } 0'4 N . The masked patches are then replaced by a trained embedding e [ M ] G R d . Damaged image fragments x M = { x ' : i £ M} N = 1 u { e ^] : i e ^} N =1 are fed to the L -layer converter. The latent vectors { x ' } N = 1 , that is, the image patches by considering each token along with its neighbors, are considered as encoded representations generated by the model (Figure 4). For each masked patch position in the image { vL : i e M} N = 1 , a Softmax classifier is used to predict the corresponding visual tokens qMIM ( У ' Ix M ) = Softmaxy ‘ ( W cvL + b c ) , where x M is the damaged image masked according to M, Wc e R | E |x d ) and b c e R | E | . The goal of preliminary training is to maximize the logarithmic probability of correctly identifying visual tokens y i , while considering the damaged areas of the image:
max ^ E m £ log q MIM ( y i | x M ) ,
x e V
, ieM where D is the training dataset, M represents randomly masked image fragments, and xM is the distorted image.
The image patch masking algorithm at position M uses block masking. Each block has a minimum of 16 fragments. The aspect ratio of this block is chosen ran- domly. This algorithm is repeated until the number of masked patches is sufficient, specifically 0.4N, where N represents the total number of image patches, and 0.4 is the masking coefficient (equivalent to 40% of the total). Recovering pixels from masked areas for pre-training forces the model to focus on nearby dependencies and details [20] (Figure 4).
The attention layer receives three input vectors, called key, request, and value. The input sequence of vectors is passed to the encoder, which produces an encoded representation for each token, capturing its value and position. This value is passed to all three parameters: query, key, and value, including the attention score for each attribute. As it passes through all the encoders in the stack, each attention module also contributes its own attention scores to each token's representation. The concept of attention involves multiple layers of attention that occur simultaneously.
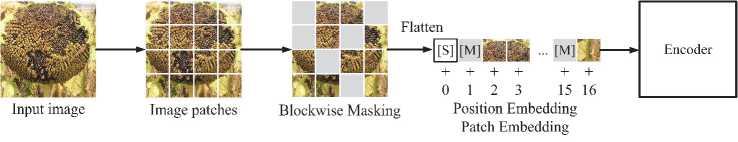
Fig. 4. Splitting an image into fragments and masking
3. Proposed based on BEIT system for sunflower diseases recognition
This section presents the parameters for training and testing the developed system and then presents the results of the work, assessed by various metrics. Pre-training of the BEIT model is similar to variational learning of an autoencoder. Let x be the original image, x the masked image, and z the visual tokens. From the log-likelihood proof p ( x | x ), recovering the original image from its corrupted version:
Z log p ( x | x ) >
( x i , x i ) eD
-
> Z (E- p . ( * ■ , ) [!og q * ( x , |y . )] - (2)
( x i , x i ) eD
-
- D kl [ p ф ( y | x i -) , q e ( y | xi ) ]),
where Eyi~pф(y|xi) [log q* (xi | yi)] - visual reconstruction of the token, p ф(у | x) - image tokenizer, q e(y| x) - decoding of the original image with consideration of input tokens, pe(z|x) - restoration of tokens based on the masked image. Model training is performed in two stages. At the first stage, an image tokenizer is obtained, and the reconstruction loss -Eyi~pф(yxi)[logq*(xi | yi-)] is minimized with a uniform prior (2). At the second stage, the a priori value of q e is studied. The values p ф and q v are constants. If p ф(У |xi) is simplified to a single-point distribution with the most probable tokens у i = arg max p ф( у | xi), then y equation (2) will take the form:
Z (E y . ~p * ( y x i ) [log q * ( x i | у )] + q e ( yi | xi ) ), (3)
(xi,xi )eD where log q в(у|xci) is the masked image modeling and the BEIT pre-training target (Figure 5).The BEIT architecture is based on a 12-layer Transformer with a hidden vector size of 768 and 12 attention heads. The default input patch size is 16×16. The authors of the BEIT architecture fully adopted the image tokenizer [20]. Since Transformer architectures exhibit low recognition accuracy when trained on small datasets, the solution is transfer learning [23]. BEIT is pretrained on the ImageNet-1K training set, which includes approximately 1.2 million images. An input image size of 224×224 is standard for BEIT.
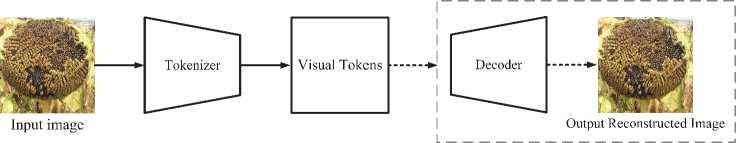
Fig. 5. General view of the BEIT architecture
Thus, the input image is divided into 14×14 fragments and an equal number of visual tokens. About 40% of image fragments are masked, which is approximately 75 patches. Training on the dataset [10] took 270 steps or 5 epochs, with a batch size of 32. The Adam optimizer [24] was used, which demonstrated improved accuracy following initial training. The Adam optimizer parameters P1 and p2 are the initial decay rates utilized in estimating the first and second moments of the gradient, which are exponentially multiplied at the conclusion of each training step. Tuning these parameters is necessary to smooth the path to convergence and also to provide momentum to overcome a local minimum or saddle point. The values P1 = 0.9, p2 = 0.999 were chosen empirically as the most suitable for solving the problem of image recognition. The learning rate is a neural network tuning parameter that instructs the optimizer on how far to adjust the weights in the direction opposite to the gradient for each learning step. With a high learning rate, there is a high probability of not achieving convergence in the vicinity of the global minimum; with a low learning rate, the likelihood of convergence and achieving high learning accuracy is higher, but it will require a significant amount of time. The learning rate is chosen to be low and equal to 5e–5.
For the image classification task, a basic linear classifier was utilized. Specifically, the mean values of the predictions are combined and inputted into the Softmax classifier. Class probabilities are calculated as
Softmax
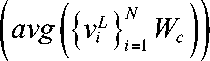
where viL represents the final encoding vector of the i -th image patch, W c g R d x c is the matrix of parameters, and C is the number of labels.
A saliency map was also compiled (Figure 6), illustrating the areas of the image that the neural network focuses on to search for features. The creation of such maps is analogous to a segmentation algorithm; it allows for exploring the main elements without focusing on irrelevant features. This map shows that BEIT is clearly focused on those parts of the image where signs of the disease are highly likely to be recognized.
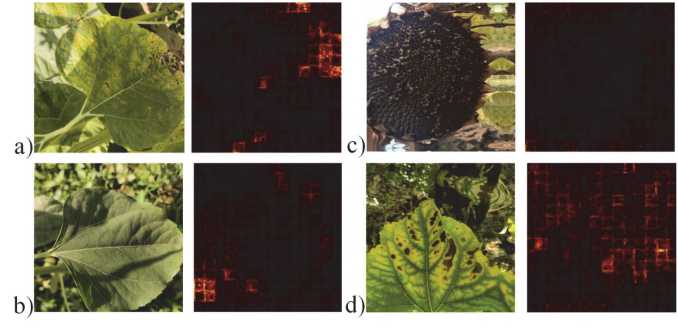
Fig. 6. Saliency map for images from the sunflower disease database: a) image of the “downy mildew” class; b) image of the “fresh leaf” class; c) image of the “gray mold” class; d) image of the “leaf scars” class
4. Cross-entropy loss function modified by weight coefficients
The problem of optimization-minimization of structural risks using machine learning is presented as follows:
n, xi is the input of training case i, h ц is the neural network model with weights ц. If there is a significant imbalance of data in the training set, the classifier will tend to prioritize the categories with the highest number of samples [27]. In the case of sunflower diseases, some diseases may appear similar, leading to incorrect diagnoses by the neural network [28]. To solve this problem, the optimal solution is to use unequal misclassification costs, which are defined as a cost matrix or weighting coefficients [29]. The cost of such errors is considered a penalty coefficient, which is introduced during training to penalize the neural network for incorrect classifications [30]. Thus, the classifier focuses on the data according to its distribution, which enhances a more comprehensive analysis. The calculation of the cost of training, denoted as dn, is inversely proportional to the frequency of categories in the database and follows the formula:
dn =
K
Nl >n ’
5. Results of proposed system realization
where N =4 represents the number of disease categories; p in – indicates that image i belongs to category n . Modifying the loss function by incorporating weighting coefficients enables the minimization of the impact of unbalanced data and helps prevent bias in classification results. A modification of the cross-entropy loss function using the weighting coefficients Cc ' e can be represented as follows:
NK
C ‘ =— V ll dc ■ l n ■ log ( h d x i ,n ) ) , (7)
K n =1 i =1
where d n is the weighting factor for category n .
The paper proposes a BEIT-based pattern recognition system for sunflower disease images. The architectures were trained on the dataset [10] using an HP LAPTOP-V45HU232 device with an Intel(R) Core(TM) i5-1035G1 processor. CPU 1.00 GHz in use. In the work, the data was divided as follows: 72% of the set was used for training, 8 % for validation, and 20% for testing. In [15], [31] the data division followed a classical approach, with 80% allocated to the training set and 20% to the test set. In [11], 70% of the image set was used for training, 15 % for validation, and 15 % for testing. The authors of [13] used 75 % of the dataset for training, 15 % for validation, and 10% for testing. In [14], 80% of the dataset was used for training, 10% for validation, and 10% for testing. Some authors used the original dataset consisting of 1668 images. In our work, we initially used a dataset that was supplemented by its authors with the help of augmentations. Data describing the division of the dataset in work [16] was not accessible due to restricted access.
During the training process, images of sunflower diseases from the training set were input into the developed system based on BEIT. The system output was passed through a Softmax layer to calculate the probabilistic dis- tribution of predicted labels for the 4 classes in the dataset. Next, the results were compared with the ground truth, and the error value was calculated using a modified cross-entropy loss function. The calculated weighting coefficients for each class to modify the cross-entropy loss function are presented in Table 2. The proposed method for modifying the cross-entropy loss function is superior to the built-in functionality for calculating losses because the weight is calculated individually for each class, considering the number of images in the sample.
Tab. 1. Division of the sunflower disease dataset [10] into training, validation, and test samples in the compared works
|
Method |
Train, % |
Validation, % |
Test, % |
|
Proposed |
72 |
8 |
20 |
|
[11] |
70 |
15 |
15 |
|
[13] |
75 |
15 |
15 |
|
[14] |
80 |
10 |
10 |
|
[15] |
80 |
0 |
20 |
|
[16] |
n/a |
n/a |
n/a |
|
[31] |
80 |
0 |
20 |
Tab. 2. Weight coefficients used to modify the cross-entropy loss function in a proposed system
|
Class |
Weight coefficient |
|
Downy mildew |
1.0508 |
|
Fresh leaf |
0.9538 |
|
Gray mold |
1.3191 |
|
Leaf scars |
0.9538 |
To assess the recognition accuracy of the image database, various criteria and metrics were used. F 1-score is calculated as:
F 1 score = 2 TP / ( 2 TP + FP + FN ) , (8)
where TP represents a true positive result, FP is a false positive result, and FN is a false negative recognition result. The F 1 range is [0, 1], where 1 indicates 100 % recognition accuracy, and 0 indicates no correctly recognized images. The Matthews Correlation Coefficient ( MCC ) belongs to the range [– 1, 1] and has the form:
MCC =
_________ TP x TN - FP x FN ________ J ( TP + FP )( TP + FN )( TN + FP )( TN + FN )
,(9)
where TN is the true negative recognition result. Specificity is used to evaluate the model's ability to predict the true negative labels of each category:
Sp = TN / ( TN + FP ) .
To evaluate the work, an assessment of the accuracy of solving the pattern recognition problem after training the neural network is used. Accuracy A is a measure that calculates the proportion of correctly classified images out of the total number of objects in the dataset:
A = TP / ( TP + TN ) .
Table 3 presents the image recognition accuracy values of various architectures, training loss, and data for comparison with known methods. According to the results obtained and presented in the table, the proposed approach based on the Transformers architecture outperforms known architectures by 2.76 – 17.66 % in accuracy, 0.0264 in the F1-score metric, and 0.0267 in the Specificity metric, surpassing known architectures.
Figure 7 shows the confusion matrices of the proposed method and established approaches. Difficulties arose in recognizing categories leaf scars and downy mildew, which is associated with the visual similarity of these diseases, as can be seen in Figure 1. The other two categories, gray mold and healthy leaves, were recognized without errors. Based on the results obtained, we can conclude that the diseased plant was identified in 100% of cases. In comparison with known methods, the proposed system enabled the correct classification of a greater number of images of sunflower diseases.
The recognition results of the proposed sunflower disease image database system demonstrate the advantage of utilizing the Bidirectional Encoder representation from Image Transformers architecture. The proposed system demonstrated higher accuracy compared to existing methods and outperformed contemporary deep convolutional neural networks by 2.76 – 17.66 % in terms of accuracy. Based on the results obtained, we can conclude that the utilization of the proposed system, which is based on the Transformers architecture, can significantly enhance the accuracy of recognizing and classifying sunflower diseases from their images.
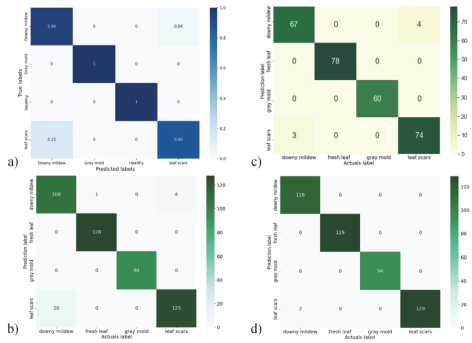
Fig. 7. Confusion matrix of the proposed and known methods: a) method [14]; b) method [11]; c) ResNet101 architecture; d) proposed method
6. Conclusion
In the presented work, an image recognition system for sunflower diseases was proposed based on the Bidirectional Encoder representation from Image Transformers architecture. BEIT outperformed state-of-the-art deep neural network architectures such as ResNet101, InceptionV3, and DenseNet201 in classification accuracy by 2.76–17.66%. The high accuracy of image database recognition demonstrates the advantage of utilizing the system described in the work in the field of crop production. The proposed system will assist farmers and food producers in promptly identifying sunflower diseases across large planting areas and taking timely measures to treat plants. This will help reduce crop losses. A promising direction for further research is to ex- pand the proposed approach based on Visual and Image Transformers for the recognition and classification of a broader range of photographs depicting sunflower diseases or other sets of images of plant diseases.
Tab. 3. Accuracy of recognizing a dataset of sunflower diseases [10], obtained as a result of using the proposed method and known approaches with various architectures and methods
|
Method/Architecture |
Accuracy |
F 1-score |
MCC |
Specificity |
|
Proposed |
0.9957 |
0.9959 |
0.9943 |
0.9958 |
|
[14] |
0.9894 |
- |
- |
- |
|
[13] |
0.9788 |
- |
- |
- |
|
[11] |
0.9760 |
0.9760 |
- |
- |
|
Resnet101 |
0.9681 |
0.9695 |
0.9574 |
0.9691 |
|
EfficientnetB3 |
0.9638 |
0.9625 |
0.9523 |
0.9604 |
|
InceptionV3 |
0.9638 |
0.9264 |
0.9037 |
0.9293 |
|
MobileNetV3 |
0.9617 |
0.9635 |
0.9500 |
0.9648 |
|
Resnet50 |
0.9580 |
0.9609 |
0.9467 |
0.9592 |
|
[16] |
0.9527 |
- |
- |
- |
|
[15] |
0.9500 |
- |
- |
- |
|
Densenet121 |
0.9426 |
0.9449 |
0.9231 |
0.9455 |
|
[31] |
0.9300 |
0.9300 |
0.9000 |
- |
|
Resnet34 |
0.9234 |
0.9254 |
0.8993 |
0.9255 |
|
Densenet201 |
0.8191 |
0.0913 |
0.6999 |
0.0671 |
Acknowledgements
The authors express their gratitude to NCFU for the support of small scientific groups and individual scientists. Research was conducted with the support of the Russian Science Foundation (project No. 23-71-10013).
