Brain Tumor Boundary Detection by Edge Indication Map Using Bi-Modal Fuzzy Histogram Thresholding Technique from MRI T2-Weighted Scans

Author: T. Kalaiselvi, P. Sriramakrishnan, P. Nagaraja
Journal: International Journal of Image, Graphics and Signal Processing(IJIGSP) @ijigsp
Article in issue: 9 vol.8, 2016.
Free access
Tumor boundary detection is one of the challenging tasks in the medical diagnosis field. The proposed work constructed brain tumor boundary using bi-modal fuzzy histogram thresholding and edge indication map (EIM). The proposed work has two major steps. Initially step 1 is aimed to enhance the contrast in order to make the sharp edges. An intensity transformation is used for contrast enhancement with automatic threshold value produced by bimodal fuzzy histogram thresholding technique. Next in step 2 the EIM is generated by hybrid approach with the results of existing edge operators and maximum voting scheme. The edge indication map produces continuous tumor boundary along with brain border and substructures (cerebrospinal fluid (CSF), sulcal CSF (SCSF) and interhemispheric fissure) to reach the tumor location easily. The experimental results compared with gold standard using several evaluation parameters. The results showed better values and quality to proposed method than the traditional edge detection techniques. The 3D volume construction using edge indication map is very useful to analysis the brain tumor location during the surgical planning process.
Medical imaging, brain tumor, fuzzy histogram, edge indication map, 3D volume construction
Short address: https://sciup.org/15014015
IDR: 15014015
Text of the scientific article Brain Tumor Boundary Detection by Edge Indication Map Using Bi-Modal Fuzzy Histogram Thresholding Technique from MRI T2-Weighted Scans
Published Online September 2016 in MECS
Medical imaging provides a reliable source of information of the human body to the clinician for use in fields like reparative surgery, radiotherapy treatment planning, stereotactic neurosurgery etc. [1]. The diagnosis of human being organs has been improved significantly with the arrival of Computed Tomography (CT), Magnetic Resonance Imaging (MRI) and Positron Emission Tomography (PET) techniques. MRI is the preferred procedure for diagnosing a large number of potential problems or abnormal conditions in many different parts of the body. MRI is a non-destructive testing technique and safe modality for medical imaging that uses the magnetic field and pulses of radio waves [2].
(a)
(b)
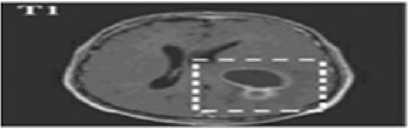
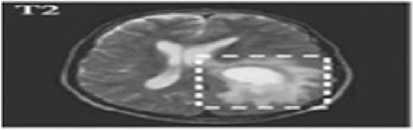
Fig.1. (a) Brain tumor in T1 weighted (b) Brain tumor in T2 weighted
It gives better visualization of soft tissue in human body. In general, MRI creates images that can show differences between healthy and unhealthy tissues. Physicians use MRI to examine the brain, spine, joints (e.g., knee, shoulder, hip, wrist and ankle) abdomen, pelvic region, breast, blood vessels, heart and other body parts [3].
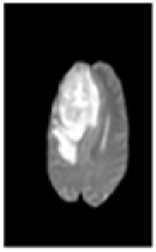
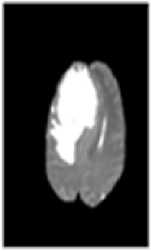
Two types of MRI brain images used in common as T1 weighted and T2 weighted. The normal MRI brain image contains major three components as white matter (WM) tissues, gray matter (GM) tissues and cerebrospinal fluid (CSF) [4]. T1-weighted provides good contrast between WM tissues in light gray and GM in dark gray, while CSF is void of signal as black intensity. T2-weighted provides good contrast between CSF (bright) and brain tissues (dark). A brain tumor is abnormal tissues growth in the brain. The abnormal MRI brain image having an additional region as tumor exhibits mixed intensities levels in T1-weighted and hyper intensities in T2-weighted [5] as shown in Fig. 1. Brain tumors classified as two major type as: benign (non-cancerous) called primary brain tumor and malignant (cancerous) called as secondary brain tumor [6]. A benign tumor does not contain cancer cells and once removed, does not reappear. Most benign brain tumors have clear borders without having any surrounding tissues. Malignant brain tumors contain cancer cells. Malignant brain tumors does not have clear boundary because they occupy by surrounding tissues like edema, active tumor and necrotic [7]. Tumor boundary detection is very sensitive during the surgical processes. Normal brain tissues considered as tumor cells during surgery might affect the entire brain functionality. In otherwise, the left over tumor tissues cause some risk. So the exact tumor boundary, the border between normal and abnormal brain tissues, detection is necessity of the surgical process.
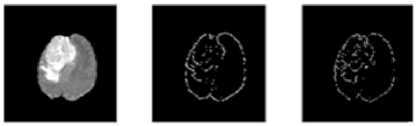
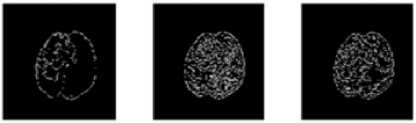
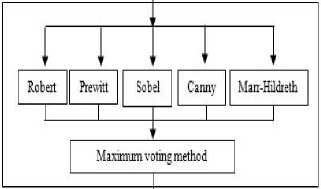
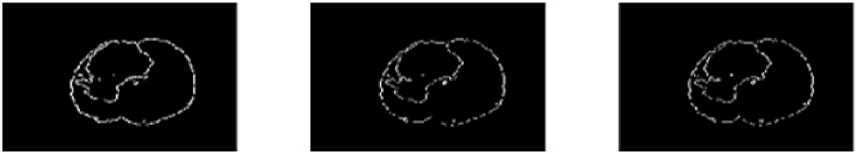
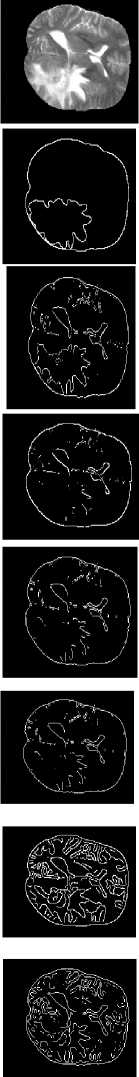
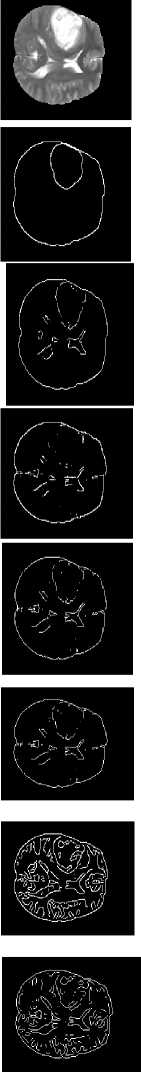
In digital images, the edge occurs when intensity changes abruptly. Each traditional edge detector has their own property to detect the intensity variation from neighborhood pixels. In some kind of edge detectors, known edges were not shown in the result and removing the spurious edge is very tedious [8]. One major challenge in the brain tumor boundary detection process is they do not have clear boundaries because they sometimes surrounded by tumor substructures. The popular well known edge operators are directly applied to T2 weighted image to target the tumor boundary and the results are shown in Fig. 2.The tumor boundary is not clearly obtained using traditional edge detectors like Robert, Prewitt, and Sobel. More number of false edges occurred in the result of Canny and Marr-Hildreth.
The proposed work focused to extract brain tumor boundary along with brain substructures like CSF, sulcal CSF (SCSF) and interhemispheric fissure to 3D volume construction and visualization. The proposed method is initiated by bimodal fuzzy histogram thresholding for obtaining the threshold value. Then the threshold is used by piecewise linear transformation for enhancing the tumor region. Next the edge indication map (EIM) was generated by applying the maximum voting scheme on results of various edge operators. The EIM has given tumor boundary in relative to brain border and some of its
(a) (b) (c)
(d) (e) (f)
Fig.2. Output of MRI brain image using various edge detection operators (a)Original image (b) Robert (c) Prewitt (d) Sobel (e) Canny (f) Marr- Hildreth substructures. Evaluation parameters are used for comparing proposed method with gold standard and standard edge detection methods. Finally EIM based 3D volume construction done using 3D doctor [9].
This paper includes the section II as literature survey. The section III contains methodology of proposed work. Section IV has the evaluation parameters. Section V contains results and discussion. Section VI concludes the paper.
-
II. Related Work
Several methods have been developed in brain image segmentation [10] [11] [12]. K. Somasundaram and T. Kalaiselvi [13] proposed a technique to detect the tumor from MRI head scans. They segmented the brain into regions like WM, GM, CSF and background using FCM algorithm. They used extended maxima transform for separating the tumor region from the normal CSF region. Sabbih et al., [14] summarized the comprehensive review of the methods and techniques used to detect the brain tumor through MRI image segmentation. Kalaiselvi et al., [15] present a fusion based technique that produced robust and fully automatic tumor extraction for magnetic resonance images (MRI) of Head scans. They used three popular deformable methods, snake, level set and distance regularized level set for predicting their performance in generating the brain tumor boundaries. A work done by Zolqernine et al., [16] summarized the comparison of Canny and Sobel edge detection in MRI images. Sobel method used with 3 x 3 masks while canny used adjustable mask. They proved that Sobel edge detection method cannot produce smooth and thin edge compared to Canny method.
Kalaiselvi et al., [17] finding the brain contours to detect the boundary between the hemispheres to joining the edges of the two portions of cleft that corresponds to inter-hemispheric fissure present in the contour. The detected boundary is used to separate the cerebrum into two hemispheres and thus found the tumor location. A work done by Subhro and Ardhendu [18] summarized the edge detection techniques and differentiate their efficiency based on their finding suitable to meaningful edges of medical images. Xie et al., [19] proposed a method to detect the boundary of tumor by using the Canny edge detection algorithm and labeling the 8-connected edge with a different number. Then the histogram plotted based on the size of the edge. Finally the weak edge detected by the histogram segmentation is used to find the brain tumor edge. A work done by Riries and Khusnul [20] detecting the brain tumor edge, using the techniques Robert, Prewitt and Sobel method. In this method, they analyzed the best among three, based on their mean and standard deviation value. From the three Sobel method gave the smaller standard deviation value and produced the good pattern of brain tumor.
A work done by Manoj et al., [21] proposed a new method for edge detection using Cellular Automata. The Cellular Automata rule provides strong and continuous edge detection. The proposed method provided the clear, fine and continuous edges and also no extra pixels detected in brain tumor. A work done by Mamta and Parvinder [22] summarized the edge detection techniques and its performance by studying the edge maps relative to each other through statistical evaluation. They used the first order derivative based edge detection (Gradient Method) and second order derivative based edge detection (Laplacian based edge detection). A statistical approach done by Amiya et al., [23] proposed a method which based on the neighborhood pixels using a predefined intensity range and simple statistical approach. In this approach, they determined all edge pixels of image and removed noise from the output edge map.
-
III. Proposed Method
The flowchart of the proposed work is given in Fig. 3. The proposed work has two major steps. Initially step 1 is aimed to enhance the contrast in order to make the sharp edges. An intensity transformation is used for contrast enhancement with automatic threshold value produced by bimodal fuzzy histogram thresholding technique. Next in step 2 the EIM is generated by hybrid approach with the results of existing edge operators and maximum voting scheme. Since the work is histogram based the unwanted non-brain portion are removed initially. This is known as brain extraction process and done by BEA [24]. The extracted brain is then focused for further processing like intensity transformation and edge detection. The intermediate techniques like histogram smoothing, bimodal fuzzy histogram thresholding, piecewise linear transformation and edge indication map are explained in the following section.
-
A. Histogram Smoothing
For an image I with size M × N and L number of gray levels, the histogram can be expressed as:
н
—
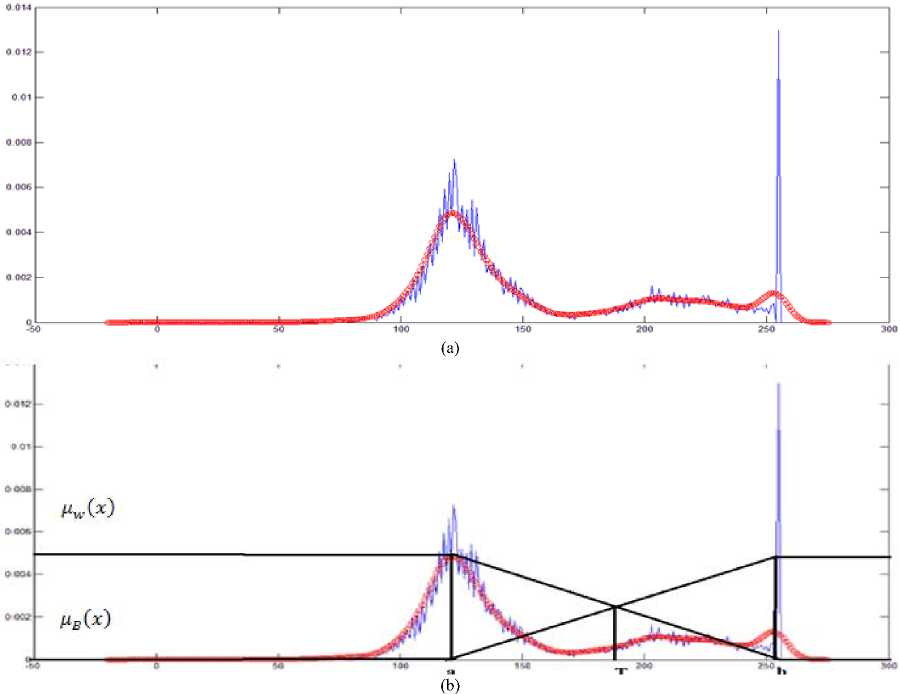
where, Н is the histogram vector, ht is number of pixels of gray level i and L ismaximum number of possible gray levels in the image. Original histogram has more number of peaks. Histogram smoothing is done by Gaussian distribution expressed as:
_ (X- Ц) 2 f (x| u, o2) ——e 2 - 2 (2)
where, µ is the mean and σ2 is variance with the default values (0, 5) is given in Fig. 4 (a). Tumor region and CSF having higher intensities in the T2 weighted MRI than other tissues. GM and WM are lesser gray levels than tumor region. Fuzzy bimodal thresholding produces threshold value based on top two peak values from the histogram. One peak coming from tumor and CSF region another one is from GM and WM region as shown in Fig. 4(b).
-
B. Bimodal Fuzzy Histogram Thresholding
Fuzzy logic was proposed in 1965 by Zadeh in his research Fuzzy Sets [25]. Zadeh defined the fuzzy sets and fuzzy logic in additional the membership function which assign each grade to a value between one and zero and introduced the theoretical background. This thresholding method required two membership function based on two peak value from the histogram. The bimodal fuzzy histogram thresholding on the sample image is shown in Fig. 4(b).
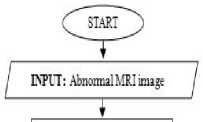
Brain extraction process
I
Brain portion image
Histogram smoothing using Gaussian distribution
Bimo dal fuzzy histogram thresholding
Step 1: Image Enhancement
Piecewise Linear Transformation
Enhanced image
Step 2: Edge Indication Map Construction
OUTPUT: 2D slices oftumor boundary along with brain border and substructures

Fig.3. Flow Chart for Proposed Method
The histogram is approximated into two membership functions; nw (x) which measure the white membership value and цв (x) which measure how much is the pixel black [26].The value of T can be found in different ways of which is the intersection of the two lines of the membership functions. The membership function can be derived from the Fig. 4(b) is as follow:
ц ^ С^) —
Jx-b ( m xb
|
Method |
P CO |
P ND |
P FA |
FOM |
D4 f2 |
Sensitivi ty |
Specific ity |
Accur acy |
|
Propose d |
0.30 52 |
0.6570 |
0.6566 |
0.7117 |
1.2018 |
0.3204 |
0.9835 |
0.9661 |
|
Robert |
0.16 40 |
0.8196 |
0.8072 |
0.6144 |
1.4761 |
0.1675 |
0.9798 |
0.9575 |
|
Prewitt |
0.24 14 |
0.7320 |
0.7072 |
0.6392 |
1.3250 |
0.2499 |
0.9822 |
0.9613 |
|
Sobel |
0.23 99 |
0.7351 |
0.6856 |
0.6161 |
1.3273 |
0.2480 |
0.9828 |
0.9613 |
|
Canny |
0.16 71 |
0.8328 |
0.4531 |
0.2764 |
1.4569 |
0.1671 |
0.9878 |
0.9228 |
|
Marr- Hildreth |
0.11 41 |
0.8858 |
0.7249 |
0.3476 |
1.5884 |
0.1141 |
0.9812 |
0.9310 |
Table 2. Evaluation parameters for Low Grade BRATS 2012 10 volumes
|
Method |
P CO |
P ND |
P FA |
FOM |
D4 f2 |
Sensitivity |
Specificity |
Accuracy |
|
Proposed |
0.2836 |
0.6864 |
0.6359 |
0.6604 |
1.2347 |
0.2978 |
0.9887 |
0.9731 |
|
Robert |
0.1729 |
0.8249 |
0.7668 |
0.5817 |
1.4615 |
0.1734 |
0.9865 |
0.9674 |
|
Prewitt |
0.2397 |
0.7533 |
0.6711 |
0.6124 |
1.3273 |
0.2423 |
0.9881 |
0.9711 |
|
Sobel |
0.2402 |
0.7543 |
0.6684 |
0.6041 |
1.3280 |
0.2425 |
0.9889 |
0.9699 |
|
Canny |
0.1568 |
0.8431 |
0.4160 |
0.2415 |
1.4773 |
0.1568 |
0.9921 |
0.9313 |
|
Marr- Hildreth |
0.0995 |
0.9004 |
0.7214 |
0.3031 |
1.6223 |
0.0995 |
0.9869 |
0.9397 |
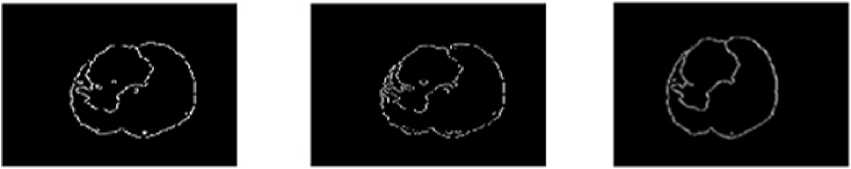
BBRATS_T2_LG1 BBRATS_T2_LG BBRATS_T2_LG BBRATS_T2_HG2
1 8 4 4
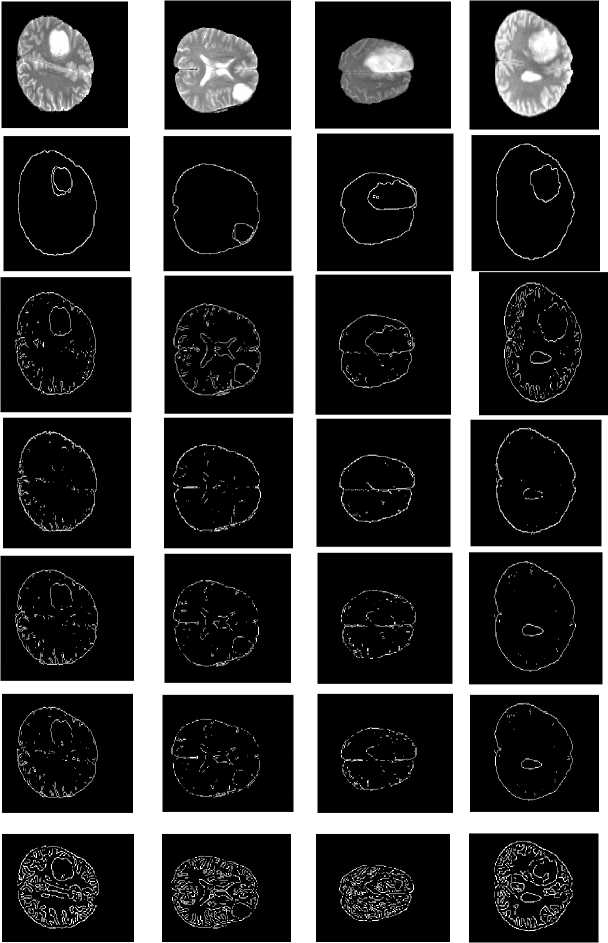


Gold standard
Propose d EIM method
Robert
Prewit
Canny
Marr-Hildreth
Image source
Original Image
Sobel
Fig.7. Proposed methods compared with existing edge detection methods for a set of sample slices selected from BRATS 2012 datasets
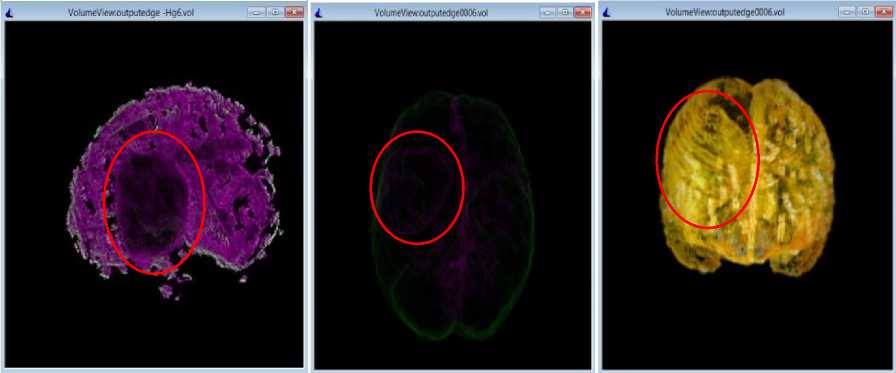
Fig.8. 3D volumes constructed from the results of proposed method for BRATS_HG4 dataset
-
VI. Conclusions and Future Enhancement
Tumor boundary detection is very important process in medical surgical procedure. The proposed work is knowledge based automatic brain tumor boundary detection using fuzzy based histogram and EIM from T2 weighted volumes. This work produced the effective tumor boundary in the abnormal T2-weighted MRI brain image. This method gives better results than standard edge detection techniques. The method also yields tumor border along with brain substructures. This may be helpful to surgeon to reach the exact tumor location. In future, the work is focused to extract the border of edema, active tumor and necrosis for 3D volume construction.
References Brain Tumor Boundary Detection by Edge Indication Map Using Bi-Modal Fuzzy Histogram Thresholding Technique from MRI T2-Weighted Scans
- T. Kalaiselvi, Brain Portion Extraction and Brain Abnormality Detection from Magnetic Resonance Image of Human Head Scans, Pallavi Publications South India Pvt. Ltd, 2011.
- Jerry L. Prince, Jonathan Links, Medical Imaging Signals and Systems, Pearson Prentice Hall, 2006.
- Amit Mehndiratta, Frederik L Giesel, Brain Tumor Imaging, Chapter-2 Diagnostic Techniques and Surgical Management of Brain Tumors, 2011.
- T. Kalaiselvi and K. Somasundaram, "Knowledge based Self Initializing FCM Algorithms for Fast Segmentation of Brain Tissues in Magnetic Resonance Images", International Journal of Computer Applications, vol. 90, no. 14, pp.19-26, 2014.
- Nelly Gordillo, Eduard Montseny and Pilar Sobrevilla, "State of the art survey on MRI brain tumor segmentation", Magnetic Resonance Imaging, vol. 31, no. 8, pp. 1426-1438, 2013.
- Evangelia I. Zacharaki, Sumei Wang, Sanjeev Chawla, Dong SooYoo, Ronald Wolf, Elias R. Melhem, and Christos Davatzikosa, "Classification of brain tumor type and grade using MRI texture and shape in a machine learning scheme", Magnetic Resonance in Medicine, vol. 62, no. 6, pp. 1609–1618, 2009.
- AI Baba and C. Catoi, Comparative Oncology, Chapter 3 Tumor Cell Morphology, The Publishing House of the Romanian Academy, 2007.
- Manoj Diwakar, Pawan Kumar Patel and Kunal Gupta, "Cellular Automata Based Edge-Detection For Brain Tumor", International Conference on Advances in Computing, Communications and Informatics (ICACCI), pp.53 – 59, 2013.
- 3D Doctor, Software purchased under DST project sanction, Principle Investigator, Dr. T. Kalaiselvi, Department of Computer Science and Applications, Gandhigram Rural Institute.
- Anam Mustaqeem and Ali Javed,Tehseen Fatima, "An Efficient Brain Tumor Detection Algorithm Using Watershed & Thresholding Based Segmentation", International Journal of Image, Graphics and Signal Processing(IJIGSP), vol. 10, 34-39, 2012.
- T. Kalaiselvi and K. Somasundaram, "Fuzzy c-means technique with histogram based centroid initialization for brain tissue segmentation in MRI of head scans", International Symposium on Humanities, Science and Engineering Research, pp. 149-154, 2011.
- Jasdeep Kaur and Manish Mahajan, "Hybrid of Fuzzy Logic and Random Walker Method for Medical Image Segmentation", International Journal of Image, Graphics and Signal Processing (IJIGSP), 2, pp. 23-29, 2015. DOI: 10.5815/ijigsp.2015.02.04
- K. Somasundaram and T. Kalaiselvi, "Automatic Detection of Brain Tumor from MRI Scans using Maxima Transform", National Conference on Image Processing, vol. 1, pp. 136-141, 2010.
- Mohammed sabbihhamoud al-tamimi and Ghazalisulong, "Tumor Brain Detection through MR Images: A Review of Literature", Journal of Theoretical and Applied Information Technology, vol. 62, no. 2, pp. 387-403, 2014.
- T. Kalaiselvi, K. Somasundaram and S. Vijayalakshmi, "A Novel Self Initiating Brain Tumor Boundary Detection for MRI", International Conference on Mathematical Modeling and Scientific Computation – ICMMSC12, CCIS 283, pp. 464-470, 2012.
- Zolqernine Othman, Habibollah Haron and Mohammed Rafiq Abdul Kadir, "Comparison of Canny and Sobel Edge Detection in MRI Images", Post Graduate Research Seminar, pp. 133-136, 2014.
- T. Kalaiselvi and K. Somasundaram, "A Novel Technique for Finding the Boundary between the Cerebral Hemispheres from MR Axial Head Scans", 4th Indian International Conference on Artificial Intelligence – IICAI-09, pp. 1486-1502, 2009.
- Subhro Sarkar and Ardhendu Maindai, "Comparison of Some Classical Edge Detection Techniques with their Suitability Analysis for Medical Images Processing", International Journal of Computer Sciences and Engineering, vol. 3, no. 1 pp. 81-87, 2015.
- Xie Mei, Zhen Zheng, Wu Bingrong and Li Guo, "The Edge Detection of Brain Tumor", International Conference on Communications, Circuits and Systems ICCCAS, pp. 477-479, 2009.
- Riries Rulaningtyas and Khusnul Ain, "Edge Detection for Brain Tumor Pattern Recognition", International Conference on Instrumentation, Communication Information Technology and Biomedical Engineering, pp. 1-3, 2009.
- Manoj Diwakar, Pawan Kumar Patel and Kunal Gupta, "Cellular Automata Based Edge-Detection for Brain Tumor", International Conference on Advances in Computing, Communications and Informatics (ICACCI), pp. 53 – 59, 2013.
- Mamta Juneja and Parvinder Singh Sandhu, "Performance Evaluation of Edge Detection Techniques for Images in Spatial Domain", International Journal of Computer Theory and Engineering, vol. 1, no. 5, pp. 614-621, 2009.
- Amiya Halder, Nilabha Chatterjee, ArindamKar, Swastik Pal and Soumajit Pramanik, "Edge Detection: A Statistical approach", International Conference of Electronics Computer Technology, vol. 2 pp. 306-309, 2011.
- K. Somasundaram and T. Kalaiselvi, "Fully Automatic Brain Extraction Algorithm for Axial T2-Weighted Magnetic Resonance Images", Computers in Biology and Medicine, vol. 40, no. 10, pp. 811-822, 2010.
- L. A. Zadeh, "Fuzzy sets", Information and Control, 8, pp. 338-353, 1965.
- A. Mohammad and N. Al-Azawi, "Image Thresholding using Histogram Fuzzy Approximation", International Journal of Computer Applications, vol. 83, no.9, pp. 36-40, 2013.
- T. Kalaiselvi, P. Sriramakrishnan and R. Vasanthi, "Brain Tumor Boundary Detection from MRI Brain Scans using Edge Indication Map", Proceedings of National Conferences on New Horizons in Computational Intelligence and Information Systems (NHCIIS), vol. 1, pp. 154-155, 2015.
- I. A. Abdou and W. Pratt, "Quantitative design and evaluation of enhancement / thresholding edge detectors", Proceedings of the IEEE, vol. 67, no. 5, pp. 753–766, 1979.
- BRATS 2012 database, http://www2.imm.dtu.dk/projects/BRATS2012/, last accessed 4th Feb 2016.
