Breast lesion segmentation and area calculation for MR images

Author: Gökçen Çetinel, Sevda Gül
Journal: International Journal of Image, Graphics and Signal Processing @ijigsp
Article in issue: 10 vol.10, 2018.
Free access
In this paper, our goal is to determine the boundaries of lesion and then calculate the area of existing lesion in breast magnetic resonance (MR) images to provide a useful information to the radiologists. For this purpose, at first stage region growing (RG) method and active contour model (Snake) is applied to the images to make the boundaries of lesion visible. RG method is one of the simplest approaches for image segmentation and provides accurate results with lower computation time due to its seed point initialization step. Snake method molds a closed contour to the boundary of a region in an image and is also popular in medical image segmentation studies. In the presented study, both of these methods are utilized to determine the lesion boundaries. After determining the boundaries of lesion accurately in the second stage of the study, bit-quad method is applied to the segmented images. Bit quad method is used to compute the area and perimeter of binary lesion images based on matching the logical state of regions of image to binary patterns. Finally, to evaluate the performance of the proposed study, computer simulations are performed. It is demonstrated via computer simulations that the lesion area and parameter values are very close to real values. By means of this study it is aimed to support radiologists during diagnosis and assessment of breast lesions.
Breast cancer, lesion segmentation, region growing, snake algorithm, bit-quad method
Short address: https://sciup.org/15015999
IDR: 15015999 | DOI: 10.5815/ijigsp.2018.10.01
Text of the scientific article Breast lesion segmentation and area calculation for MR images
Published Online October 2018 in MECS
Nowadays, the number of women which expose to breast cancer is increasing. Breast cancer rates of Asia, U.S. and Canada are 39%, 15% and 8%, respectively. In Turkey, it is reported that one of every four women is diagnosed as breast cancer [1, 2].
Breast cancer can roughly be defined as an uncontrolled growth of deformed breast cells. Various modalities such as magnetic resonance imaging (MRI), ultrasound and mammography are used to diagnose breast cancer. Among these methods, magnetic resonance imaging is more preferred modality in recent years because of providing detailed information about breast lesions [3, 4]. As a result of this, there exist various studies about breast MRI, such as automatically detecting and classifying breast lesions.
In [5], the authors used a method for segmenting color images based on region growing and merging. The presented method is tested on the Berkeley Database which has a collection of 12,000 manually labeled segmentations of 1,000 Corel dataset images from 30 human subjects. It is shown that the method is very effective for segmenting color images and robust to the variations in color images. In [6], Han and friends proposed an automatic segmentation method for segmentation of mammography images. A total of 40 mammograms which contain biopsy-proven lesions are included to study from Mammographic Image Analysis Society (MIAS). According to the results 36 lesions are correctly segmented which means that the true positive rate of the method is 90%. Seed Region Growing (SRG) based on Particle Swarm Optimization (PSO) image clustering method is discussed in [7]. The aim of this study is to perform breast tumor segmentation on MR images taken from RIDER breast MRI dataset. The simulation results show that the proposed algorithm outperforms the existing segmentation approaches. In [8] Kansal and Jain touch on the choice of the seed points problem encountered in region growing algorithms. For this purpose, the authors proposed an automatic seed selection algorithm based on the information of the image. According to the simulation results, the proposed method provides better segmentation results and overcomes the over/ under segmentation problem. In [9], automated region growing algorithm is applied to diagnose benign and malign breast tumors scanned by a mammography device. To this end, artificial neural network (ANN) and cellular neural network (CNN) are utilized. Multifarious classifiers such as, naïve Bayes, random forest, support vector machines (SVM) and k-nearest neighbor (k-NN) are used to evaluate the performance of the proposed method. The sensitivity, specificity and accuracy rates are calculated as 95.94%, 96.87%, and 96.47%, respectively. Finally, bit-quad method discussed in [10] can be refereed to calculate the area and perimeter values of the segmented lesions. This method computes the area and perimeter of binary patterns based on matching the logical state of image regions to binary patterns. In addition, there are evaluable studies which propose and utilize segmentation techniques in biomedical image processing applications. Some of these studies are briefly mentioned below.
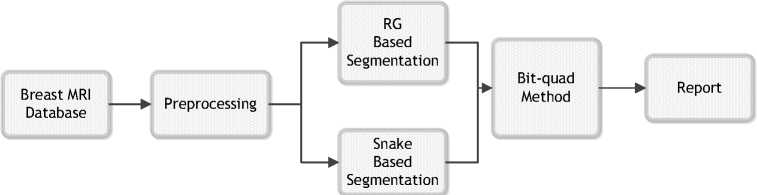
Fig. 1 Flow chart of the proposed study
In [11], authors emphasize the importance of image segmentation process. They propose two algorithms: normalized self-correlation function (NSCF) based algorithm and piecewise image segmentation (PIS) algorithm. The simulation results show that the presented algorithms can be applied for image segmentation and they perform well. In another study given in [12], automatic segmentation and detection of brain tumors in MRI is aimed. The authors compare the performance of existing methods such as improved Fuzzy C-Means clustering (FCMC) and marker controlled watershed algorithm with their algorithm. They show that the proposed algorithm provides better results for segmentation and detection of tumor in multimodal brain MR images. In [13], recognition of abnormal (cancerous) blood cells is targeted. K-means method based system is developed to achieve this goal. According to the experimental results, developed system helps hematologists to monitor the evaluation of cancerous blood cells and make a correct diagnosis. In addition, the performance of snake algorithm for breast ultrasound image segmentation is investigated in [14]. This study aims to detect breast tumors and distinguish them as benign and malignant. The authors obtain the accuracy of Balloon Snake as 95.71% for breast masses segmentation. Then they used semi- automated characterization (SAC) method to characterize the masses as benign and malignant. The paper given in [15] discusses the details of snake algorithm. Furthermore, applications of snake such as cell image segmentation, brain image segmentation and cardiac image segmentation are demonstrated in the study.
In this study our goal is to calculate the area of segmented lesions through using bit-quad method after determining the boundaries of breast lesions by RG and snake algorithms and to. The seed points of RG algorithm are chosen manually according to the location of lesion. The RG applied images converted to the binary images by thresholding in which the threshold value is chosen as the sum of mean and standard deviation of corresponding image. On the other hand, snake algorithm is applied to the breast MR images. Initial search area is identified by the user. Final lesion area is attained with the external and internal forces in the snake method, automatically. Similar to that of the RG, segmented images are thresholded to make them proper to implement the bit quad method. Finally, dimensions of the lesion are calculated by performing bit quad method. The reminder of paper is organized as follows: In Section II, used breast MR database is introduced. The flow chart of the proposed study is also illustrated in this section. In Section III, the main steps of region growing and snake methods are given in details and bit-quad method used for area and perimeter calculation is explained briefly. In Section IV, simulation results are shown to evaluate the performance of the proposed study. Finally, Section IV concludes the paper.
-
II. Proposed Study
In this section flow chart of the proposed study is depicted and is explained to make the main steps of the study understandable
-
A. Flow Chart of the Proposed Study
The block diagram of the study is shown in Figure 1. Firs, we need to build database. The breast MR database construction is explained in the following subsection. In second step of the study breast MR images taken from STATdx are prepared to apply segmentation process. Undesired parts of the images such as arrows and text are cleaned. This step is referred as preprocessing.
The third step of the system is segmentation. We applied two individual segmentation methods as illustrated in the figure. Before running RG and snake methods, initial seed point for RG and initial search area for snake is chosen according to the location of lesion, manually. Then both methods are performed to determine the lesion boundaries, independently. The output images of RG and snake are thresholded to make them appropriate for area calculation. Threshold value is chosen as the sum of mean and standard deviation of corresponding image. If the pixel value is under the threshold value, new pixel value is equalized to zero otherwise it is equalized to one. By this way, the output images of segmentation process are binary images. Bitquad method is applied to binary images to calculate the area of the lesion. Finally, a valuable information for radiologists that includes the perimeter, area and circularity of the lesion is provided.
-
B. Database
In the presented study, we consulted to Diagnostic Decision Support for Radiology (STATdx), that includes over 200.000 searchable images including X-ray, computed tomography (CT), MR and ultrasound images, to construct the breast MR database. In STATdx, database description gives case notes and annotations from renowned expert in that field. All cases include numerous labeled images. Detailed information for radiological procedures such as step-by-step guidelines, images, pre-, intra-, post- procedure tips on common potential problems and complications is also provided.
We examined 31 breast MR images from STATdx breast database. In simulation results section some of these images are illustrated and information about the subjects is also given.
-
III. Methods
In this section the crux of region growing (RG) algorithm and active contour model which are used for breast lesion segmentation task is explained. Then, bitquad method is introduced for better understanding the area calculation process.
-
A. Region Growing Method
Image segmentation aims to process an image to make it proper for some applications, such as pattern recognition or compression. When a segmentation method is applied to image, it is classified or clustered into several regions according to its inherent properties.
So far, several segmentation algorithms are developed and extensively exploited in various disciplines. In this study, RG method is used to determine the borders of breast lesions if exists.
RG is a simple image segmentation method that groups the neighboring pixels of similar amplitude to constitute a segmented region. Sometimes, instead of amplitude values another similarity criterion, such as frequency components can be used to form a region. In RG algorithm, selection of seed point is the first and the most crucial step. After the initial pixel point (seed point) is selected, the region begins to grow if the neighboring pixels satisfy the similarity criterion. The main steps of RG algorithm is given below:
Step 1 . Positions of initial seed points are set as p 1, p 2 , … p n. These seeds can be referred as the center of clusters C 1 , C 2 , …, C n .
Step 2 . Difference between the pixel value of i- th seed point p i and neighboring pixel is computed. If the difference is smaller than a predefined threshold value, this neighboring pixel is classified into i .th cluster C i .
Step 3 . Boundary of i- th cluster C i is computed and new seed points are selected as the boundary points of C i . Then, the mean values of C i are reckoned, respectively.
Step 4 . Go Step 2 until all pixels of image are assigned to the apposite cluster.
Although RG is a simple and efficient method, the computation time of this method increases if the initial points are not chosen suitably [11, 12].
-
B. Active Contour Model (Snake)
Segmentation of an image is a method that separates the image into regions of similar attribute such as luminance amplitude, edges, and texture. Segmentation methods subdivide an image, does not recognize the individual segments. So, segmenters are not classifiers.
Image segmentation is not based on a theory. As a result of this, there doesn’t exist a standard method to segment any image. Bu there are ad hoc methods developed for present image. Amplitude segmentation, clustering segmentation, region segmentation, boundary segmentation and texture segmentation are generic methods of image segmentation.
In this study we applied active contour model (snakes), which is a kind of boundary segmentation method, to segment breast MR images.
Snakes is a method of molding a closed contour to the boundary of an object in an image. The snake model is developed by Kass et. al. in 1987 [16]. In this model three forces referred as internal forces, image forces and external constraint forces forms the closed contour. The internal contour forces provide piecewise smoothness constraint while the image forces shape the contour toward image edges. The external forces are the result of the initial location of the contour by same a priori means.
Let v(s) = [ x(s),y(s)] is a parametric curve in the continuous domain where s is the arc length of the curve. The continuous domain snake energy can be expressed as
Es = J 0 1 EjJvCsBds + J 0 1 EI{v(s)}ds + J 0 1 ET{v(s)}ds (1)
where E N denotes the internal energy of the contour due to bending or discontinuities, E I is the image energy and E T implies the constraint energy. Equation (1) gives continuous domain energy. To calculate the discrete domain snake energy,
Es = Z^=iEN{v[n]} + Zn=iE;Mn|} + Zn=iET{v[n]} can be used. In Equation (2), v[n] vector denotes discrete contour. The location of a snake is derived by calculating the local minima of the function given in Equation (2). Kass et al. have derived a set of N differential equations. Minimum of the snake energy function is achieved by equalizing these derivatives to zero. Samadani has investigated the stability of snake model solutions [17]. The greedy algorithm expresses the internal energy in terms of its continuity energy Ec and curvature energy EK as given below
E n =« (n)E c {v|n]} + P(n)EK{v[n\} (3)
where a (n) and /? (n) control the elasticity and rigidity of the snake model. These parameters known as regularization parameters. The continuity and curvature energies are defined as
And
Е с —
d-|vn-vn-i| max[d-|vn())-vn-i|]
circle-shaped object’s circularity value is equal to 1 while the oblong-shaped object possesses a circularity value less than 1.
,. _ | V n-1 — 2V n + V n+1|2
е к —----;---------77------ л max{|vn-i-2vn(v)+vn+i|2
where d is the average curve length and V n (/) denotes the eight neighbors of a point vn for j=1, 2, ... 8.
The number of papers have been published to augment the performance of snake algorithm. Some of them are performed to improve the speed of algorithm while others improve the convergence of algorithm to the global minima [18].
-
C. Bit-Quad Method
After performing RG and Snakes, the region of lesion is obtained clearly. Now, our goal is to calculate the area of lesion to give information about the dimension of lesion to the radiologists. For this goal, we use bit-quad method. The main idea of this method is matching the logical state of region of an image to binary patterns. In Figure 2, sixteen 2x2 pixel pattern sets called as bit-quads are defined and illustrated. A bit quad is a 2x2 array of bit cells which are squares each having the value 0 or 1. Let n{Q} denotes the number of matches between image pixels and the pattern Q. As an example, to calculate the n{Q 1 } value the number of the binary pattern matching the Q 1 pattern on the binary image are counted. By this definition the object area is expressed as
Л — n[1}(6)
If the object is enclosed completely by a border of white pixels, the perimeter of object can be calculated as
Po — 2n{0 1} + 2n{J}(7)
The object area (A 0 ) and object perimeter (P 0 ) of an image can be expressed in terms of bit quad counts in the image as
A o = n{Q i } + 5 n{Q 2 } + Q n{Q 3 } + n{QJ +n
4 2 о4
Po — n{Q2} +;! [n{Qi} + n{Q3} + 2n{QD}](9)
These formulas are derived by Duda for a continuous object that has been coarsely digitized [19].
Various geometric attributes of objects can be derived such as circularity. The circularity or thinness ratio of an object is defined as
C o
_ 4nA o
“ (P o )2
In Equation (10), it is assumed that the number of holes with respect to the number of object is small. A
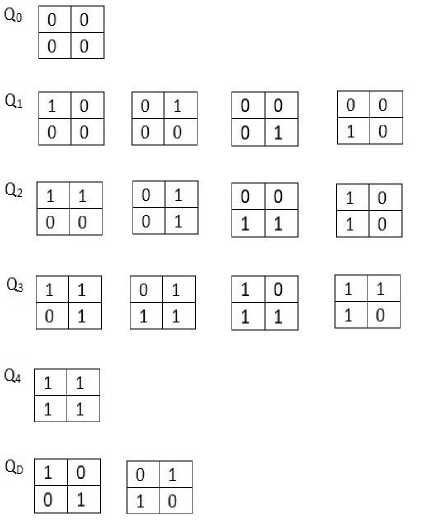
Fig. 2. Bit quad pattern set [10]
-
IV. Results
In this section, the performance of presented study is evaluated by computer simulations. For this purpose, precontrast T1 and T2 weighted MR images are used. The first goal of the study is to determine the boundaries of breast lesion based on RG and snake algorithms. As discussed before, to initialize RG algorithm and snake seed points and initial search area must be fixed, respectively. We decide these initializations according to the location of lesion, experimentally.
In the first experiment, we show the effectiveness of RG algorithm on breast image segmentation. RG applied pre-contrast T1 and T2 weighted breast images are illustrated in Figure 3 and 4, respectively. As can be seen from the figures RG method makes lesion boundaries apparent.
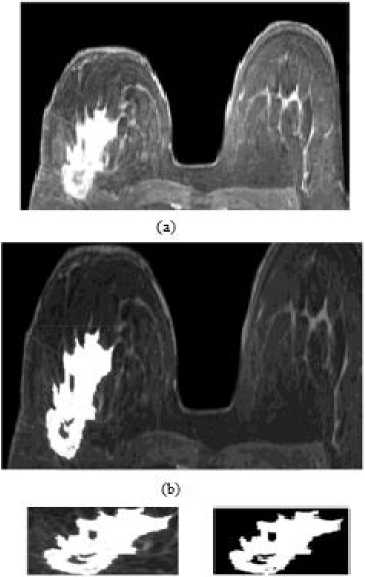
Figure 3a shows T1 weighted axial breast MR image before contrast agent injection (pre-contrast image). After performing RG, the shape and footprint of the lesion becomes visible as illustrated in Fig. 3.b. Binary lesion region is given in Fig.3. c. Fig. 4. also shows the performance of RG method. But there is only one difference between these figures. In Fig. 4.a. sagittal T2 fat suppressed MR image is used. Other illustrations are similar to that of Fig. 3.
Note that as well as the size of lesion, the geometrical attributes of the lesion are also important to distinguish benign/malignant lesions. For example, if the boundaries of the lesion are smooth the possibility of being benign lesion is higher. Thus, C 0 value comes into prominence.
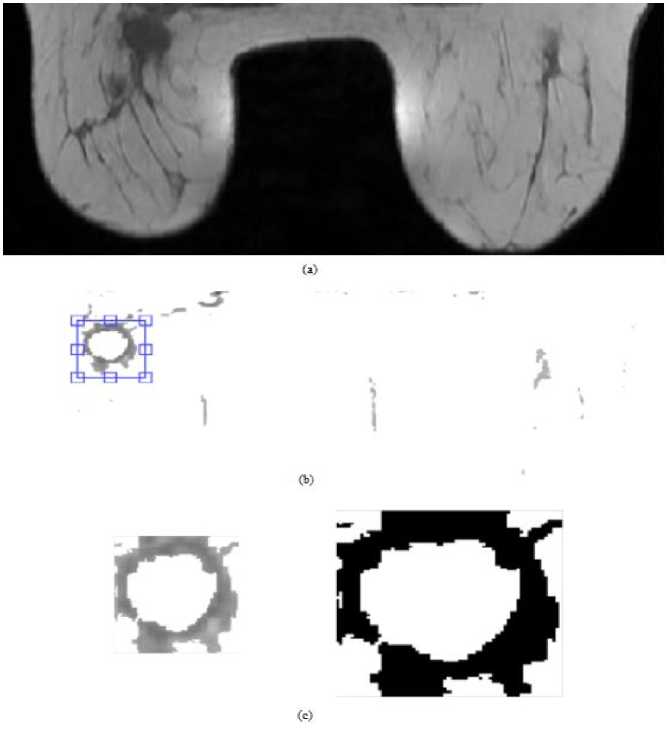
Fig.3. RG algorithm for T1 weighted breast MR image: (a) original image, (b) RG applied image and (c) selected lesion region.
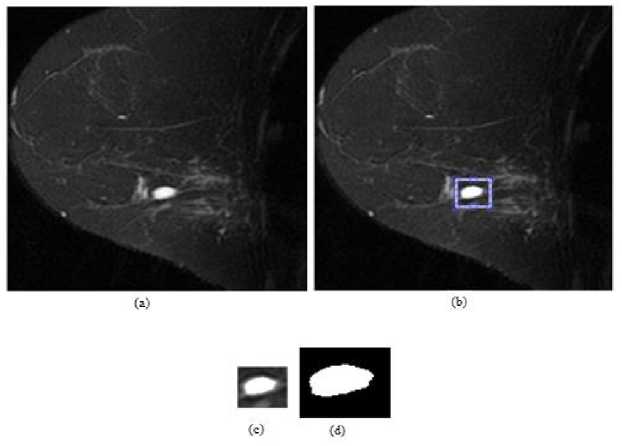
Fig.4. RG algorithm for T2 weighted breast MR image: (a) original image, (b) RG applied image, and (c) selected lesion region and (d) binary lesion image.
In the second experiment snake method is performed for three breast MR images chosen from the database to verify the success of method.
In the first image, T1 weighted MR in a high risk 42-year-old women is given. The result of snake method is illustrated in Figure 5. As a second image, T1 weighted MR in a 63-year-old women is used. The original input image, initial search area, detected area after 1000 iterations and binary lesion image is shown in Figure 6 similar to the Figures 5 and 7. At last, snake method is applied to T1 weighted MR image in a 45-year-old woman. The results are shown in Figure 7. It is clear from the figures that snake method can correctly detect the boundaries of breast lesions in MRI. In snake method the number of iterations is determined by performing the method successively. After performing RG and snake methods, we obtain segmented images that include the lesion area. In the third experiment, the area, perimeter and circularity values of detected lesion are calculated. For this purpose, bit-quad method is utilized. By counting Q1, …,QD binary patterns in binary lesion images and then by using Equations (8), (9) and (10) area (A0), perimeter (P0) and circularity (C0) values are calculated. Here, A0 can be though the number of pixels which belong to the lesion area and P0 denotes the perimeter of bounded lesion region. At last, C0 is referred as circularity (sometimes thinness ratio) which is one of geometrical attributes of an object. A circle shaped object has a circularity of unity, oblong-shaped objects possess a circularity less than 1 [20].
In this experiment, to evaluate and compare the performance of the proposed study with presented studies, proposed method is applied to the breast lesion image given in [21]. In like manner, original image, RG and snake applied images are illustrated in Figures 8 and 9, respectively. According to the figures we can say that both methods detect the lesion correctly. However, in details, RG performs better than snake.
The area, perimeter and circularity values calculated based on Otsu thresholding, Fuzzy C-means, snake and RG methods are given in Table I. As can be seen from the table, the results of Otsu, FCM and RG methods are consistent with each other. For this image, snake method gives higher area value than others because of bounding a large region in which there exist pixels that are not belong to the breast lesion. Thus, a hybrid segmentation framework should be determined to overcome this problem. For example, watershed method can be combined to snake method.
In addition, it is known that a few image is not adequate to evaluate the performance of segmentation methods. So, in our future studies we aim to construct larger database within our project supported by TUBITAK.
The lesion area value for the image used for comparison is about 3800 pixels. With this knowledge, the performance of methods given in Table 1 are 94,52%, 91,97%, 70,72% and 90,73%, respectively.
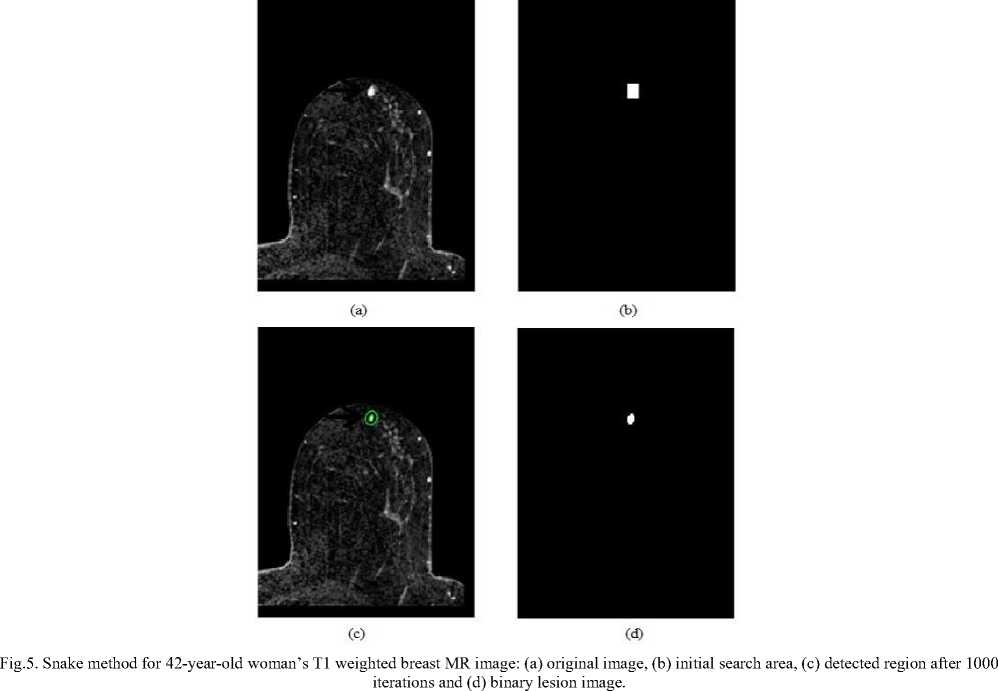
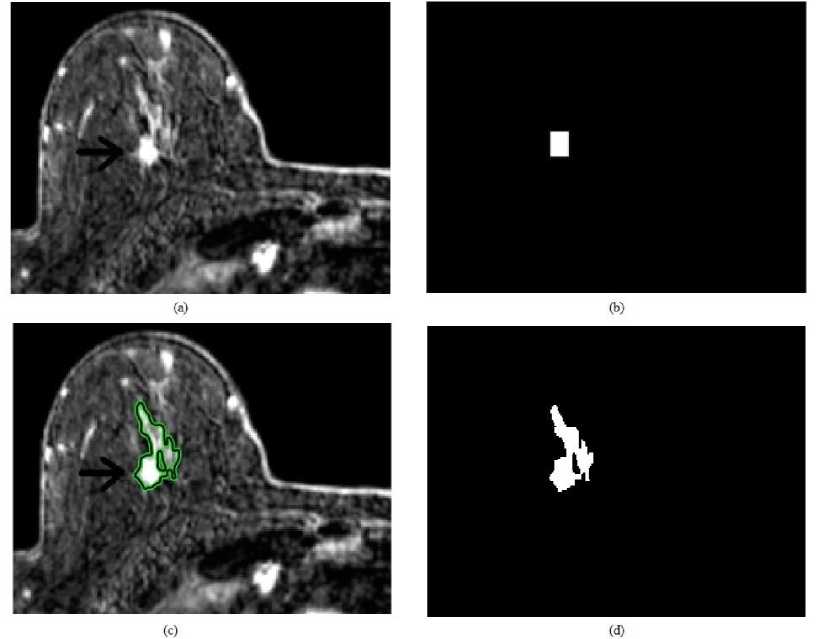
Fig.6. Snake method for 63-year-old woman’s T1 weighted breast MR image: (a) original image, (b) initial search area, (c) detected region after 1000
iterations and (d) binary lesion image.
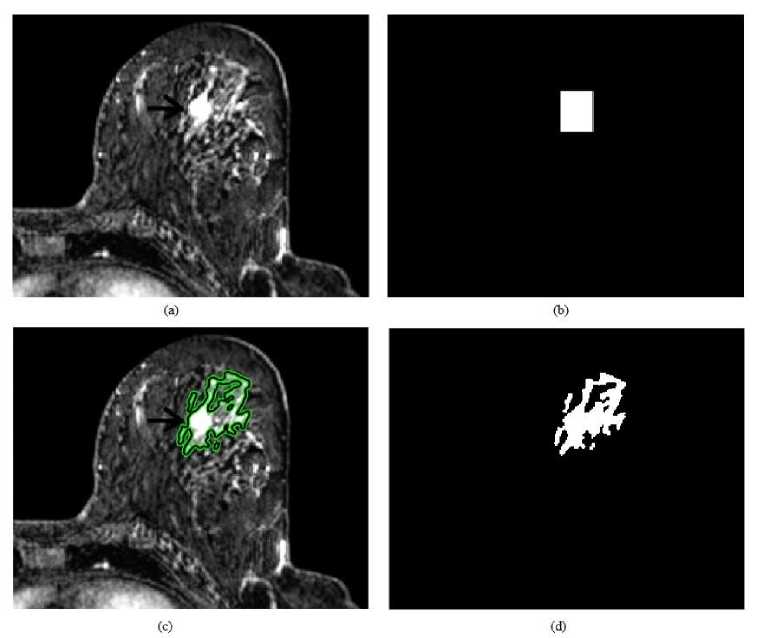
Fig.7. Snake method for 45-year-old woman’s T1 weighted breast MR image: (a) original image, (b) initial search area, (c) detected region after 1000 iterations and (d) binary lesion image.
(С) <«
Fig.8. RG algorithm for another breast lesion: (a) original image, (b) RG applied image, (c) selected lesion region and (d) binary lesion image.
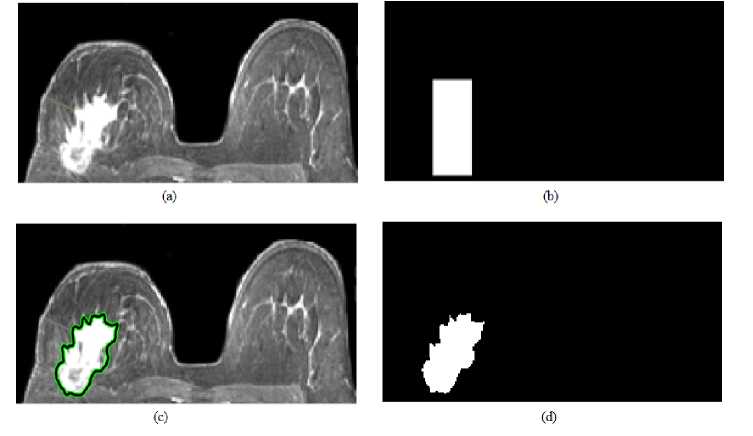
Fig.9. Snake method for another breast lesion: (a) original image, (b) initial search area, (c) detected lesion region and (d) binary lesion image.
Table 1. Comparıson Results Wıth [13]
|
Method: |
Otsu Thresholdig [21] |
FCM [21] |
Snake [Proposed] |
RG [Proposed] |
|
Area |
3592 |
3495 |
4990 |
3410 |
|
Perimeter |
562,75 |
594,84 |
435 |
589,095 |
|
Circularity |
0,14 |
0,12 |
0,33 |
0,41 |
-
V. Conclusions
Determining the boundaries of breast lesions and distinguish them as benign and malignant according to their geometrical and morphological attributions is a crucial task in breast cancer diagnosis. In this study, RG, snake and bit-quad based boundary detection and area calculation method is proposed to provide a useful information to the radiologists. As given in the results section, it can be said that the proposed method provides promising results for breast lesion recognition. So, it can be developed to build a complete breast cancer treatment system. In the future studies, we target to classify breast lesions by applying miscellaneous image processing and pattern recognition methods. For this purpose, a large scale lesion database that includes different types of lesions will be formed and hybrid methods will be investigated.
Acknowledgment
This paper is fully supported by the Scientific and Technological Research Council of Turkey (TUBITAK). Project number is 118E201.
References Breast lesion segmentation and area calculation for MR images
- Global Cancer Facts and Figures, 3rd Edition [Online]. Available: https://www.cancer.org/content/dam/cancer-org/research/cancer-facts-and-statistics/global-cancer-facts-and-figures/global-cancer-facts-and-figures-3rd-edition.pdf.
- The Ministry of Health of the Republic of Turkey, Turkey Cancer Statistics’data[Online].Available:http://kanser.gov.tr/Dosya/ca_istatistik/2014-RAPOR._uzun.pdf
- R. K. Justice, E. M. Stokely, J. S. Strobel, R. E. Ideker, and W. M. Smith, “Medical image segmentation using 3-D seeded region growing,” Management, vol. 3034, pp. 900–910, 1997.
- J. Wu, S. Poehlman, M.D. Noseworthy, M. V. Kamath, “Texture feature based automated seeded region growing in abdominal MRI segmentation”, International Conference on BioMedical Engineering and Informatics,2008, pp. 263-267.
- M.M.Synthuja, L. P. Suresh, M.J. Bosco, “Image segmentation using seeded region growing”, International Conference on Computing, Electronics and Electrical Technologies [ICCEET], 2012, pp. 576-583.
- H. Z. H. Zhang, S. W. F. S. W. Foo, S. M. Krishnan, and C. H. T. C. H. Thng, “Automated breast masses segmentation in digitized mammograms,” IEEE Int. Work. Biomed. Circuits Syst. 2004., pp. 2–5, 2004.
- A. Q. Al-faris, U. K. Ngah, N. Ashidi, M. Isa, and I. L. Shuaib, “Breast MRI tumor segmentation using modified seeded region growing based on particle swarm optimization image clustering”, Soft Computing in Industrial Applications, vol. 223, pp. 49–60, 2014.
- S. Kansal and P. Jain, “Automatic Seed Selection Algorithm for Image Segmentation Using Region Growing,” Int. J. Adv. Eng. Technol., vol. 8, no. 3, pp. 362-367, 2015.
- R. Rouhi, M. Jafari, S. Kasaei, P. Kashavazia, “Benign and malignant breast tumors classification based on region growing and CNN segmentation”, Expert Systems with Appl., 42,2005, pp. 990-1002.
- S. B. Gray, “Local Properties of Binary Images in Two Dimensions,” IEEE Trans. Comput., vol. C-20, no. 5, pp. 551–561, 1971.
- S. Gehlot, J. D. Kumar, “The Image Segmentation Techniques”, International Journal of Image Graphics and Signal Processing, vol. 2, pp. 9-18, 2017.
- K. Bhima, Dr. A. Jagan, “An Improved Method for Automatic Segmentation and Accurate detection of Brain Tumor in Multimodal MRI”, International Journal of Image Graphics and Signal Processing, vol. 5, pp. 1-8, 2017.
- A. B. Daho, M. Baughazi, “Segmentation of Abnormal Blood Cells for Biomedical Diagnostic Aid”, International Journal of Image Graphics and Signal Processing, vol. 1, pp. 30-35, 2018.
- A.K. Jumat, W. E. Rahman, A. İbrahim, R. Mahmud, “Segmentation of Masses Form Breast Ultrasound Images Using Parametric Active Contour Algorithm”, IEEE International Conference on Signal and Image Processing Applications, 2011, pp. 404-409.
- J. Liu, J. Wang, “Application of snake Model in Medical Image Segmentation”, Journal of Convergence Information Technology, Vol. 9, 2014, pp. 105-109.
- M. Kass, A. Witkin, D. Terzopoulos, “Sankes : Active Contour Models”, International Journal of computer Visions, Vol1. 4, 1987, pp. 321-331.
- R. Samadani, “Adaptive Snakes: Contol of Damping and Material Parameters”, Proc. SPIE Conference on Geometric Methods in Computer Vision, 1970, San Diego, CA, pp. 202-213.
- L. Ji, H. Yan, “Loop-Free Snakes for Image Segmentation” Porc. 1999 International Conference on Image Processing Kobe, Japan,1999, pp. 193-197.
- R. O. Duda, “Image Segmentation and Description” unpublishes notes, 1975.
- W. K. Pratt, Processing Digital Image Processing, John Wiley and Sons Inc., 3. Edition, 2001.
- G. Çetinel, S. Gül, “Detection of lesion boundaries in breast magnetic resonance imaging with Otsu thresholding and Fuzzy c-means”, 5.th International Conference on Advanced Technologies and Sciences, 2017.
