Budgets of regional centers in the north-west: tools for modernization or survival?

Author: Pechenskaya Mariya A.
Journal: Economic and Social Changes: Facts, Trends, Forecast @volnc-esc-en
Section: Public finance
Article in issue: 3 (63) т.12, 2019.
Free access
The paper opens a series of studies on the development of regional administrative centers. We put forward a hypothesizes that the budgetary policy regarding regional centers does not correspond to their current budget condition and is not focused on such development that would turn cities into the pillars of the balanced and harmonious spatial development of Russia. In this regard, the goal of the study is to conduct a comprehensive analysis of the budget system and the conditions of its functioning in regional administrative centers. We use economic and mathematical methods and reveal that the changes in geopolitical and geo-economic conditions in Russia had a negative impact on the budget systems of regional centers; it was manifested in the predominance of financial assistance in the structure of total revenues, in the stable dynamics of imbalance and in a decrease in the level of budget security of the population. We use official data of Rosstat and the Federal Treasury to find out key trends in the development of regional centers of the North-West of Russia since 2011. We conclude that the budgets of regional centers are trying to survive and are not ready to implement social transformation and promote economic growth. Based on this, we define major development directions for regional centers. The materials of the paper can be of use in the educational sphere, in the study of financial and economic disciplines; they can also be used by scientists as a basis for further research and by management bodies of various levels to substantiate management decisions. Further research will be devoted to the study of the effectiveness of management of the budget of the regional center, the level of debt burden and the state of intergovernmental fiscal relations.
Territorial systems, economic growth, sustainable development, municipal entities, city, regional center, differentiation, budget security, periphery
Short address: https://sciup.org/147224187
IDR: 147224187 | UDC: 336.01 | DOI: 10.15838/esc.2019.3.63.5
Text of the scientific article Budgets of regional centers in the north-west: tools for modernization or survival?
Introduction to the topic
In the context of globalization, political sanctions, and the transformation of the socioeconomic system of Russia, it becomes extremely urgent to promote sustainable national and regional development and to minimize intraregional barriers to growth. One of such barriers is the aggravation of the issues of dynamic development of cities; they are considered by foreign science and practice as the drivers of national growth and the elements in the structuring of the territory, society and economy [1-5]. The need to create such a driving force for the country was mentioned by Russian President Vladimir Putin in his Address to the Federal Assembly back in 20181.
However, unlike foreign cities, the development of which since the middle ages was mainly influenced by market forces and served to meet the growing needs of society and production, Russian cities had a different growth trajectory. In a command and administrative economy, their formation and development took place within the framework of the general map of population distribution. It often imposed restrictions on new industrial construction in some cities, which caused inertia in industrial development and reduced the possibility of its progressive transformation. Consequently, since the mid-1980s, the Soviet city, as a rule, was not an independent participant in the development of the state, and functioned only as an element of its administrative-territorial organization. This meant that the emergence of other cities as points of growth, except Moscow, was impossible.
After the collapse of the Soviet Union, Russia’s position in the geopolitical and geo-economic system changed, and it required a revision of its spatial development, the Strategy2 for which began to be developed only in June 2014. However, from the point of view of administrative and territorial division, the Strategy approved in 2019 dealt largely with urban agglomerations with a population of more than 500 thousand people, and rural settlements. At the same time, this approach reduces the scope of state regulation because it does not consider a whole range of types of cities.
With regard to urban typology, we think that the approach of N.V. Zubarevich to the study of cities as points of growth is the most complete and justified.
According to this approach, there are four types of cities in Russia, which are formed and continue to develop under the influence of institutional, economic, social and other factors (Figure 1) . Thus, against the background of federal capitals and million-plus cities, the administrative capitals of regions with a population of 200 thousand people are
Figure 1. Types of cities – points of growth in modern Russia
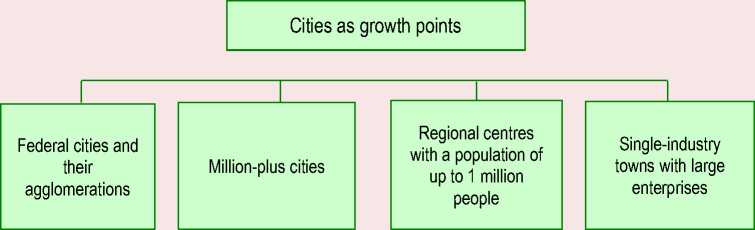
Source: compiled with the use of [6].
developing to a greater extent due to the influence of the status factor, as well as the concentration of economic and human resources in them. Historically, since 1991, regional capitals found themselves in the most advantageous position due to the ongoing process of decentralization and distribution of economic and political resources in favor of constituent entities of the Russian Federation. The bulk of highly paid jobs was concentrated in regional capitals; as a result, they received a noticeable increase in wages relative to the regional average. However, in the mid-1990s, when the political vector changed to centralization and the budgetary resources were being increasingly transferred to higher levels of government (it is still going on today), the so-called agglomeration effect came to the fore. It should be noted that the effect of scale on territorial development is studied in the works of both domestic [7–9] and foreign scientists [10–13]. For example, M. Fujita, P. Krugman and F.J. Venables [12] have repeatedly argued that the role of development and modernization centers belongs to cities to varying degrees and with different quality of growth.
After the municipal and inter-budget reforms carried out in Russia, not all of its cities were ready to compete for human and economic resources, and therefore they could not increase neither human capital, nor financial and economic potential [14]. According to the study of Rosstat database on municipalities for 2017, we can conclude that the provision of budget revenues per capita is below average in 53 out of 82 administrative centers of Russia. Moreover, the Russian model of intergovernmental fiscal relations is built in such a way that the supposed objective advantages of development of regional centers have become a reason not only for narrowing the instruments for obtaining financial support for them, but also to cut some of the revenue sources in order to equalize the budgetary provision of the peripheral territories of the region.
Therefore, in recent years, the wider scientific community turns its attention to studying the drivers of development of the so-called cities with “administrative resources” that are not federal cities and that have a population of up to one million people. At the same time, an important methodological and practical problem lies in the need to improve the effectiveness of management and the use of cities’ potential in order to strengthen their budget security.
In view of the above, our study will be based on the hypothesis that the budget policy pursued in relation to regional centers does not correspond to their budget condition and is not focused on such development that that would turn cities into the pillars of the balanced and harmonious spatial development of Russia. In this regard, the goal of the study is to conduct a comprehensive analysis of the budget system and the conditions of its functioning in regional administrative centers.
Analysis of the state of budget systems in regional centers in the North-West of Russia
Among the variety of Russian cities we have chosen regional centers of the Northwestern Federal District (NWFD) of the Russian Federation as the object of our study. Our choice is reasonable, because this macroregion occupies about 10% of the country’s territory (it ranks 4th among federal districts), contains 10% of the population and produces 10% of the total GRP. Mainly, it is an industrially oriented territory with a developed infrastructure and a significant mineral resource base; all this determines its important competitive advantage. The greatest contribution to the formation of the GRP of the NWFD is made by the city of Saint Petersburg (42.3%), followed by the Leningrad, Vologda, Arkhangelsk oblasts and the Republic of Komi; they provide up to 40% of the total gross product of the NWFD.
It should be noted that the system of municipal entities of the Northwestern Federal District includes 40 urban districts, 159 municipal districts and 1,497 urban and rural settlements. Eleven regional centers accumulate 36% of the population, 30% of industrial production, 33% of retail turnover, 27% of profit of organizations, 23% of capital investments, and 30% of people employed in the economy. Let us clarify that, in order to achieve objective comparability of the data, we have chosen the administrative centers of NWFD regions (excluding the city of federal importance of Saint Petersburg, the Leningrad Oblast, whose authorities are located in Saint Petersburg, and Nenets Autonomous Okrug) as the object of our research.
The influence of the status of the regional center is especially noticeable in the clearly outstripping growth of incomes of its population in comparison with the regional average. Table 1 shows that during the period under consideration the average wages of residents of regional centers of the Northwestern Federal District exceeded the regional average. As of the end of 2018, the largest gap – by almost a third –was observed in Kaliningrad, while wages in Syktyvkar were lower than the regional average by 8.1%. This state of affairs in the regional center of the Republic of Komi is explained by the fact that it is not the main donor of the Republic’s budget, since more than 70% of the region’s oil is produced in the towns of Usinsk (where average wages exceed 70 thousand rubles per capita) and Vorkuta (over 60 thousand rubles per capita).
Let us now analyze the state of budget systems; in this regard we should note that the revenues of administrative centers of the Northwestern Federal District have increased by an average of 5% since 2011, i.e. at a lower rate than in the urban districts (UD) of Russia (6.7%) in general. In 2012 and 2015, the dynamics were negative (Tab. 2) .
In general, the dynamics of total revenues of the budget system of Russian cities is determined by tax revenues. In the analyzed period, the nominal growth rate of tax revenues of regional centers in the Northwestern Federal District was low despite its volatile dynamics. At the same time, real growth occurred only in Murmansk: +35% in 2011–2018, due to the growth of taxes on gross income and property (Fig. 2) .
Table 1. Comparing average wages in the regional center and average wages in the region
|
Russia’s constituent entity / city or town |
2011 |
2012 |
2013 |
2014 |
2015 |
2016 |
2017 |
2018 |
Average for 2011– 2018 |
2018 to 2011, % |
|
Kaliningrad Oblast |
19911 |
21526 |
25104 |
26639 |
28262 |
29451 |
30580 |
32634 |
26763 |
163.9 |
|
Kaliningrad |
35241 |
38166 |
40129 |
41553 |
38137 |
36016 |
38686 |
42450 |
38797 |
120.5 |
|
Ratio to the regional average, % |
177.0 |
177.3 |
159.9 |
156.0 |
134.9 |
122.3 |
126.5 |
130.1 |
||
|
Novgorod Oblast |
18637 |
21297 |
23494 |
25225 |
26346 |
27914 |
29311 |
31275 |
25437 |
167.8 |
|
Veliky Novgorod |
31937 |
36280 |
38356 |
38512 |
36426 |
34698 |
36640 |
39619 |
36558 |
124.1 |
|
Ratio to the regional average, % |
171.4 |
170.4 |
163.3 |
152.7 |
138.3 |
124.3 |
125.0 |
126.7 |
||
|
Pskov Oblast |
15721 |
18203 |
19743 |
21004 |
21553 |
22399 |
23659 |
26868 |
21144 |
170.9 |
|
Pskov |
29333 |
33007 |
34009 |
34360 |
31322 |
28850 |
30539 |
32869 |
31786 |
112.1 |
|
Ratio to the regional average, % |
186.6 |
181.3 |
172.3 |
163.6 |
145.3 |
128.8 |
129.1 |
122.3 |
||
|
Murmansk Oblast |
32342 |
36188 |
40225 |
43378 |
45989 |
48986 |
51932 |
57582 |
44578 |
178.0 |
|
Murmansk |
52445 |
57058 |
60563 |
61993 |
60955 |
58174 |
61262 |
68497 |
60118 |
130.6 |
|
Ratio to the regional average, % |
162.2 |
157.7 |
150.6 |
142.9 |
132.5 |
118.8 |
118.0 |
119.0 |
||
|
Republic of Karelia |
22174 |
24796 |
27503 |
29371 |
30704 |
33061 |
34434 |
38977 |
30128 |
175.8 |
|
Petrozavodsk |
36470 |
40483 |
43024 |
43206 |
40729 |
38656 |
41234 |
46232 |
41254 |
126.8 |
|
Ratio to the regional average, % |
164.5 |
163.3 |
156.4 |
147.1 |
132.7 |
116.9 |
119.7 |
118.6 |
||
|
Vologda Oblast |
20250 |
22649 |
25127 |
26749 |
27445 |
29303 |
31651 |
35545 |
27340 |
175.5 |
|
Vologda |
23395 |
26330 |
29095 |
30812 |
30843 |
33722 |
35997 |
39705 |
31237 |
169.7 |
|
Ratio to the regional average, % |
165.1 |
159.5 |
151.9 |
142.8 |
128.9 |
115.7 |
113.7 |
111.7 |
||
|
Arkhangelsk Oblast |
24611 |
28531 |
32465 |
35572 |
38300 |
40790 |
42950 |
48100 |
36415 |
195.4 |
|
Arkhangelsk |
40090 |
43770 |
47446 |
48258 |
45571 |
43194 |
45098 |
50420 |
45481 |
125.8 |
|
Ratio to the regional average, % |
162.9 |
153.4 |
146.1 |
135.7 |
119.0 |
105.9 |
105.0 |
104.8 |
||
|
Repjblic of Komi |
28897 |
33971 |
37717 |
40222 |
41365 |
43662 |
45689 |
50186 |
40214 |
173.7 |
|
Syktyvkar |
40695 |
43596 |
47015 |
48020 |
45042 |
42146 |
44181 |
46115 |
44601 |
113.3 |
|
Ratio to the regional average, % |
140.8 |
128.3 |
124.7 |
119.4 |
108.9 |
96.5 |
96.7 |
91.9 |
||
|
Source: own calculations with the use of Rosstat data. |
||||||||||
Table 2. Dynamics of aggregate revenues of the budgets of regional centers (RC) of the NWFD
|
Indicators |
2011 |
2012 |
2013 |
2014 |
2015 |
2016 |
2017 |
2018 |
2018 to 2011, % |
|
Murmansk |
|||||||||
|
Million rubles |
8551 |
8569 |
9261 |
9723 |
11076 |
11455 |
11970 |
14262 |
166.8 |
|
Growth rate, % |
125.0 |
100.2 |
108.1 |
105.0 |
113.9 |
103.4 |
104.5 |
119.1 |
109.9 on average |
|
Syktyvkar |
|||||||||
|
Million rubles |
4658 |
5702 |
5658 |
6568 |
6278 |
7175 |
6873 |
7678 |
164.8 |
|
Growth rate, % |
115.1 |
122.4 |
99.2 |
115.3 |
96.2 |
114.4 |
95.8 |
111.7 |
108.8 on average |
|
Vologda |
|||||||||
|
Million rubles |
5818 |
5606 |
6639 |
7361 |
7025 |
6102 |
6495 |
7902 |
135.8 |
|
Growth rate, % |
113.2 |
96.4 |
118.4 |
110.9 |
95.4 |
86.9 |
106.4 |
121.7 |
106.2 on average |
|
Pskov |
|||||||||
|
Million rubles |
3638 |
3004 |
3191 |
4113 |
3461 |
4368 |
3839 |
4666 |
128.3 |
|
Growth rate, % |
133.1 |
82.7 |
106.2 |
128.9 |
84.1 |
126.2 |
87.9 |
121.5 |
108.8 on average |
|
Arkhangelsk |
|||||||||
|
Million rubles |
7376 |
7053 |
7986 |
7433 |
7813 |
7939 |
8286 |
9166 |
124.3 |
|
Growth rate, % |
103.1 |
95.6 |
113.2 |
93.1 |
105.1 |
101.6 |
104.4 |
110.6 |
103.3 on average |
|
Veliky Novgorod |
|||||||||
|
Million rubles |
4643 |
4327 |
4551 |
4697 |
4473 |
5207 |
5691 |
5718 |
123.2 |
|
Growth rate, % |
108.8 |
93.2 |
105.2 |
103.2 |
95.2 |
116.4 |
109.3 |
100.5 |
104.0 on average |
|
Kaliningrad |
|||||||||
|
Million rubles |
11521 |
12299 |
13074 |
14789 |
12632 |
11054 |
12831 |
13925 |
120.9 |
|
Growth rate, % |
99.5 |
106.8 |
106.3 |
113.1 |
85.4 |
87.5 |
116.1 |
108.5 |
102.9 on average |
|
Petrozavodsk |
|||||||||
|
Million rubles |
6376 |
5107 |
4961 |
4913 |
4491 |
5102 |
5129 |
5717 |
89.7 |
|
Growth rate, % |
113.1 |
80.1 |
97.1 |
99.0 |
91.4 |
113.6 |
100.5 |
111.5 |
100.8 on average |
|
Total for RC of NWFD |
|||||||||
|
Million rubles |
52581 |
51668 |
55321 |
59599 |
57250 |
58402 |
61113 |
69033 |
131.3 |
|
Growth rate, % |
110.9 |
98.3 |
107.1 |
107.6 |
96.1 |
102.0 |
104.6 |
113.0 |
105.0 on average |
|
Total for UD of Russia |
|||||||||
|
Million rubles |
1453.3 |
1510.6 |
1619.5 |
1689.9 |
1684.2 |
1743.8 |
1851.8 |
2135.2 |
146.9 |
|
Growth rate, % |
113.3 |
103.9 |
107.2 |
104.3 |
99.7 |
103.5 |
106.2 |
115.3 |
106.7 on average |
|
Source: own calculations according to the reports of the Federal Treasury of Russia; reports on the execution of budgets of urban districts; Rosstat. |
|||||||||
Figure 2. Growth rate of tax revenues of the budgets of regional centers in the Northwestern Federal District in 2011–2018 (in conditions comparable to 2018), %
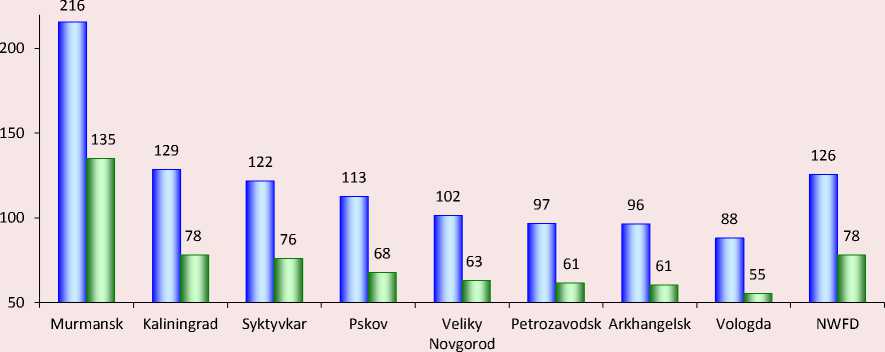
□ Nominal growth rate □ Real growth rate
Source: own calculations according to the reports on the execution of budgets of urban districts, reports of the Federal Treasury of Russia, Rosstat, and the Federal Tax Service of Russia.
As the study shows, due to the uneven development of the production capacity of administrative centers, even within the same federal district, there is a twofold difference in the level of per capita tax revenues between the highest-income city (Murmansk) and the lowest-income city (Petrozavodsk) (Tab. 3) .
In the period under consideration, there was an increase in the extent of negative structural transformation of budget revenues of urban districts; it was due to the fact that gratuitous receipts exceeded tax revenues (Fig. 3).
The volatile dynamics of tax revenues were mainly due to unstable revenues generated
Table 3. The share of regional centers in the formation of tax revenues of the consolidated budgets of the NWFD regions
|
Subject |
Total tax revenues received in 2011–2018, million RUB |
% of tax revenues of the consolidated budgets of NWFD regions |
Tax revenues per capita in 2018, thousand RUB |
|
Murmansk |
43126 |
10.2 |
27.8 |
|
Kaliningrad |
47550 |
16.3 |
14.1 |
|
Arkhangelsk |
28249 |
6.4 |
10.9 |
|
Syktyvkar |
18398 |
3.9 |
9.9 |
|
Vologda |
18225 |
4.7 |
8.2 |
|
Veliky Novgorod |
11606 |
6.4 |
7.4 |
|
Pskov |
11141 |
8.3 |
7.1 |
|
Petrozavodsk |
14281 |
7.9 |
6.9 |
|
Regional centers of the NWFD |
192576 |
7.6 |
12.0 |
|
Source: own calculations according to the reports of the Federal Treasury of Russia; reports on the execution of budgets of urban districts; |
|||
|
Rosstat, and the Federal Tax Service of Russia. |
|||
Figure 3. Structure of revenues of the budgets of NWFD regional centers, %
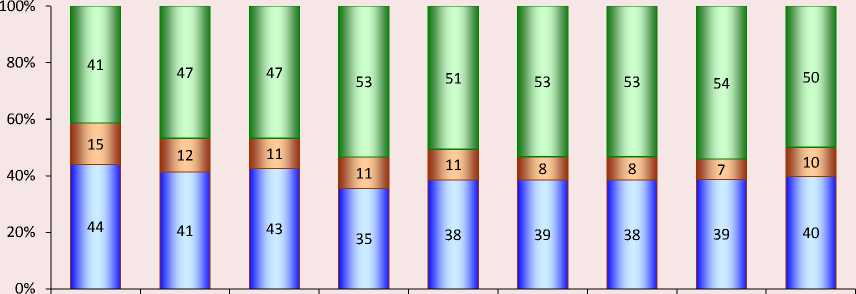
2011 2012 2013 2014 2015 2016 2017 2018 Average for
2011-2018
□ Tax revenues □ Non-tax revenues □ Gratuitous receipts
Source: own calculations according to the reports of the Federal Treasury of Russia; reports on the execution of budgets of urban districts; Rosstat, and the Federal Tax Service of Russia.
from individual income tax, the main component of the revenues of the budgets of urban districts. Murmansk, Kaliningrad, Pskov and Arkhangelsk showed an increase in the collection of this tax. The strongest drop in the tax was observed in Vologda and Veliky Novgorod – by 21 and 27%, respectively (Tab. 4) .
The decisive factor in the reduction of individual income tax receipts consisted in the adjustment of budget legislation3, which was affected by the mechanism of redistribution of taxes according to the levels of the budget system. Thus, standard deductions of this tax to the budgets of urban districts were reduced from 30% in 2011 to 20% in 2012–2013 and to 15% in the period from 2014. However, we should point out that the minimum standard of 15% for individual income tax payments to the budgets of cities was established not in all the Northwestern regions, so in the territorial context there was a significant gap in the dynamics of tax revenues.
In the context of the policy of intergovernmental fiscal alignment, the budget systems of the vast majority of urban districts within the NWFD were characterized by a decrease in their own tax and non-tax revenues, although on average the coefficient of provision with own revenues exceeded the average coefficient for urban districts of the country (Tab. 5) . For example, in the capital cities of the Novgorod and Vologda oblasts, which had the best indicators of provision with own revenues in 2011, there was a decrease from 91 to 64% and from 80 to 65%, respectively.
Own revenues of the city budgets of the NWFD decreased in real terms by 30% against a nominal 10% growth. In Veliky Novgorod,
Table 4. Receipts of individual income tax in the budgets of the regional centers of the Northwestern Federal District
|
Indicators |
2011 |
2012 |
2013 |
2014 |
2015 |
2016 |
2017 |
2018 |
2018 to 2011 |
|
Murmansk |
|||||||||
|
Million RUB |
3102 |
3273 |
3597 |
2886 |
3116 |
3378 |
3649 |
4128 |
133% |
|
% of taxes |
82 |
83 |
72 |
64 |
60 |
55 |
53 |
53 |
-29.3 p.p. |
|
Kaliningrad |
|||||||||
|
Million RUB |
2793 |
3165 |
2906 |
2931 |
2916 |
3120 |
3276 |
3688 |
132% |
|
% of taxes |
68 |
55 |
46 |
51 |
49 |
53 |
53 |
52 |
-16.2 p.p. |
|
Pskov |
|||||||||
|
Million RUB |
882 |
914 |
898 |
900 |
878 |
920 |
997 |
1065 |
121% |
|
% of taxes |
67 |
68 |
66 |
65 |
64 |
66 |
66 |
64 |
-2.7 p.p. |
|
Arkhangelsk |
|||||||||
|
Million RUB |
2690 |
2609 |
2826 |
2618 |
2654 |
2264 |
2861 |
3068 |
114% |
|
% of taxes |
67 |
80 |
81 |
79 |
76 |
73 |
78 |
79 |
12.2 p.p. |
|
Syktyvkar |
|||||||||
|
Million RUB |
1354 |
1555 |
1744 |
1252 |
1263 |
1135 |
1193 |
1356 |
100% |
|
% of taxes |
64 |
65 |
68 |
60 |
58 |
54 |
55 |
55 |
-9.7 p.p. |
|
Petrozavodsk |
|||||||||
|
Million RUB |
1568 |
1311 |
1466 |
1121 |
1093 |
1144 |
1169 |
1354 |
86% |
|
% of taxes |
79 |
77 |
76 |
70 |
67 |
65 |
63 |
63 |
-15.9 p.p. |
|
Vologda |
|||||||||
|
Million RUB |
1850 |
997 |
1092 |
873 |
988 |
900 |
982 |
1468 |
79% |
|
% of taxes |
62 |
45 |
46 |
46 |
51 |
44 |
46 |
56 |
-6.2 p.p. |
|
Veliky Novgorod |
|||||||||
|
Million RUB |
1069 |
807 |
900 |
699 |
674 |
711 |
729 |
785 |
73% |
|
% of taxes |
65 |
57 |
61 |
51 |
49 |
53 |
52 |
52 |
-13.2 p.p. |
|
Total for regional centers of the NWFD |
|||||||||
|
Million RUB |
15309 |
14630 |
15429 |
13281 |
13852 |
13572 |
14856 |
16911 |
111% |
|
% of taxes |
70 |
67 |
63 |
61 |
59 |
57 |
58 |
59 |
-10.5 p.p. |
|
Total for urban districts of Russia |
|||||||||
|
Million RUB |
361947 |
376909 |
420282 |
337001 |
338602 |
353027 |
374821 |
440319 |
122% |
|
% of taxes |
64 |
67 |
68 |
61 |
61 |
60 |
59 |
58 |
-5.9 p.p. |
|
Source: own calculations according to the reports of the Federal Treasury of Russia; reports on the execution of budgets of urban districts; |
|||||||||
|
Rosstat, and the Federal Tax Service of Russia. |
|||||||||
Table 5. The coefficient of provision of the budgets of regional centers of the NWFD with own revenues, %*
|
Urban district |
2011 |
2012 |
2013 |
2014 |
2015 |
2016 |
2017 |
2018 |
Аbsolute deviation, 2018 to 2011 |
|
Murmansk |
0.73 |
0.80 |
0.83 |
0.82 |
0.85 |
0.92 |
0.93 |
0.93 |
0.20 |
|
Kaliningrad |
0.57 |
0.66 |
0.65 |
0.64 |
0.60 |
0.82 |
0.78 |
0.80 |
0.23 |
|
Syktyvkar |
0.66 |
0.73 |
0.64 |
0.65 |
0.76 |
0.58 |
0.73 |
0.78 |
0.12 |
|
Arkhangelsk |
0.78 |
0.78 |
0.69 |
0.86 |
0.85 |
0.71 |
0.83 |
0.77 |
0.00 |
|
Petrozavodsk |
0.78 |
0.71 |
0.71 |
0.78 |
0.85 |
0.74 |
0.85 |
0.77 |
-0.01 |
|
Vologda |
0.80 |
0.64 |
0.66 |
0.72 |
0.76 |
0.70 |
0.63 |
0.65 |
-0.15 |
|
Veliky Novgorod |
0.91 |
0.65 |
0.65 |
0.78 |
0.80 |
0.57 |
0.53 |
0.64 |
-0.27 |
|
Pskov |
0.50 |
0.63 |
0.61 |
0.53 |
0.67 |
0.50 |
0.62 |
0.53 |
0.03 |
|
For regional centers of the NWFD |
0.71 |
0.70 |
0.68 |
0.72 |
0.77 |
0.69 |
0.74 |
0.73 |
0.02 |
|
For urban districts of Russia |
0.62 |
0.63 |
0.63 |
0.63 |
0.63 |
0.64 |
0.63 |
0.63 |
0.01 |
* The coefficient is calculated as the ratio of tax and non-tax revenues to expenses excluding subventions from the federal budget. Source: own calculations according to the reports of the Federal Treasury of Russia; reports on the execution of budgets of urban districts; Rosstat.
Vologda, and Petrozavodsk, the reduction in the revenues adjusted for inflation was 43–57%. The growth of real revenues was observed only in Murmansk (Fig. 4) .
The reduction in the budget revenues, the growing imbalance between the receipt and expenditure of budget funds in the period under consideration led to a significant deficit in the budget systems of urban districts. In some years, the amount of the deficit exceeded the limits set by the Budget Code (10% in the volume of own revenues). At the end of 2018, the budgets
of Petrozavodsk and Vologda experienced the greatest deficit; Murmansk and Veliky Novgorod managed to achieve balance (Tab. 6) .
The works [14–19] confirm that the opportunities for modernization of the economy and the social sphere are growing with the strengthening of the budget security of the territories. However, the analysis has revealed an extremely unstable level of security of urban budgets since 2012; due to this fact it is not possible to promote the economic growth of cities (Fig. 5) .
Figure 4. Growth rates of own revenues of the budgets of regional centers of the Nortwestern Federal District, %
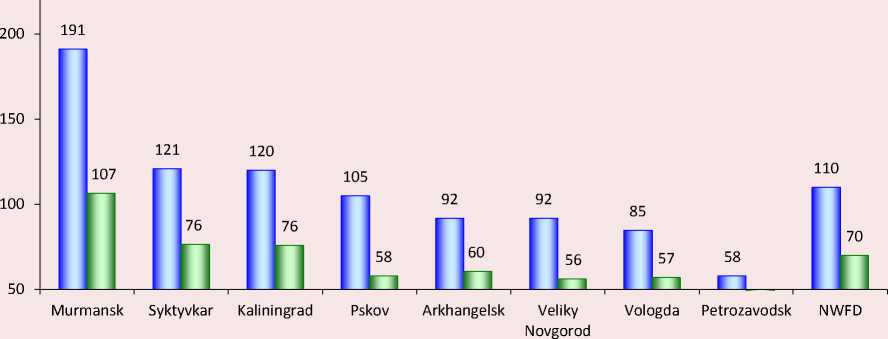
о Nominal growth rate □ Real growth rate
Source: own calculations according to the reports of the Federal Treasury of Russia; reports on the execution of budgets of urban districts; Rosstat.
With regard to income security of residents of administrative centers of the North-West, we can point out that the greatest rise in incomes in the period under consideration was observed in Murmansk (incomes grew from 28 to 48.7 thousand rubles per person), Syktyvkar (from 18.3 to 29.4 thousand rubles per person) and Kaliningrad (from 26.6 to 29.3 thousand rubles per person). Residents’ incomes were
low in Pskov (incomes grew from 17.8 to 22.2 thousand rubles per person), Petrozavodsk (incomes decreased from 24.0 to 18.4 thousand rubles per person) and Vologda (incomes grew from 18.6 to 24.8 thousand rubles per person) (Tab. 7) .
As for expenditures, the nominal expenditures of the budgets of urban districts increased by 25%; however, according to our
Table 6. The ratio of the deficit to the volume of own revenues of the budgets of regional centers of the NWFD, %*
|
Urban district |
2011 |
2012 |
2013 |
2014 |
2015 |
2016 |
2017 |
2018 |
|
Petrozavodsk |
-3.7 |
0.1 |
-20.9 |
-12.8 |
-12.3 |
-9.4 |
-2.1 |
-3.8 |
|
Vologda |
-8.2 |
-16.7 |
-16.3 |
-8.0 |
-11.1 |
-8.2 |
-9.3 |
-2.4 |
|
Syktyvkar |
-5.1 |
14.1 |
-12.1 |
-11.0 |
-9.1 |
-16.9 |
-3.1 |
-0.7 |
|
Arkhangelsk |
11.2 |
6.9 |
5.8 |
5.3 |
2.2 |
7.0 |
0.0 |
-0.3 |
|
Veliky Novgorod |
12.7 |
-19.2 |
-13.1 |
-9.4 |
-11.0 |
-8.7 |
-1.4 |
0.4 |
|
Murmansk |
1.9 |
-5.1 |
-5.6 |
-9.6 |
-3.7 |
0.3 |
-0.4 |
0.7 |
|
Pskov |
-11.3 |
-8.2 |
-8.8 |
-2.7 |
-0.05 |
-0.3 |
-4.3 |
1.2 |
|
Kaliningrad |
-26.5 |
-7.3 |
-4.3 |
9.0 |
-31.7 |
-6.3 |
0.7 |
4.2 |
* Values with the sign «-» mean deficit, with the sign «+» – surplus.
Source: own calculations according to the reports of the Federal Treasury of Russia; reports on the execution of budgets of urban districts; Rosstat.
Figure 5. Dynamics of revenue-based budget security of regional centers of the NWFD per capita, in % to the previous year
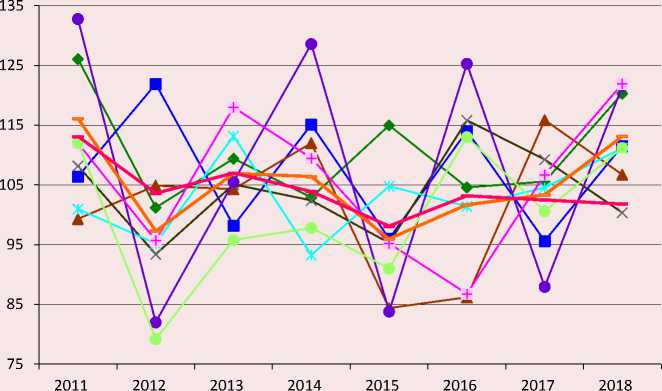
—*— Murmansk
— ■ — Syktyvkar
— ▲ — Kaliningrad
Veliky Novgorod
Arkhangelsk
—•— Pskov
—$— Vologda
♦ Petrozavodsk
^^^^^^^^^^^ Average for NWFD
^^^^^^^е Average for Russia
Source: own calculations according to the reports of the Federal Treasury of Russia; reports on the execution of budgets of urban districts; Rosstat.
calculations, the inflationary impairment of budget expenditures for the analyzed period amounted to 23% (Fig. 6) .
The provision of the population of the capital cities of NWFD regions with budget expenditures per capita exceeded the average level for the cities of the country by 1.7 times, but this was achieved due to high indicators in Murmansk, Syktyvkar and Kaliningrad (Tab. 8) .
In other cities, per capita provision with expenditures was generally lower than the average for urban districts; that is, we can in some way talk about the shortage of public services provided to the population of these cities.
References Budgets of regional centers in the north-west: tools for modernization or survival?
- Friedmann J. Where we stand: A decade of world city research. World Cities in a World-System. Cambridge, 1995. Pp. 21-47.
- Feagin J., Smith M. Cities and the New International Divisions of Location: An Overview. The Capitalist City: Global Restructuring and Community Politics. Oxford, 1987. Pp. 3-34.
- Taylor P. Specification of the world city network. Geographical Analysis, 2001, no. 33, pp. 181-194.
- Taylor P., Walker D., Catalano G., Hoyler M. Diversity and power in the world city network. Cities, 2002, no. 19, pp. 231-241.
- Krätke S. Die globale Vernetzung von Medienzentren. Zur Diversity von Geographien der Globalisierung. Geographische Zeitschrift, 2002, no. 90, pp. 103-123.
- Zubarevich N.V. Russian cities as growth centers. Upravlencheskoe konsul'tirovanie=Management Consulting, 2006, no. 2 (22), pp. 113-118. (In Russian).
- Nefedova T.G., Treivish A.I. Strong and weak cities of Russia. In: Polyusa i tsentry rosta v regional'nom razvitii [Poles and Centers of Growth in Regional Fevelopment.]. Moscow, 1998.
- Smirnova V.V., Shubin S.I. Development of regional сenters of the European North of Russia in conditions of Soviet modernization in 1920-1930. Voprosy territorial'nogo razvitiya=Territorial Development Issues, 2017, no. 3 (38). Available at: http://vtr.vscc.ac.ru/article/2266. (In Russian).
- Bukhval'd E.M., Pechenskaya M.A. Local budgets opportunities in the implementation of municipal development strategies. Problemy razvitiya territorii=Problems of Territory's Development, 2017, no. 4 (90), pp. 37-50. (In Russian).
- Bufetova A.N. Inequalities in spatial development of regional centers and regional periphery. Region: ekonomika i sotsiologiya=Region: Economics and Sociology, 2009, no. 4, pp. 55-68. (In Russian).
- Fujita M., Krugman P., Venables F.J. The Spatial Economy: Cities, Regions and International Trade. Cambridge, 2000.
- Thrift N. The Geography of International Economic Disorder. A World in Crisis? Geographical Perspectives. Oxford, 1989. Pp. 16-78.
- Theil H. Economics and Information Theory. Studies in Mathematical and Managerial Economics. Amsterdam: North-Holland, 1967, p. 120.
- Zubarevich N.V. Cities as centers of modernization of economy and human capital. Obshchestvennye nauki i sovremennost'=Social Sciences and Contemporary World, 2010, no. 5, pp. 5-19. (In Russian).
- Pechenskaya M.A. Development of intergovernmental fiscal relations in Russia in 2000-2015. Problemy prognozirovaniya=Studies on Russian Economic Development, 2017, no. 2, pp. 117-130. (In Russian).
- Odintsova A.V. Local government as an institution of development. Federalizm=Federalism, 2015, no. 2 (78), pp. 87-100. (In Russian).
- Bukhval'd E.M., Pechenskaya M.A. On the budget restrictions of municipal strategic planning. Samoupravlenie=Self-Government, 2016, no. 9 (102), pp. 16-19. (In Russian).
- Dyadik V.V. About problems of strategic planning at municipal level: Russian realities and Scandinavian experience. Regional'naya ekonomika: teoriya i praktika=Regional Economics: Theory and Practice, 2014, no. 6, pp. 53-62. (In Russian).
- Ilyin V.A., Povarova A.I. Problemy effektivnosti gosudarstvennogo upravleniya. Byudzhetnyi krizis regionov: monografiya [Public Administration Efficiency. Budget Crisis of Regions: Monograph]. Vologda: ISERT RAN, 2013. 128 p.
- Bufetova A.N. Inequalities in spatial development of regional centers and regional periphery. Region: ekonomika i sotsiologiya=Region: Economics and Sociology, 2009, no. 4, pp. 55-68. (In Russian).
