Building Predictive Model by Using Data Mining and Feature Selection Techniques on Academic Dataset

Author: Mukesh Kumar, Nidhi, Bhisham Sharma, Disha Handa
Journal: International Journal of Modern Education and Computer Science @ijmecs
Article in issue: 4 vol.14, 2022.
Free access
In the field of education, every institution stores a significant amount of data in digital form on the academic performance of students. If this data is correctly analysed to discover any pattern related to student learning, it can assist the institution in achieving a favorable outcome in the future. Because of this, the use of data mining techniques makes it much simpler to unearth previously concealed information or detect patterns in student data. We use a variety of data mining methods, such as Naive Bayes, Random Forest, Decision Tree, Multilayer Perceptron, and Decision Table, to predict the academic performance of individual students. In the real world, a dataset may contain many features, yet the mining process may only place significance on some of those aspects. The correlation attribute evaluator, the information gain attribute evaluator, and the gain ratio attribute evaluator are some of the feature selection methods that are used in data mining to remove features that are not important for the mining process. Other feature selection methods include the gain ratio attribute evaluator and the gain ratio attribute evaluator. In conclusion, each classification algorithm that is designed using some feature selection methods enhances the overall predictive performance of the algorithms, which in turn improves the performance of the algorithms overall.
Classification Algorithms, Feature Selection, Correlation Attribute Evaluator, Information Gain, Gain Ratio
Short address: https://sciup.org/15018525
IDR: 15018525 | DOI: 10.5815/ijmecs.2022.04.02
Text of the scientific article Building Predictive Model by Using Data Mining and Feature Selection Techniques on Academic Dataset
An educational system's principal purpose should be to prepare students for successful careers within a predetermined time frame. Progress in economics and society is directly linked to the efficiency with which educational systems around the world achieve this goal. Education is a critical component of every nation's and the global community's overall growth and development. In order to ensure that the data associated with the education sector is correctly analysed, maybe yielding some useful insights that might contribute to the continued improvement of students in the future. Data mining and machine learning are the most important tools for this goal because there are so many approaches that aid in finding that crucial information from that enormous database [1]. As a result, data mining and machine learning are the most significant tools. A process known as data mining employs a variety of methods, such as classification, clustering, and association rule mining, in order to extract previously concealed information from a database. Machine learning, much like data mining, is the most efficient and effective method that is used in the field of data analytics in order to anticipate performance by constructing some models and algorithms. This is done in the same way that data mining is done. The goal of machine learning is to teach computers to think and behave more like humans. The following is a list of several algorithms for data mining. These algorithms are often categorized according to their learning style or by similarities in form or purpose, such as classification, regression, decision trees, clustering, deep learning, etc. All of the aforementioned instructional strategies produce a large amount of data regarding the academic development of students, their grades, and their attendance. Nevertheless, this information is rendered meaningless if it is not adequately evaluated. Consequently, the performance of pupils is assessed or evaluated by every educational institution in modern times [2].
Today, educators have access to a wide variety of tests and methods of evaluation to assist them in accurately determining the level of academic achievement exhibited by their students. Data mining is currently one of the most powerful techniques available for use in evaluating or analyzing student data. It is necessary to implement a comprehensive educational overhaul in order for a nation to differentiate itself from the other nations of the world. Data mining techniques make it possible to find patterns and pieces of information that were hidden before in a wide range of information stores. We examine academic data mining to summarize student achievement and qualifications. In the real-world database, we have lots of features and all these features are not important to predict the pattern in the dataset. So, we need to remove some feature from the database for the fast-mining process and accurate result [3]. So, for that purpose, we have a technique such as data mining which helps to remove some features from the database. Feature selection is an important technique in the success of data mining process through which we can select the useful or relevant features in the dataset in use.
In this paper a comparison between different feature selection methods is done along with its impact on the classification algorithms. Education is vital to any nation's progress. So, adequate attention should be given to its implementation. Every institution collected data from students via session tests, assignments, lab evaluations, and personal traits. But all of this information is utilized to determine whether a student passes or fails a test. If student data is analysed timely, it will undoubtedly assist students enhance academic performance [4]. To complete this study on predicting academic performance of the students using different data mining techniques we came across different research and review papers. During literature study on this topic, we found that a most of the researcher of educational data mining communities are trying to develop a system which effectively and efficiently predict the academic performance of the students. Although a lots of data mining algorithms are development in the past like classification algorithms which effectively predict the class level of any datapoint in the data [5].
An educational system's principal purpose should be to prepare students for successful careers within a predetermined time frame. There is a direct link between how well educational systems around the world do their job and how well economics and society move forward in the world. Using data mining, we may better understand the learning process by identifying and measuring its various variables [6]. Data mining in the educational environment is referred to as Educational Data Mining. Many factors influence a student's academic performance, including how many hours a student works outside of the classroom each day, how much money a family makes, and how much schooling their mother has received. Naive Bayes' model has shown that characteristics such as the mother's education and the family's money have a strong correlation with a student's academic success. University costs can be reduced through the use of data mining tools that give a more personalized education, increased system efficiency, and a more efficient education process. Using this as a guide, we can boost student retention and academic accomplishment as a result of student learning [7]. To improve student test scores, data mining prediction techniques help identify the most important aspects that influence a student's score on a test. These factors can then be fine-tuned. It gives the public a new look at the school system that wasn't available before.
The remainder of the study is divided into seven sections. Section-2 highlights related work on predictive modelling and ensembles of classifiers to predict the student academic performance. Section-3 outlines materials and method section, where all details related to data selection, data preprocessing, data mining algorithms, and performance metrics discussed. Section-4 discusses proposed predictive model design with its steps explanation. Section-5 discusses the implementation part of the proposed model with all five data mining techniques. Section-6 is all about the comparative analysis of all the classifiers build with proposed predictive model and Section-7 concludes the work done.
2. Literature Review
During literature review we focus our review towards two main factures, first is to check that which features of the student are mostly affect the academic performance of the students and secondly which classification algorithms are mostly used by researcher to predict the result or performance of the student in academics. The last and most important point is to check the importance of feature selection in the prediction of the academic result. And in most of the research we found that feature selection improves the performance of any prediction model. Educational data mining has helped manage and handle many tasks and issues in educational settings. To improve student and domain models, evaluate the pedagogical support given by learning software, and do scientific research on learning and learners, as Baker advised.
Data mining uses five approaches or methods: prediction, clustering, relationship mining, human judgement distillation, and model discovery. Four categories of EDM tasks were identified by F. Castro et al. such as applications that evaluate student learning performance; course adaptation and learning recommendations based on student behaviour; the development of a method for evaluating materials in online courses; approaches for gathering student and teacher feedback in online courses; and plagiarism detection. Students' academic achievement in a study programme is examined in the Raheela Asif et al. report. For each year of their degree, students are assigned to one of four clusters that signify their academic standing (e.g., x1, x2, x3, x4). The comparison of two successful cohorts was carried out using X-means clustering. Both cohorts show that many students remain in the same sort of group throughout their studies.
The research carried out by Kumar, M., et al. made use of a number of different algorithms, including Decision Tree, Naive Bayes, Random Forest, PART, and Bayes Network. These algorithms were implemented with the assistance of three essential methods: 10-fold cross-validation, percentage split (74 percent), and training set. Following the examination of various metrics (Time to build Classifier, Mean Absolute Error, Root Mean Squared Error, Precision, Recall, F-measure, and ROC Area) produced by various data mining algorithms, it was determined which algorithm performed more effectively on the student dataset that was available [10]. On the student dataset, the Random Forest technique performed far better than another system, with a recall value that was very near to one. The investigation of a variety of data mining techniques has shown how these algorithms increase students' abilities and forecast their performance. Pandey M. and Taruna S. came up with the idea of the Rocchio Algorithm (RA), which was implemented to reduce the negative effects of the "curse of dimensionality" on the performance of PSC. Within the context of the RA-based PSC model of problem classification, several different feature selection strategies are investigated. Multiple research studies that made use of this dataset came to the conclusion that the typical PSC is affected by the dimensionality curse [11]. Researchers by the names of Almutairi F. M. and others analysed the effectiveness of various educational data mining methodologies in determining the likelihood of student failure in introductory programming classes. Several studies have been conducted to investigate the usefulness of these strategies in identifying students who are at risk of failing early enough to intervene, as well as the impact that data preparation and algorithm fine-tuning tasks have on the efficiency of the techniques [12]. These studies are different in the following ways: they look at how well these strategies work to find students who are likely to fail early enough to help them.
Oskouei R. J. et al. utilize mechanics The assessment will be structured so that the results will be collected via a questionnaire. The student evaluation is broken up into two parts: theoretical, which accounts for one half of the total score, and practical, which accounts for the other half. Teaching and learning in a facility that was formerly used for secondary education are not the same as teaching and learning in a polytechnic institution. There is a correlation between students' academic performance and their ability to gain admission to Politeknik Port Dickson. [13]. The researchers, Hussain M. et al., proposed an automatic performance rating system for students that was based on machine learning. The threshold-based segmentation evaluation method is utilized in the MATLAB simulation tool assessment process. Accuracy and mean square error are the metrics used to evaluate the performance of machine learning systems. [14] Thomas and colleagues investigated factors that may contribute to or detract from the academic success of undergraduate students. The research conducted by Yehuala M. A. and colleagues investigates the use of student library assistants to staff academic library chat reference services. It analyses chat transcripts involving professional librarians, paraprofessionals, and undergraduate students to determine the content of the conversations and the quality of the transcripts. According to our analysis of 451 transcripts, undergraduate students are capable of providing excellent chat reference services that are on par with those provided by paraprofessionals and professional librarians [15]. It might be helpful for academic libraries to hire undergraduate students who have received adequate training to work as chat reference personnel. The 23-item Student Course Participation Questionnaire (SCEQ) was used by Brown S. et al. to quantify the level of participation among undergraduate nursing (n = 102) and midwifery (n = 64) students. The study was conducted using a required anatomy and physiology course. Bharara et al. used K-means clustering as a data mining approach to find critical components of a learning context. These connections are used to construct an evaluation of the student's performance [16].
The vast majority of the researchers that contributed to the body of academic literature took various aspects of student characteristics into consideration when collecting data. There are several kinds of student characteristics, including academic, personal, family, social, and institutional, and each of these characteristics plays a role in the creation of predictive models for academic achievement. Another one of the most significant algorithms in data mining helps any data mining classification algorithm achieve a higher level of accuracy. There are methods, like filters and wrapper methods, that fall under the category of Feature Selection. These methods assist in limiting the number of features in a dataset that aren't particularly useful for making predictions about any class. So, when we were looking through the literature, we found some of my feature selection techniques, like the correlation attribute evaluator, the information gain attribute evaluator, and the gain ratio attribute evaluator, which all use ranker as their main search strategy.
Therefore, following the review, we selected an academic dataset from the repository at UCI and attempted to apply the chosen classification algorithms to that dataset. Now, in the next step of our process, we use feature selection methods on the dataset we chose to figure out the top 10 features that will be used in all of the classification algorithms.
3. Material and Methods
This part serves as a foundation for the proposed research project's implementation. This section talks about defining the pre-processing steps and then talking about the final classification methods used for implementation.
A description of the dataset: In this study, two publicly available datasets were used to predict student performance. Secondary school students from two distinct Portuguese high schools compiled all of the data. The collection contains data on students' grades, as well as their personal and demographic characteristics and their involvement in extracurricular activities. All of the data was gathered through the use of school reports and surveys. The first dataset (395) contains data on student performance from a math lesson, whereas the second dataset (649) contains data on student performance from a Portuguese language lesson. A total of 33 features can be found in both datasets [17].
Data Pre-processing: There are a wide variety of possible final grades in this raw dataset, with 0 being the worst and 20 being the best, which is typical of European countries. According to grading requirements, the data must be converted to categories since the students' final grade is in the form of integers and the predicted class should be in the form of categorical values. Our research compared and contrasted two different grading systems: binary and multi-level. First, we separated the final score into five groups. The ranges in question were calculated utilizing the Erasmus methodology. According to Table 1, "fail" is a grade of 0–9, which corresponds to the lowest possible grade.
Grades D, C, B, and A, respectively, are represented by the remaining class labels, which run from 10–11, 12–13, 14–15, and 16–20.
Table 1. Grading categories according to marks obtained by students
|
Level-1 |
Level-2 |
Level-3 |
Level-4 |
Level-5 |
|
Excellent |
Very Good |
Good |
Satisfactory |
Fail |
|
A |
B |
C |
D |
F |
|
Grade between 16 to 20 |
Grade between 14 to 15 |
Grade between 12 to 13 |
Grade between 10 to 11 |
Grade between 0 to 9 |
Classification Techniques: Classification in machine learning and statistics is a method in which a computer programme is trained to create new observations or classifications based on the data it is given. It is possible to classify structured and unstructured data, and the technique can be used to classify both types of data. Predicting the class of provided data points is the first step in the procedure. The terms "target," "label," and "category" are all used to describe these classifications. The work of classification and predictive modelling is to approximate the mapping function from discrete input variables to discrete output variables. Finding out where the new data belongs is the primary objective.
Logistic Regression: A statistical model that determines the relationship between variables and produces a yes/no answer. First, it compares the outcome without any predictors to the baseline outcome, and then it calculates the difference. The variable that was found is put into the model, and the regression coefficient is then calculated [18].
A multilevel logistic regression model may be seen in Equation 1. In this model, the letters A ij stand for the binary answer variable, while the letters Bi j through Bki j represent the k predictor or explanatory variables that were assessed for this subject. In the end, we will call Z1 j through Zm j the m predictor variables that were tested on the jth cluster. logit
(Pr (A = 1)) = « о + « 0 . + « 1 B 1 .. +----+ К к Bk .. + P 1 Z 1 . +----+ ft mzm j (1)
Naïve Bayes: In classifying the data, a Naive Bayes classifier refers to probability theory. The theorem developed by Bayes is utilized by the Naive Bayes classification algorithms. The most important takeaway from Bayes' theorem is that the probability of an event can be recalculated whenever new evidence is added to the mix. A naive Bayes classifier is not a single algorithm but rather a family of machine learning algorithms that make use of statistical independence. This family of algorithms was named after the inventor of the naive Bayes algorithm. These Bayes algorithms are easier to construct and are able to run more effectively than other Bayes algorithms that are more sophisticated.
. Prior x likelihood
Posterior = evidence
P(A/B)
P(A) P(B/A)
P(B)
Equation 2 shows how the generalized form of Equation 3, which is shown in Equation 3, can be used to make a mathematical representation of the posterior.
Random Forest: Regression and classification problems can be solved using a random forest, a machine learning technique. Combining several classifiers to solve complicated problems is what ensemble learning does. In the random forest method, each choice is represented by a single branch of a tree. To get the prediction, Random Forest uses a meta-classifier to select random samples from the dataset and build a decision tree from them. [19] It's part of the larger category of ensemble learning. To figure out the probability, you divide the total number of samples by the number of samples you used to get to the node.
Decision Tree: Decision Trees are a sort of supervised machine learning (you describe what the input is and what the related output is in the training data) in which the data is continually separated based on a specific parameter. Two entities can explain the tree: decision nodes and leaves. The decision tree is made up of several algorithms, including ID3, CART, and C4.5, which are generally used to gather information for making a choice. It is a supervised learning technique that may be used for both classification and regression issues [20].
Multilayer Perceptron: A feedforward artificial neural network that creates a set of outputs from a set of inputs is known as a multilayer perceptron (MLP). An MLP is defined by numerous layers of input nodes that are linked as a directed graph between the input and output layers. Backpropagation is used by MLP to train the network. The neural network classification technique, its supervised learning algorithm, and the data set's linear classifier. The perceptron has three layers: input, output, and hidden. The classification is handled by neural networks [21].
Different Performance Metrics :
Accuracy: One approach to gauging an algorithm's accuracy in classifying a data point is to look at how often it does so accurately. All projected data points are counted to determine accuracy. True positives and true negatives divided by the total number of true positives, true negatives, false positives, and false negatives is a more formal definition of it. True positives and true negatives are data points that the algorithm accurately identifies as either true or untrue. On the other hand, false positives and false negatives are data points that the algorithm wrongly identifies as positive or negative. Accuracy can be defined as the number of occurrences that are correctly identified when different methods of learning are used. Predicting performance using this metric is accurate only when the data is symmetrical. Other performance metrics must also be taken into account [22].
Accuracy =
(tp+tn) tp+fp+fn+tn
In the equation 4, tp = true positive values, tn = true negative, fp = false positive, fn = false negative
Precision: Precision is defined as the proportion of true positives to the sum of true positives and false positives. Precision examines how many false positives were introduced into the mix. If there are no false positives (FPs), the model is perfectly accurate. The more FPs there are in the mix, the worse the precision will look. Precession is defined as the proportion of correctly detected cases over the total number of instances. Low false-positive scores are associated with high precision [23]. To figure out how precise a model is, you need both the positive and negative numbers from the confusion matrix.
(tp)
Precision = tp+fp
The precision is calculated over the entire dataset, as shown in equation 5.
Recall: Recall takes a different path. Instead of counting the number of false positives predicted by the model, recall counts the number of false negatives thrown into the mix. When a false negative is anticipated, the recall rate is punished. Because the penalties for precision and memory are polar opposites, so are the equations. The yin and yang of assessing the confusion matrix are precision and recall. As seen in equation 6, recall is determined as the ratio of total accurately predicted over all instances in the class. The recall mathematical equation is presented as
Recall =
(tp) tp+fn
It is also known as the sensitivity of the event's occurrence [24].
F-Measure: The F1 score is made up of precision and recall. Precision and recall are combined into a single statistic by the F1 score. Additionally, the F1 score is designed to perform effectively with data that is uneven. The harmonic average of precision and recall is what gives an F1 score its name. Precision and recall are averaged together to get the F1 score. The harmonic mean is a sensible choice because they are both rates [25].
(Recall*Precision) F1 Score = 2 *
(Recall+Precision)
As seen in Equation 7, the combined measures have greater sensitivity.
4. Proposed Predictive Model Design
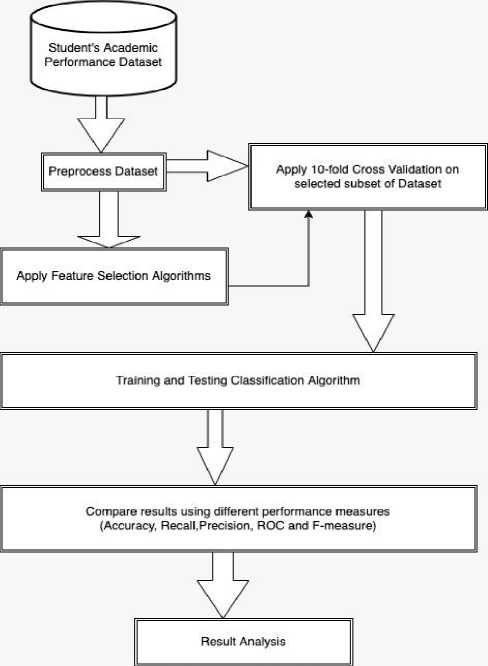
We show how the working design of the proposed predictive model works in conjunction with other significant applications of data mining techniques and feature selection methods, as well as k-fold cross validation as a way of testing the model.
In Fig. 1., we have to choose a dataset that is connected to the academic achievement of the students and has a variety of feature sets. During the preprocessing phase, we have to eliminate any and all discrepancies that may have been present in the dataset when the data was being collected. It is now time to test our dataset in two distinct modes: the first mode will involve testing our dataset with all of the characteristics that are currently included in it, while the second mode will involve using feature selection methods to choose some of the features to test. In this case, we find the accuracy of the classification algorithms by implementing the correlation attribute evaluator, the information gain attribute evaluator, and the gain ratio attribute evaluator as techniques for selecting features. The top 10 features are the only ones that are chosen.
We will now go on to the next phase, which requires us to choose the testing mode as well as the classification methods that will be used in the implementation. All of the prerequisites have been satisfied, and it is now possible to put into practice the classification algorithms described earlier with the assistance of the algorithms for feature selection and ensemble learning.
Student’s Academic Performance Dataset
Preprocess Dataset
Compare results using different performance measures (Accuracy, Recall,Precision, ROC and F-measure)
Training and Testing Classification Algorithm
Apply 10-fold Cross Validation on selected subset of Dataset
Apply Feature Selection Algorithms
Result Analysis
Fig.1. Proposed Predictive Model Design
In the end, we will have to evaluate each of the implemented algorithms against one another to determine which one is superior and provides the highest level of precision in terms of forecasting the outcome.
5. Implementation of Proposed Predictive Model
Our objective in this section is to investigate whether or not the performance of these ensemble methods may be improved by selecting the most important features from the dataset that has been provided. In many real-world classification situations, one of the first steps that must be taken is to reduce the number of attributes contained within a dataset. This must be done before any analysis of the data can be carried out. When reducing the number of attributes in a dataset, it is important to make sure that most of the important information from the original data is kept, based on certain optimality criteria.
Several distinct classification techniques were chosen and used on the dataset containing the academic performance of the students. Python may be used to implement a variety of classification algorithms, including Naive Bayes, Random Forest, Decision Tree, Multilayer Perceptron, and Decision Table Algorithm. Table 2, which displays the results of the implementation of several classification algorithms using k-fold cross validation methods, this is owing to the fact that our dataset is a balanced dataset, meaning that the data is almost equally distributed among the five distinct classes that we have chosen.
Table 2. Classification techniques with their Performance Metrics on Student Dataset
|
Classification Techniques |
Accuracy |
Precision |
Recall |
ROC |
F-Measure |
|
Naïve Bayes Technique |
70.25% |
0.705 |
0.703 |
0.899 |
0.692 |
|
Random Forest Technique |
76.39% |
0.767 |
0.765 |
0.937 |
0.758 |
|
Decision Tree Technique |
69.79% |
0.697 |
0.698 |
0.850 |
0.696 |
|
Multilayer Perceptron Technique |
59.16% |
0.593 |
0.592 |
0.867 |
0.592 |
|
Decision Table Technique |
80.16% |
0.801 |
0.801 |
0.938 |
0.796 |
When compared to other classification algorithms, such as Naive Bayes, Random Forest, Decision Tree, Multilayer perceptron, and Decision Table algorithms, we found that the Decision Table classification algorithm had the highest accuracy, reaching up to 80.16 percent. This was the case when we compared it to the other classification algorithms. The Multilayer Perceptron algorithm achieved the lowest accuracy up to 59.16 percent, which is not a not up to the standard of acceptance. As we can see, this algorithm did not meet the threshold of acceptance. The accuracy of the algorithms, such as Random Forest, has been improved to an acceptable level, which is close to 76.39 percent. For the purpose of putting these algorithms into action, every aspect of the dataset has been taken into consideration here. Accuracy, precision, recall, ROC Area, and F-measure are some of the additional performance metrics that are evaluated in this context together with F-measure. As is the case with our issue, the dataset does not include any outliers; hence, we are just using accuracy as our primary metric to evaluate the effectiveness of our classifier in this instance.
The accuracy of a classification algorithm can be defined as the total number of correct predictions produced by an algorithm for a specific dataset, divided by the total number of predictions made by the algorithm overall. Therefore, accuracy is not an appropriate parameter to use when attempting to quantify the performance of an algorithm while dealing with imbalanced classification issues. The primary issue that arises as a result of an imbalanced dataset is the fact that the number of examples coming from the class with the majority of members will far outnumber those coming from the class with the minority of members. This indicates that any model, regardless of its level of ability, has the potential to earn an accuracy score of up to one hundred percent, depending on the degree to which the class imbalance exists.
Classification techniques with their Performance Metrics on Student Dataset
100.00%
80.00%
60.00%
40.00%
20.00%
0.00%
70.25% 76.39% 69.79% 80.16%
59.16%
-
■ ■■
Accuracy
-
■ Naïve Bayes Technique
-
■ Random Forest Technique
-
■ Multilayer Perceptron Technique
-
-
■ Decision Tree Technique
-
■ Decision Table Technique
Fig. 2. Graphical representation of Accuracy level of Classification techniques with their Performance Metrics on Student Dataset
In this section, we are going to select the best feature using the Ranker Search Method from the student's performance dataset. This feature is going to have the largest impact on the prediction accuracy of the classification method. We have experimented with three distinct methods for evaluating features: the correlation attribute evaluator, the information gain attribute evaluator, and the gain ratio attribute evaluator, all in conjunction with the ranker search approach. Following the discovery of the outcome of the algorithm for the selection of features to implement, we chose ten distinct features that have the greatest influence on the outcome of our forecast. In order to find the best classifiers, which generalise the data with a higher degree of accuracy, we implement various classification algorithms on the student's performance dataset. For each algorithm, we choose different parameters that allow for the most efficient analysis of the dataset and an increase in its generalised accuracy. This allows us to find the best classifiers. Python may be used to implement a variety of classification techniques, including the Naive Bayes algorithm, the Random Forest algorithm, the Decision Tree algorithm, the Multilayer Perceptron algorithm, and the DecisionTable algorithm. Please keep in mind that each classification method that has been made has been tested with k-fold cross validation to see how well the algorithms work with different parameter choices.
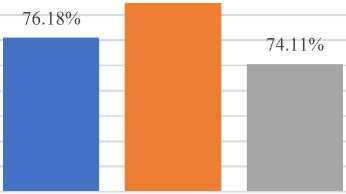
Classification Algorithm after applying Correlation Attribute Evaluator: The results of the implementation of several classification algorithms using the correlation attribute evaluator approach are presented in Table 3. When compared to other classification algorithms, such as Naive Bayes, Random Forest, Decision Tree, Multilayer Perceptron, and Decision Table algorithm, we found that the combination Decision Table classification algorithm achieved the highest accuracy, up to 82.27 percent. This was the case when compared to the results obtained by the other classification algorithms. It has been brought to our attention that the Multilayer Perceptron technique can increase accuracy by up to 71.34 percent. The accuracy requirements for the remaining algorithms have been satisfied to an acceptable level. In order to successfully develop these algorithms, we simply took into consideration the top ten characteristics of the dataset. Other performance metrics like precision, recall, ROC Area, and F-Measure were also taken into account in this study. As is the case with our problem, the dataset doesn't have any "outliers." Because of this, we only use accuracy as our main metric to judge how well our classifier works in this case.
Table 3. Classification algorithm with their Performance Metrics after applying Correlation Attribute Evaluator
|
Classification Techniques |
Accuracy |
Precision |
Recall |
ROC |
F-Measure |
|
Naïve Bayes Technique |
76.18 % |
0.767 |
0.762 |
0.930 |
0.763 |
|
Random Forest Technique |
78.95 % |
0.781 |
0.780 |
0.941 |
0.776 |
|
Decision Tree Technique |
74.11 % |
0.743 |
0.741 |
0.867 |
0.749 |
|
Multilayer Perceptron Technique |
71.34 % |
0.715 |
0.713 |
0.915 |
0.713 |
|
Decision Table Technique |
82.27 % |
0.818 |
0.826 |
0.818 |
0.812 |
Fig. 3 is a graphical representation of the implementation of the classification algorithms that were discussed earlier. This implementation uses the correlation attribute evaluator to pick features, and k-fold cross validation is used as the testing technique. The graph demonstrates rather plainly that the Decision Table classification algorithm performs extraordinarily well in comparison to the performance of other algorithms that were taken into consideration. In contrast, it is clear that nearly all of the classification algorithms were successful in achieving a prediction accuracy of more than 70 percent when measured against the data presented in Fig. 1.
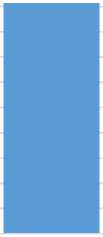
Classification Algorithm after applying information gain attribute evaluator: The phrases that have the highest information gain scores are the ones that are chosen using the information gain attribute evaluator feature selection technique. If the only information that is provided is the presence of a feature and the matching class distribution, then the amount of information that may be gained from the class prediction is measured in bits and referred to as the "information gain." This method determines the value of a feature by measuring the degree to which it is correlated with the class. When analysing nominal properties, a value-by-value approach is taken, with each value being regarded as an indicator in turn. The use of a weighted average allows for the determination of an overall correlation for a nominal feature. It determines the value of a feature by calculating the amount of additional information that it provides in relation to the class. The results of the execution of various classification algorithms are presented in Table 4. This table includes the Information Gain Attribute Evaluator as the feature selection technique and k-fold cross validation as a test option method. Table 4 can be found below. As can be seen from the table, the combined decision table classification method achieved the highest accuracy of up to 83.33 percent when compared to other classification algorithms. This was accomplished in comparison to other classification algorithms. It has come to our attention that the Multilayer Perceptron technique can boost accuracy by as much as 70.63 percent. The accuracy requirements for the remaining algorithms have been satisfied to an acceptable level. We just looked at the top ten features of the dataset when making these algorithms.
Classification algorithm with their Performance Metrics after applying Correlation Attribute Evaluator
84.00%
82.00%
80.00%
78.00%
76.00%
74.00%
72.00%
70.00%
68.00%
66.00%
64.00%
Accuracy

82.27%
-
■ Naïve Bayes Technique
-
■ Random Forest Technique
-
■ Decision Tree Technique
-
■ Multilayer Perceptron Technique ■ Decision Table Technique
85.00%
80.00%
75.00%
70.00%
65.00%
60.00%
Fig. 3. Graphical representation of Accuracy level of Classification Algorithms after applying Correlation Attribute Evaluator
Table 4. Classification algorithm with their Performance Metrics after applying Information Gain Attribute Evaluator
|
Classification Techniques |
Accuracy |
Precision |
Recall |
ROC |
F-Measure |
|
Naïve Bayes Technique |
74.47% |
0.749 |
0.746 |
0.943 |
0.746 |
|
Random Forest Technique |
78.19% |
0.783 |
0.781 |
0.941 |
0.780 |
|
Decision Tree Technique |
78.54% |
0.783 |
0.783 |
0.902 |
0.781 |
|
Multilayer Perceptron Technique |
70.63% |
0.695 |
0.696 |
0.897 |
0.695 |
|
Decision Table Technique |
83.33% |
0.822 |
0.827 |
0.937 |
0.824 |
The graphical depiction of the implementation of the classification algorithms described in the previous paragraph may be found in Figure 4. The graph demonstrates rather plainly that the Decision Table classification algorithm performs extraordinarily well in comparison to the performance of other algorithms that were taken into consideration. When compared to the data in Fig. 1, it is clear that almost all of the classification algorithms were able to make predictions that were more accurate than 70% of the time.
Classification algorithm with their Performance Metrics after applying Information Gain Attribute Evaluator
Accuracy
-
■ Naïve Bayes Technique
-
■ Random Forest Technique
-
■ Multilayer Perceptron Technique
-
-
■ Decision Tree Technique
-
■ Decision Table Technique
84.00%
82.00%
80.00%
78.00%
76.00%
74.00%
72.00%
70.00%
68.00%
66.00%
Fig. 4. Graphical representation of Accuracy level of Classification Algorithm after applying Information Gain Attribute Evaluator
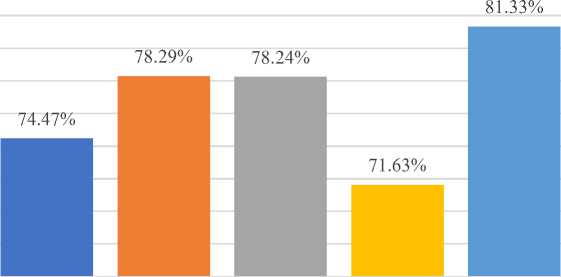
Classification Algorithm after applying Gain Ratio Attribute Evaluator: The results of the implementation of various classification algorithms are presented in Table 5. The Gain Ratio Attribute Evaluator and k-fold cross validation were used as the test option methods. In comparison to the other classification algorithms, we found that the Decision Table approach had the highest accuracy, reaching up to 81.33 percent. As seen here, the Multilayer Perceptron technique has been shown to improve accuracy by up to 71.63 percent. The accuracy requirements for the remaining algorithms have been satisfied to an acceptable level. We just looked at the top ten features of the dataset when making these algorithms.
Table 5. Classification algorithm with their Performance Metrics after applying Gain Ratio Attribute Evaluator
|
Classification Techniques |
Accuracy |
Precision |
Recall |
ROC |
F-Measure |
|
Naïve Bayes Technique |
74.47% |
0.746 |
0.746 |
0.943 |
0.746 |
|
Random Forest Technique |
78.29% |
0.785 |
0.782 |
0.941 |
0.781 |
|
Decision Tree Technique |
78.24% |
0.783 |
0.783 |
0.902 |
0.781 |
|
Multilayer Perceptron Technique |
71.63% |
0.695 |
0.696 |
0.877 |
0.695 |
|
Decision Table Technique |
81.33% |
0.812 |
0.817 |
0.877 |
0.824 |
The graphical representation of the classification algorithms' implementation described in the previous paragraph may be found in Figure 5. The graph shows very clearly that the Decision Table classification algorithm does much better than any of the other algorithms that were looked at.
Classification algorithm with their Performance Metrics after applying Gain Ratio Attribute Evaluator
Accuracy
■ Naïve Bayes Technique
■ Random Forest Technique
■ Multilayer Perceptron Technique
■ Decision Tree Technique
■ Decision Table Technique
6. Results and Discussion
Fig. 5. Graphical representation of Accuracy level of Classification Algorithm after applying Gain Ratio Attribute Evaluator
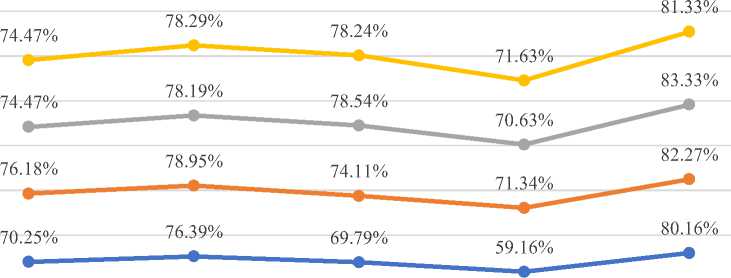
In this part of the article, we are going to look at a comparison study of all of the different algorithms that have been put into action. First, using k-fold cross validation as a testing option, we compare the prediction accuracy of classification algorithms that employ ensemble learning with and without using ensemble learning. This comparison was made using the ensemble learning method. Table 6 provides a list of the algorithms that were taken into account, so we can go through each one of the following algorithms in turn as we go through the table 6.
Naïve Bayes Classification Technique: In this instance, we utilized three distinct methodologies for feature selection, with k-fold cross validation serving as the testing option technique. As a result of our research, we came to the conclusion that the Naive Bayes algorithm worked extraordinarily well on the provided dataset, outperforming any other combination to attain the highest possible accuracy of 76.18 percent. Based on the results presented in Table 6, we can deduce that the classification algorithm that did not make use of any feature selection methods achieved the lowest level of accuracy compared to the other feature selection methods. When used with a method for selecting features, the Naive Bayes algorithm can get maximum improvements of more than 5%.
Random Forest Classification Technique: Table 6, we discovered that the Random Forest did remarkably well in comparison to other combinations on the provided dataset, and it was able to attain the highest accuracy of up to 78.95 percent. When compared to the other feature selection methods, it is clear that the classification algorithm that didn't use any feature selection methods was the least accurate.
Table 6. Comparison of different classification Algorithms with their Prediction Accuracy
|
Classification Algorithms |
Accuracy (Baseline) |
Accuracy (Correlation Attribute Evaluator) |
Accuracy (Information Gain Attribute Evaluator) |
Accuracy (Gain Ratio Attribute Evaluator) |
|
Naïve Bayes Technique |
70.25% |
76.18 % |
74.47% |
74.47% |
|
Random Forest Technique |
76.39% |
78.95 % |
78.19% |
78.29% |
|
Decision Tree Technique |
69.79% |
74.11 % |
78.54% |
78.24% |
|
Multilayer Perceptron Technique |
59.16% |
71.34 % |
70.63% |
71.63% |
|
Decision Table Technique |
80.16% |
82.27 % |
83.33% |
81.33% |
Classification Method Using Decision Tree: Table 6., we discovered that the decision tree did remarkably well in comparison to other combinations on the provided dataset, and it was able to attain the maximum accuracy of 78.54 percent. When compared to the other feature selection methods, it is abundantly evident that the classification algorithm that did not make use of any feature selection methods achieved the lowest level of accuracy. With the feature selection algorithm, the highest improvement that can be gained from using the decision tree approach is greater than 8%.
Using the Multilayer Perceptron Classification Technique: Table 6., we discovered that the Multilayer Perceptron did remarkably well in comparison to other combinations on the provided dataset, and it was able to attain the maximum accuracy of 71.63 percent. When compared to the other feature selection methods, it is abundantly evident that the classification algorithm that did not make use of any feature selection methods achieved the lowest level of accuracy. When the Multilayer Perceptron algorithm is used with the feature selection method, the maximum improvement goes up by more than 12%.
We observed that the decision table classification technique performed remarkably well as compared to other combinations on the provided dataset, and it was able to obtain the greatest accuracy of 83.33 percent. This is shown in Table 6. From the table, it is clear that the classification algorithm that didn't use any method of feature selection was the least accurate.
Comparison of different classification Algorithms with their Prediction Accuracy
Naïve Bayes Random Forest Decision Tree Multilayer Perceptron Decision Table
Technique Technique Technique Technique Technique
Accuracy(Gain Ratio Attribute Evaluator)
—•— Accuracy (Information Gain Attribute Evaluator)
—•—Accuracy (Correlation Attribute Evaluator)
—•—Accuracy(Baseline)
Fig. 6. Comparison of different classification Algorithms with their Prediction Accuracy
Fig. 6. Show the graphical comparison of different classification Algorithms with their prediction accuracy. As we can see that the predictive accuracy of any classification algorithms without feature selection methods is little bit low as compared to when we apply feature selection on our selected dataset. In the case of naïve bayes technique, accuracy level of prediction increased from 70.25% to 76.18%. Decision Tree, Multilayer Perceptron, Decision Tree and Random Forest technique are also performed well. But the maximum accuracy is achieved by Decision Table technique and it is upto 83.33%.
7. Conclusion
A complete analysis of algorithms using various performance measures is taken into account because it provides us with a better understanding of the algorithms. Various performance metrics such as accuracy, precision, recall, F-Measure, and ROC area were considered. The predictability of an algorithm is determined by comparing different algorithms using different metrics. According to the literature review, it is difficult to predict which performance measurements are better for which problems because each problem has unique characteristics. As a result, it is recommended that multiple measurements be combined for a better algorithm outcome. We investigated the performance of various selected data mining algorithms on the dataset in question using some feature selection approaches. Lastly, we can say that the performance of any classification algorithm that is used with some feature selection methods is better. The approach provided in this study will assist educational administrators and policymakers in developing new policies and curriculum related to student retention in higher education. This research can also help identify pupils in danger of dropping out of school early, allowing for timely support and intervention. We obtain the performance accuracy and efficiency of single classifiers versus ensembles of classifiers.
Acknowledgment
I am grateful to my guide Dr. Bhisham Sharma for valuable suggestion provided by them during the study.
References Building Predictive Model by Using Data Mining and Feature Selection Techniques on Academic Dataset
- Asif R., Merceron A., & Pathan M. K. (2015). Investigating performance of students: a longitudinal study. In Proceedings of the Fifth International Conference on Learning Analytics and Knowledge (pp. 108-112). ACM.
- Kumar M., & Singh A. J. (2017). Evaluation of Data Mining Techniques for Predicting Student’s Performance. International Journal of Modern Education and Computer Science, 9(8), 25.
- Yahya A. A. (2017). Swarm intelligence-based approach for educational data classification. Journal of King Saud University-Computer and Information Sciences.
- Costa E. B., Fonseca B., Santana M. A., de Araújo F. F., & Rego J. (2017). Evaluating the effectiveness of educational data mining techniques for early prediction of students' academic failure in introductory programming courses. Computers in Human Behavior, 73, 247-256.
- Ghani A. A., & Mohamed R. (2017). The Effect of Entry Requirement for Civil Engineering Student Performance. Journal of Science and Technology, 9(4).
- Ramanathan L., Parthasarathy G., Vijayakumar, K., Lakshmanan, L., & Ramani, S. (2018). Cluster-based distributed architecture for prediction of student’s performance in higher education. Cluster Computing, 1-16.
- Thomas, C. L., Cassady, J. C., & Heller, M. L. (2017). The influence of emotional intelligence, cognitive test anxiety, and coping strategies on undergraduate academic performance. Learning and Individual Differences, 55, 40-48.
- F. Castro, A. Valid, `A. Neat, and F. Mugica, “Applying data mining techniques to e-learning problems,” in Evolution of teaching and learning paradigms in intelligent environment, pp. 183–221, Springer,2007.
- Asif R., Haider N. G., & Ali S. A. (2016). Prediction of Undergraduate Student's Performance using Data Mining Methods. International Journal of Computer Science and Information Security, 14(5), 374.
- Kumar, M., Singh, A. J., & Handa, D. (2017). Literature survey on student’s performance prediction in education using data mining techniques. International Journal of Education and Management Engineering (IJEME), 7(6), 40-49.
- Pandey M., & Taruna S. (2016). Towards the integration of multiple classifiers pertaining to the student’s performance prediction. Perspectives in Science, 8, 364-366.
- Almutairi F. M., Sidiropoulos N. D., & Karypis G. (2017). Context-aware recommendation-based learning analytics using tensor and coupled matrix factorization. IEEE Journal of Selected Topics in Signal Processing, 11(5), 729-741.
- Oskouei R. J., & Askari M. (2014). Predicting academic performance with applying data mining techniques (Generalizing the results of two different case studies). Computer Engineering and Applications Journal, 3(2), 79.
- Hussain M., Al-Mourad M., Mathew S., & Hussein A. (2017). Mining educational data for academic accreditation: Aligning assessment with outcomes. Global Journal of Flexible Systems Management, 18(1), 51-60.
- Yehuala M. A. (2015). Application of Data Mining Techniques for Student Success and Failure Prediction (The Case of Debre Markos University). International Journal of Scientific & Technology Research, 4(4), 91-94.
- Brown S., Bowmar A., White, S., & Power, N. (2017). Evaluation of an instrument to measure undergraduate nursing student engagement in an introductory Human anatomy and physiology course. Collegian, 24(5), 491-497.
- Tran T. O., Dang H. T., Dinh, V. T., & Phan, X. H. (2017). Performance Prediction for Students: A Multi-Strategy Approach. Cybernetics and Information Technologies, 17(2), 164-182.
- Bharara S., Sabitha S., & Bansal A. (2017). Application of learning analytics using clustering data Mining for Students’ disposition analysis. Education and Information Technologies, 1-28.
- Kumar, M., Singh, A. J., & Handa, D. (2017). Literature survey on educational (IJEME) dropout prediction. International Journal of Education and Management Engineering, 7(2), 8.
- Kumar, M., Bajaj, K., Sharma, B., & Narang, S. (2021). A Comparative Performance Assessment of Optimized Multilevel Ensemble Learning Model with Existing Classifier Models. Big Data.
- Kumar, M., Mehta, G., Nayyar, N., & Sharma, A. (2021). EMT: Ensemble meta-based tree model for predicting student performance in academics. In IOP Conference Series: Materials Science and Engineering (Vol. 1022, No. 1, p. 012062). IOP Publishing.
- Walia, N., Kumar, M., Nayar, N., & Mehta, G. (2020, April). Student’s Academic Performance Prediction in Academic using Data Mining Techniques. In Proceedings of the International Conference on Innovative Computing & Communications (ICICC).
- Awoyelu I.O., Oguntoyinbo E. O., Awoyelu T. M., " Fuzzy K-Nearest Neighbour Model for Choice of Career Path for Upper Basic School Students ", International Journal of Education and Management Engineering (IJEME), Vol.10, No.4, pp.18-32, 2020. DOI: 10.5815/ijeme.2020.04.03.
- Phyo Thu Thu Khine, Htwe Pa Pa Win, Tun Min Naing, "Towards Implementation of Blended Teaching Approaches for Higher Education in Myanmar", International Journal of Education and Management Engineering (IJEME), Vol.11, No.1, pp. 19-27, 2021. DOI: 10.5815/ijeme.2021.01.03.
- Mohammed Abdullah Al-Hagery, Maryam Abdullah Alzaid, Tahani Soud Alharbi, Moody Abdulrahman Alhanaya, "Data Mining Methods for Detecting the Most Significant Factors Affecting Students’ Performance", International Journal of Information Technology and Computer Science (IJITCS), Vol.12, No.5, pp.1-13, 2020. DOI: 10.5815/ijitcs.2020.05.01.
