Capabilities of structure modeling for azaheterocycles and the comparison to FTIR spectroscopy data

Author: Grishina M.A., Potemkin V.A.
Journal: Вестник Южно-Уральского государственного университета. Серия: Химия @vestnik-susu-chemistry
Section: Физическая химия
Article in issue: 1 т.10, 2018.
Free access
The capabilities of algorithms Globa-AlteQ, MultiGen-AlteQ, MOPS-AlteQ for modeling the structures of both individual molecules and their complexes in liquids, solutions and crystals have been considered. The calculated and experimental IR spectra have been compared. It has been shown that the frequencies in the calculated and experimental spectra are consistent with the correlation coefficients of not less than 0.99, which indicates good possibilities of the methods in modeling both individual molecules and their complexes in liquids, solutions and crystals. Moreover, the proposed methods can be successfully used to further confirm the structure. This is especially important for liquids and solutions where direct structure determination by X-ray diffraction methods is impossible.
Molecular modeling, azaheterocycles, ir spectroscopy, molecular complexes
Short address: https://sciup.org/147160415
IDR: 147160415 | UDC: 543.42.061 | DOI: 10.14529/chem180103
Возможности моделирования структуры азагетероциклов и сравнение с данными ИК-Фурье спектроскопии
Рассмотрены возможности методов моделирования структур как индивидуальных молекул, так и их комплексов в жидкостях, растворах и кристаллах. Проведено сопоставление расчетных и экспериментальных ИК спектров. Показано, что частоты в расчетных и экспериментальных спектрах согласуются с коэффициентами корреляции не ниже 0,99, что говорит о хороших возможностях методов в моделировании как индивидуальных молекул, так и их комплексов в жидкостях, растворах и кристаллах. Более того, предложенные методы могут быть успешно использованы для дополнительного подтверждения структуры. Особенно это важно для жидкостей и растворов, где прямое определение структуры рентгеноструктурными методами невозможно.
Text of the scientific article Capabilities of structure modeling for azaheterocycles and the comparison to FTIR spectroscopy data
The quality of modeling structures of substances largely determines the quality of modeling most physical and chemical properties and processes. Therefore, it is important to determine how correctly the suggested approaches can simulate the structure of nitrogen-containing heterocycles and their associates with process components. While studying the structures of compounds it is convenient to use IR spectroscopy, which shows well-interpreted characteristic frequencies. With the use of this information it is possible to judge the tautomeric conformational state of the compound, the formation of associates, etc. This information is especially useful in the study of substances in liquid and gas phases, which cannot be investigated by X-ray analysis. Therefore, to compare the quality of modeling the geometry of nitrogencontaining heterocycles and their complexes with the algorithms Globa-AlteQ, MultiGen-AlteQ [1–6], MOPS-AlteQ [6–16], the experimental and calculated IR spectra of model structures have been compared.
Methodology of Research
To determine the quality of modeling the structures of substances using algorithms Globa-AlteQ, MultiGen-AlteQ, MOPS-AlteQ in application to nitrogen-containing heterocycles, a number of compounds of the pyridine and pyrazine series were studied: both individual substances in the crystalline state, and their complexes, and solutions. For the analysis we used the IR spectra of the compounds experimentally determined by a Nicolet 380 FTIR spectrometer. When comparing the calculated and experimental spectra, we tried to achieve the coefficient B = 1 in the equation:
νexp = A+Bνcalc, where νexp is the experimental frequency; νcalc is the calculated frequency; and the minimal number of outliers. The calculation of the IR spectra was carried out at the level of the DFT theory B3LYP 6-311G (d, p). The following sections consider the results of this research.
Simulation of the geometry of 2-amino-6-methylpyridine using MultiGen-AlteQ and comparison with the IR spectroscopy data
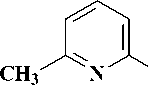
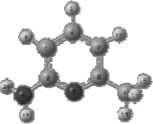
The structure of 2-amino-6- methylpyridine is shown in Fig. 1.
а)
b)
Fig. 1. Structural formula (a) and geometric (b) structure of the molecule, determined by the Globa-AlteQ algorithm, for 2-amino-6-methylpyridine
The experimental spectrum is shown in Fig. 2a. The theoretically calculated IR spectrum for a mo lecule in the geometry obtained using the Globa -AlteQ algorithm for one 2-amino-6-methylpyridine molecule is shown in Fig. 2b.
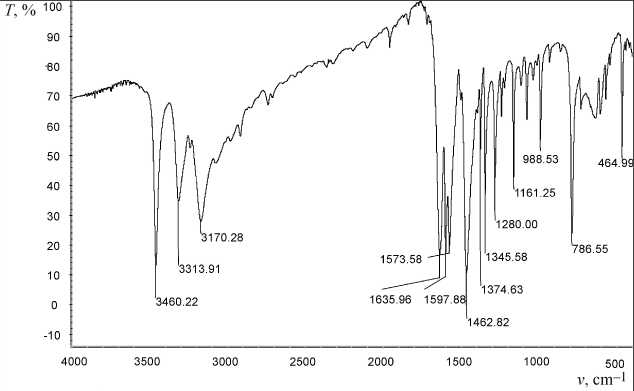
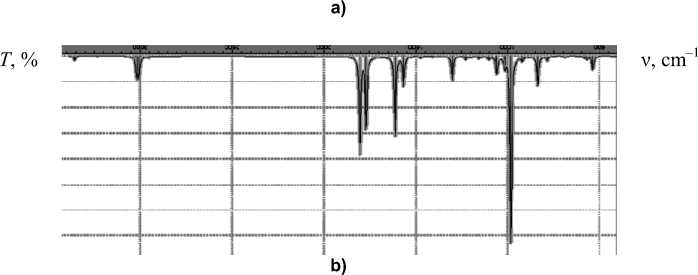
Fig. 2. FTIR spectrum of 2-amino-6-methylpyridine: a) experimental; b) calculated ( T – transmittance, ν is wave number)
Comparison of the experim ental IR spectrum with the theoretically calcul ated one shows a high convergence of the experimental and theoretical data. The fundamental frequenc ies in the observed ex perimental spectrum are clearly l ocated in the theoretical one, too. The experime ntal and theoretical fr e quencies are shown in Fig. 3. The relationship is described by the equation:
ν exp =1.031ν calc – 225.
The correlation coefficient is 0.996. The coefficient in the first term is close to 1, which shows good reproducibility of the experimental frequencies. Nevertheless, the bathochromic shift 225 cm–1 in the experimental spectrum with respect to the theoretical spectrum is observed. The intensities of the bands in the calculated and experimental IR spectra have different values (Fig. 2), which may be due to theo- retical calculation of only one molecule, while in a substance this molecule is surrounded by a number of neighbors. The theoretical spectrum makes it possible to judge the presence of the corresponding bands in the IR spectrum only on a qualitative level. However, the high convergence of the experimental and theoretical frequencies in the IR region makes it possible to use this theoretical spectrum for detailed interpretation of the bands in the experimental spectrum, and to assign most of the bands to the corresponding vibrations.
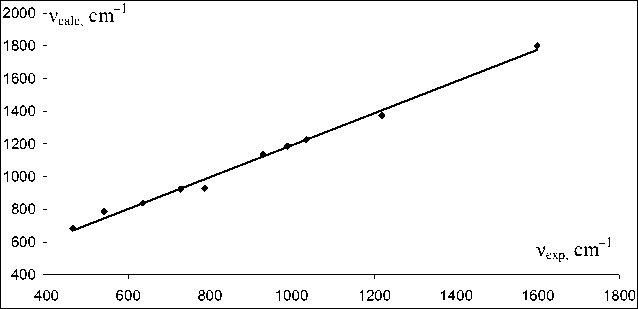
Fig. 3. Experimental and calculated frequencies for 2-amino-6-methylpyridine
For each frequency in the IR spectrum, the atomic vibration modes that are presented in Table 1 have been calculated, as well as in Fig. 4. The change in the position of the atoms (arrows in the Fig. 4) at 1229.2 (1372) cm–1 and 1597.88 (1802) cm–1 for the 2-amino-6-methylpyridine molecule is related to the deformation vibrations of С-Н and С-С bonds, respectively. These calculations and comparison with the experiment have made it possible to assign the bands of the IR spectrum of 2-amino-6-methylpyridine to the corresponding group vibrations (Table 1).
Table 1
Characteristic frequencies of the IR spectrum of 2-amino-6-methylpyridine
|
ν exp , cm–1 |
ν calc , cm–1 |
Vibrating atoms |
μ max |
|
464.99 |
683 |
4,12 |
0.38 |
|
14,15 |
0.04 |
||
|
541.56 |
784 |
3,8 |
0.18 |
|
14,15 |
0.10 |
||
|
1,6,10,11,13,16 |
0.06 |
||
|
635.73 |
836 |
8 |
0.48 |
|
4,13 |
0.22 |
||
|
14,15 |
0.02 |
||
|
728.4 |
921 |
4,12 |
0.45 |
|
1,7,10,11,14,15 |
0.02 |
||
|
786.55 |
927 |
10,11 |
0.46 |
|
6 |
0.02 |
||
|
1138 |
12 |
0.74 |
|
|
4 |
0.22 |
||
|
1229 |
14 |
0.25 |
|
|
15 |
0.15 |
||
|
930 |
1311 |
8 |
0.51 |
|
4 |
0.20 |
||
|
1219.2 |
1372 |
14,15 |
0.49 |
|
13,16 |
0.01 |
||
|
1597.88 |
1598 |
10,11 |
0.19 |
|
1,2 |
0.14 |
||
|
7,9 |
0.08 |
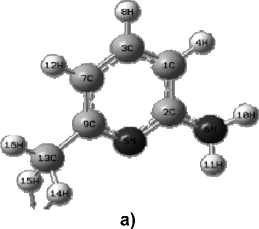
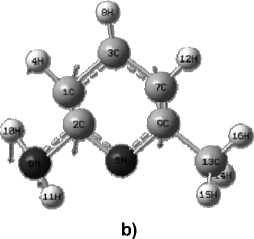
Fig. 4. Vibrations of 2-amino-6-methylpyridine: a) 1229 (1372) cm–1; b) 1598 (1802) cm–1
Thi s a ss ig nme nt of ba nds i s in g ood a g r e e me nt wit h t heir ty pic al v a lu e s ν exp , cm–1. Characteristic frequencies in the F TIR sp ec t r um of 2-amino-6-methylpyridine spectrum are likely to appear due to in-t e r mole c u lar in te ra c t ion s in the c ondensed phase, which is not taken into account in the per forme d calculation.
Modeling of intermolecular interactions in an isopropyl alcohol solution of 2-hydroxy-3-allyloxyquinoxaline in the presence of bromate with MOPS-AlteQ and comparison with the results of FTIR spectroscopy
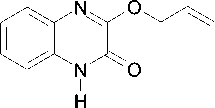
Modeling the geometry of 2-hydroxy-3-allyloxyquinoxaline using the Globa-AlteQ algorithm has been carried out (Fig. 5). The calculation of the IR spectra of the compound in the gas phase has demon- strated insufficient consideration of interactions with the solvent and hydrobromic acid, taking into account that the presence of quinoxaline nitrogen atoms can lead to formation of quinoxalinium salt in the presence of HBr; no strict correlation between the calculated and experimental frequencies is shown.
NO
N OH
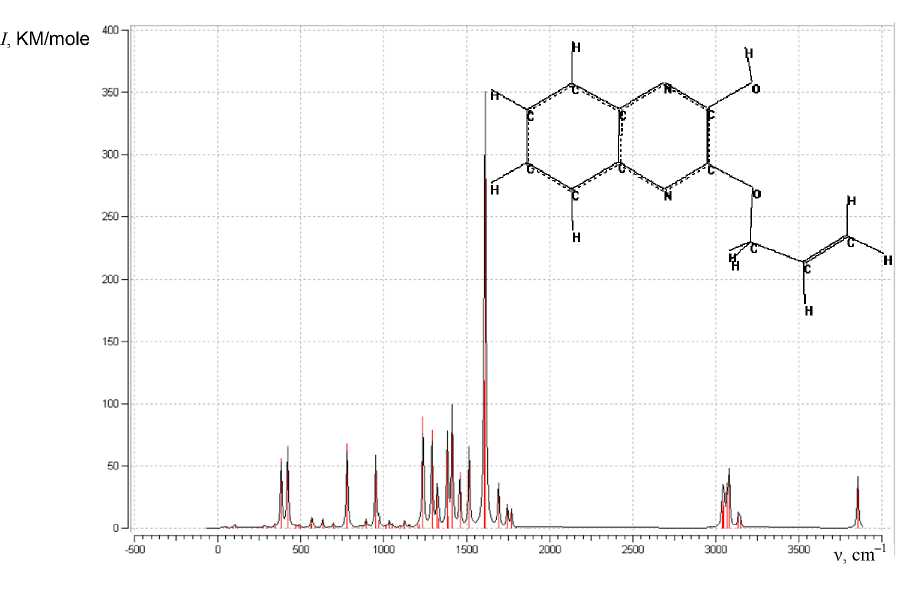
Fig. 5. The calculated IR spectrum of 2-hydroxy-3-allyloxyxyquinoxaline ( I – intensity)
Therefore, the complex of 2-hydroxy-3-allyloxyxyquinoxaline with isopropyl alcohol and hydrobromic acid was modeled within MOPS-AlteQ algorithm. Two possible tautomers (Scheme 1) of 2-hydroxy-3-allyloxyquinoxaline were examined. The lowest energy complex is shown in Fig. 6. It has been found that this associate includes a tautomer with a hydroxyl group. The model complex includes the hydrogen bond N ··· H (1.82 Å) between the nitrogen of the quinoxaline and the hydrogen of the hydroxyl group of isopropyl alcohol. All atoms of the 2-hydroxy-3-allyloxyquinoxaline molecule are in the plane of the ring, except for the hydrogen atoms of the methylene group. The HBr is located under the plane of the quinoxaline ring in Fig. 6, and the really formed quinoxaline complex with HBr can be considered a salt structure. The calculated IR spectrum of the complex is shown in Fig. 7.

NO

N OH
Scheme 1
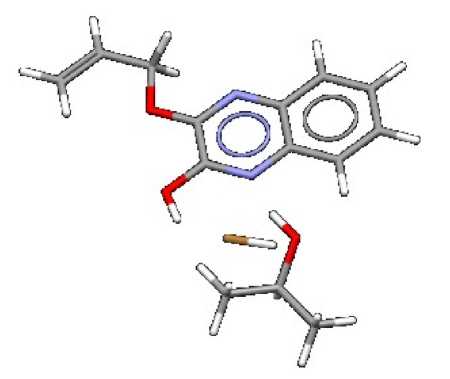
Fig. 6. The model complex of 2-hydroxy-3-allyloxy-quinoxaline with isopropyl alcohol and hydrobromic acid, obtained within MOPS-AlteQ
It has been found that additional bands at 676 cm–1 appear with the integrated intensity I = 36, 708 cm–1 (I = 33), 3702 cm–1 (I = 453) and 3779 cm–1 (I = 192) in comparison with the calculated spectrum of the individual substance, presented in Fig. 5.
When comparing the experimental IR spectrum with the IR spectrum of a trimolecular complex, the regression equation is as follows
ν exp =1.0095ν calc +70.3.
The correlation coefficient is R = 0.99993, standard deviation is 4.5 cm–1. The obtained dependence of the coincident experimental and calculated frequencies is shown in Fig. 8. The numerical values of the frequencies are shown in Table 2. The obtained data show that the calculated spectrum is slightly shifted to the longer-wave region by only 70 cm–1 compared to the experimental spectrum, which is significantly lower than the estimation of the spectra for the isolated 2- hydroxy-3-allyloxy-quinoxaline.
D , %
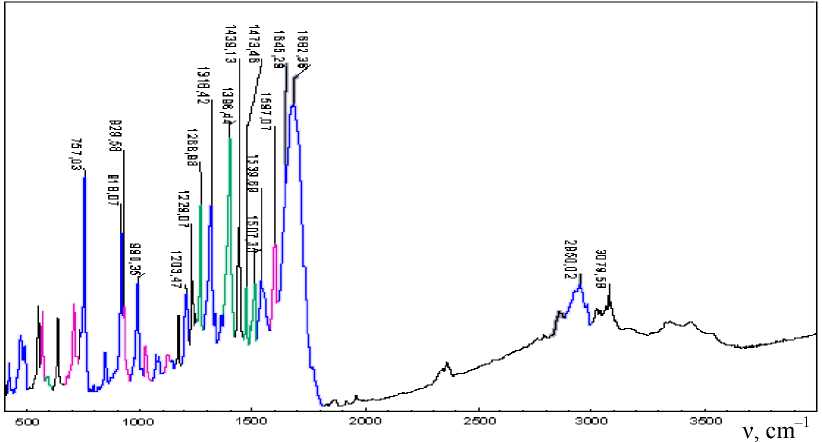
a)
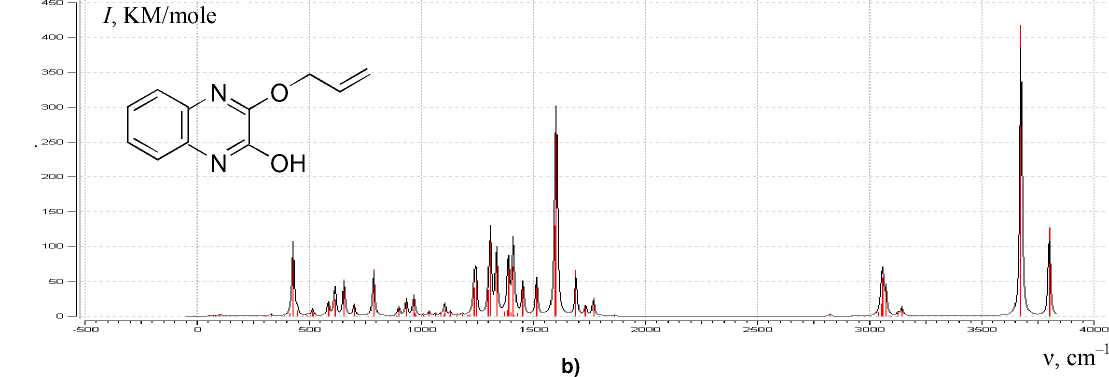
Fig. 7. Comparison of the experimental IR spectrum (а) and the calculated IR spectrum (b) of the 2-hydroxy-3-allyloxyquinoxaline trimolecular complex with isopropyl alcohol and hydrobromic acid
ν calc ,cm -1
Fig. 8. The frequencies of the experimental and calculated IR spectra of the trimolecular complex of 2-hydroxy-3-allyloxyxyquinoxaline with isopropyl alcohol and hydrobromic acid
Table 2
Comparison of the frequencies of the experimental and calculated IR spectra of the trimolecular complex consisting of a 2-hydroxy-3-allyloxyquinoxaline molecule with isopropyl alcohol and hydrobromic acid
|
ν exp , cm–1 |
ν calc , cm–1 |
|
1682.36 |
1602.72 |
|
1597.07 |
1513.78 |
|
1539.69 |
1453.02 |
|
1507.35 |
1425.79 |
|
1473.46 |
1387.53 |
|
1396.44 |
1308.4 |
|
1318.42 |
1235.16 |
|
1268.98 |
1181.66 |
|
1203.47 |
1129.05 |
|
587.5 |
514.014 |
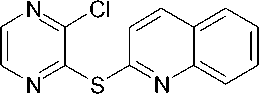
Modeling of intermolecular interactions in crystalline 2-chloro-3-(2-quinolylthio) pyrazine using MOPS-AlteQ and comparison with IR spectroscopy data
The geometry of 2-chloro-3-(2-quinolylthio)pyrazine was simulated using the Globa-AlteQ algorithm.
The calculation of the IR spectra of 2-chloro-3-(2-quinolylthio)pyrazine in the gas phase has shown that in the calculated spectrum of 2-chloro-3-(2-quinolylthio)pyrazine the following frequencies are in a good agreement with vibrations C = N and quinoline ring: 1779 cm–1 (I = 55), 1750 cm–1 (I = 48), 1660 cm–1 (I = 20), 1223 cm–1 (I = 18), 953 cm–1 (I = 17), 654 cm–1. The frequencies 1719 cm–1 (I = 11), 1699 cm–1 (I = 21), 1412 cm–1 (I = 106), 1277 cm–1 (I = 10), 1040 cm–1 (I = 73 ), 759 cm–1 (I = 5) and 676 cm–1 (I = 3) correspond to the vibrations of C = N and the pyrazine ring. The calculated spectrum is presented in Fig. 9. However, unaccounted intermolecular interactions do not give strict correlation between the calculated and experimentally observed IR frequencies.
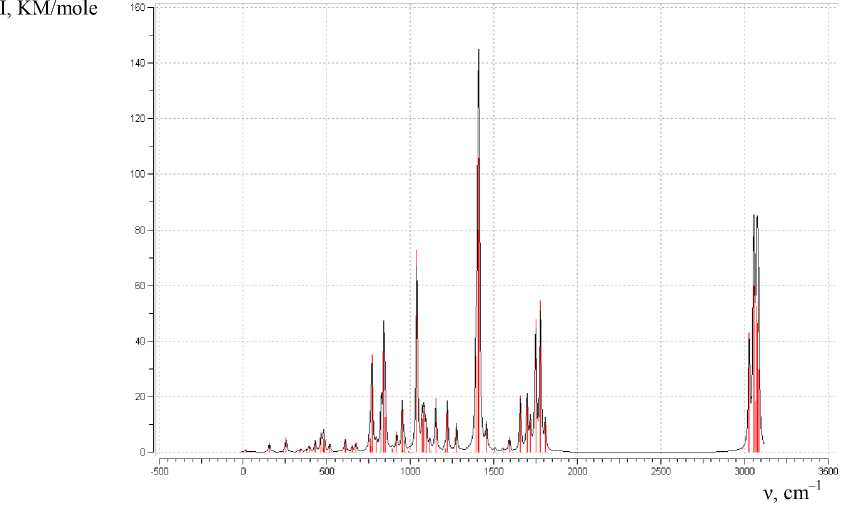
Fig. 9. Estimated spectrum of 2-chloro-3- (2-quinolylthio) pyrazine in the gas phase
To ac c oun t f o r in ter mole cular interactions and for more detailed analysis of the I R spe c tr um of a cr y stall ine s ubs ta nce , th e bi mole cular complex has been modeled using the MOPS-AlteQ algorithm. The re su lt ing st r ucture of the c o mple x is sh own in Fig. 10.
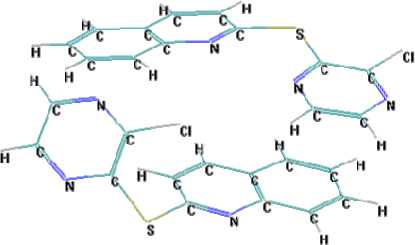
Fig. 10. The bimolecular complex of 2-chloro-3-(2-quinolylthio)pyrazine
I t ha s be e n shown that in t his c omple x π-stacking interactions between the benzene fragment of the q uinol in e of one mole c u le and th e pyrazine aromatic system of the second molecu l e are formed.
The expe rime ntal F T I R spe ctrum of the pyrazine derivative has been compa r e d to the c a l c ul a ted I R s pe ctr a of th e c omple x. T h e r esult of the maximum coincidence of the calculated and e x pe rime nta l spe ctra is shown in Fig. 11.
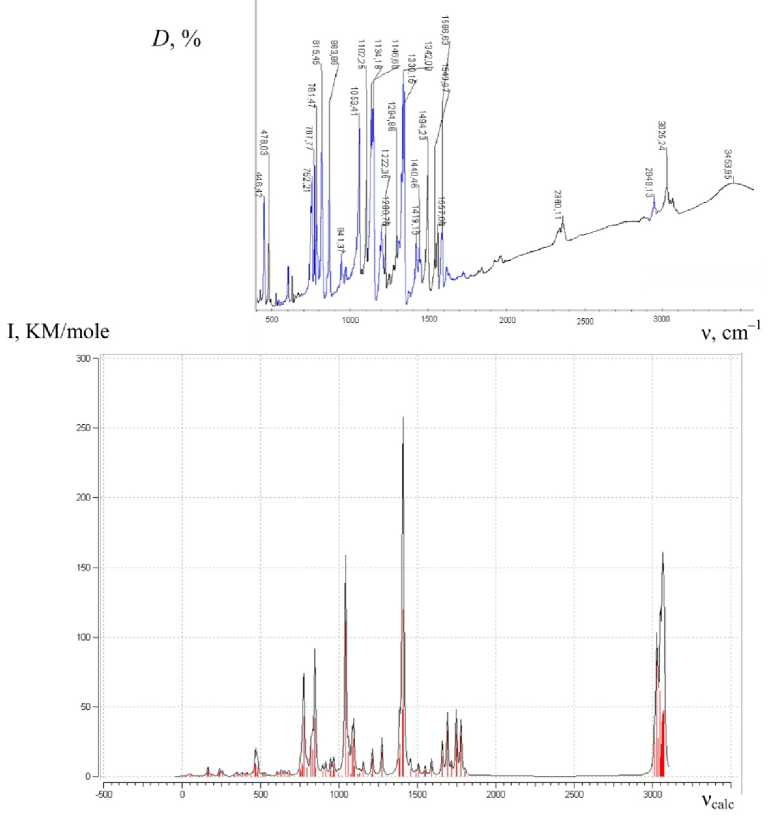
Fig. 11. Comparison of the experimental IR spectrum of 2-chloro-3- (2-quinolylthio) pyrazine and the calculated IR spectrum of the bimolecular complex of this compound (D – absorbance)
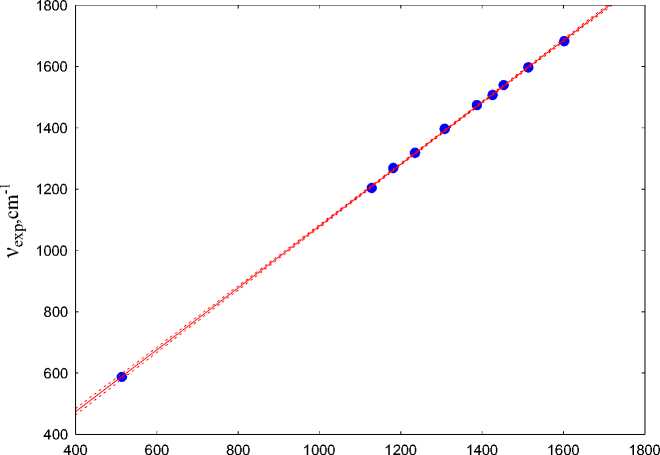
It has been found that the calculated spectrum is in good agreement with the experimental one. The complete analysis has been carried out for the reproducibility of the peaks in the experimental IR spectrum compared to the calculated IR spectrum of a bimolecular complex, as a result of which a regression equation of the relationship ν exp and ν calc has been obtained:
ν exp =1.0013ν calc –74.7.
The correlation coefficient is R = 0.9999, standard deviation is 6.7 cm–1. The frequencies of the experimental IR spectrum of 2-chloro-3-(2-quinolylthio)pyrazine and the calculated IR spectrum of the bimolecular complex are presented in Fig. 12. Table 3 gives the values of the calculated and experimentally determined frequencies, showing an insignificant shift of the calculated spectrum from the experimental one to the shorter wavelength region (Table 3).
Table 3
Comparison of the frequencies of the experimental IR spectrum of 2-chloro-3- (2-quinolylthio) pyrazine and the calculated IR spectrum of the bimolecular complex
|
ν exp , cm–1 |
ν calc , cm–1 |
ν exp , cm–1 |
ν calc , cm–1 |
|
2949.13 |
3011.49 |
1134.18 |
1209.71 |
|
1723.53 |
1805.36 |
1053.41 |
1133.58 |
|
1617.65 |
1691.03 |
976.47 |
1041.21 |
|
1586.63 |
1658.93 |
941.37 |
1015.22 |
|
1494.23 |
1550.28 |
863.86 |
946.305 |
|
1440.46 |
1507.16 |
815.45 |
896.517 |
|
1419.15 |
1489.62 |
781.47 |
850.15 |
|
1370.59 |
1456.16 |
767.77 |
845.704 |
|
1342.08 |
1409.41 |
752.21 |
821.949 |
|
1330.15 |
1405.24 |
600 |
676.396 |
|
1305.88 |
1385.82 |
561.11 |
630.1 |
|
1200.7 |
1273.69 |
544.44 |
605.196 |
|
1146.6 |
1212.83 |
446.42 |
519.635 |
Conclusion
Thus, the IR spectra of crystalline and liquid substances are well reproduced by the Globa-AlteQ algorithm; the same is true for the intermolecular interactions formed in the crystal and in the liquid phase using the MOPS-AlteQ algorithm. Therefore, the suggested algorithms can be successfully used to model the structure of molecules and the "reagent-substrate", "reagent-solvent", "reagent-catalyst" complexes in the studies of properties and reactivity of nitrogen-containing heterocyclic compounds. In addition, the proposed approaches can be used to further confirm the structure, which is especially important for liquid phases, liquid solutions and amorphous substances, where the direct determination of structures by X-ray diffraction analysis is impossible.
Acknowledgements
The work was supported by Act 211 Government of the Russian Federation, contract № 02. A03.21.0011. South Ural State University is grateful for financial support of the Ministry of Education and Science of the Russian Federation (grants No 4.7279.2017/BP, 4.8298.2017/BP).
References Capabilities of structure modeling for azaheterocycles and the comparison to FTIR spectroscopy data
- Барташевич Е.В., Гришина М.А., Потемкин В.А., Белик А.В. Метод мультиконформационного моделирования пространственной формы молекулы. Журн. структ. химии, 2002, Т. 43, № 6, С. 1120-1127 DOI: 10.1023/A:1023611131068
- Гришина М.А., Барташевич Е.В., Потемкин В.А., Белик А.В. Генетический алгоритм для прогноза строения и свойств молекулярных агломератов в органических веществах. Журн. структ. химии., 2002, Т. 43, № 6, С. 1128-1133 DOI: 10.1023/A:1023663115138
- Потемкин В.А., Арсламбеков Р.М., Барташевич Е.В., Гришина М.А., Белик А.В., Перспикаче С., Гуччионе С. Мультиконформационный метод анализа биологической активности молекулярных структур. Журн. структ. химии, 2002, Т. 43, № 6, С. 1134-1138 DOI: 10.1023/A:1023615231976
- Potemkin V.A., Grishina M.A. A New Paradigm for Pattern Recognition of Drugs. J. Comput. Aided Mol. Des, 2008, V. 22, pp. 489-505 DOI: 10.1007/s10822-008-9203-x
- Grishina M., Bolshakov O., Potemkin A., Potemkin V. Theoretical Investigation of Electron Structure and Surface Morphology of Titanium Dioxide Anatase Nano-particles. Comp. Theor. Chem, 2016, V. 1091, pp. 122-136 DOI: 10.1016/j.comptc.2016.07.003
- Chemosophia s.r.o. (2017). Доступен по адресу http:.www.chemosophia.com (16 сентября, 2017).
- Гришина М.А., Потемкин В.А., Переяславская Е.С, Барташевич Е.В, Русинов В.Л. Моделирование взаимодействия противовирусных препаратов с нейраминидазой гриппа А. Информационно-вычислительные технологии в решении фундаментальных и прикладных задач (Сессия ИВТН-2006). Сборник материалов, М., 2006, С. 13.
- Максаков В.А., Потемкин В.А., Кирин В.П. Теоретическое исследование конформационных состояний трехосмиевых кластеров с аминокислотными лигандами. Журн. структ. химии, 2003, Т. 44, № 5, С. 811-817 DOI: 10.1023/B:JORY.0000029809.88411.8b
- Потемкин В.А., Максаков В.А., Кирин В.П. Теоретическое исследование конформаций трехосмиевых кластеров с хиральным карановым лигандом. Журн. структ. химии, 2004, Т. 45, № 3, С. 430-434 DOI: 10.1007/s10947-005-0006-9
- Потемкин В.А., Максаков В.А., Коренев В.С. Теоретическое исследование конформационных состояний трехосмиевых кластеров с хиральным пинановым лигандом. Журн. структ. химии, 2005, Т. 46, № 1, С. 100-105 DOI: 10.1007/s10947-006-0007-3
- Aladko E.Ya., Ancharov A.I., Goryainov S.V., Kurnosov A.V., Larionov E.G., Likhacheva A.Yu., Manakov A.Yu., Potemkin V.A., Sheromov M.A., Teplykh A.E., Voronin V.I., Zhurko F.V. New Type of Phase Transformation in Gas Hydrate Forming System at High Pressures. Some Experimental and Computational Investigations of Clathrate Hydrates Formed in the SF6-H2O. J. Phys. Chem. B, 2006, vol. 110, no. 42, pp. 21371-21376 DOI: 10.1021/jp061698r
- Гришина М.А., Потемкин В.А., Матерн А.И. Теоретическое исследование реакций окисления акриданов. Журн. структ. химии, 2008, Т. 49, № 1, С. 13-18 DOI: 10.1007/s10947-008-0002-y
- Потемкин В.А., Максаков В.А., Коренев В.С. Теоретическое исследование конформационных состояний трехосмиевых кластеров с хиральным μ-1-NH пинановым лигандом. Журн. структ. химии, 2007, Т. 48, № 2, С. 230-235 DOI: 10.1134/S1070328407080088
- Максаков В.А., Первухина Н.В., Подберезская Н.В., Афонин М.Ю., Потемкин В.А., Кирин В.П. Рентгеноструктурный и конформационный анализ нового трехъядерного кластера осмия Os3(μ,h2-OCC6H5)(η3-C3H5)(CO)9. Журн. структ. химии, 2008, Т. 49, № 5, С. 926-932 DOI: 10.1007/s10947-008-0154-9
- Потемкин В.А., Ившина Н.Н., Максаков В.А. Теоретическое исследование конформационных особенностей трехосмиевых кластеров. Журн. структ. химии, 2009, Т. 50, Приложение, С. S150-S158 DOI: 10.1007/s10947-009-0202-0
- Manakov A.Yu., Likhacheva A.Yu., Potemkin V.A., Ogienko A.G., Kurnosov A.V., Ancharov A.I. Compressibility of Gas Hydrates. ChemPhysChem, 2011, Vol. 12, № 13, pp. 2476-2484 DOI: 10.1002/cphc.201100126
