CD-BGRU Net: Detection of Colon Cancer in Histopathology Images Using Bidirectional GRU with EfficientnetB0 Feature Extraction System

Author: Bhargavi Peddi Reddy, G.S. Veena, B. Nagarajan, Bhawana S. Dakhare, Vaibhav Eknath Pawar
Journal: International Journal of Image, Graphics and Signal Processing @ijigsp
Article in issue: 6 vol.16, 2024.
Free access
Colon cancer is a growth of cells that begins in a part of the large intestine called the colon. Colon cancer happens when cells in the colon develop changes in their DNA. Consequently, fewer infections and fatalities may result from early identification of this cancer. Histological analysis is used for a final diagnosis of colon cancer. Histopathology, or the microscopic examination of damaged tissue, is crucial for both cancer diagnosis and treatment. This work suggests a novel deep learning technique for colon cancer detection effectively. Histopathology images are collected from various type of sources. To enhance the quality of raw images, pre-processed techniques such as image scaling, colour map improved image sharpening, and image restoration are used. Resize the image's dimensions in image resizing to minimize the processing time. A colour map enhances the sharpness of an image by combining two techniques: The contrast adjustment technique is used to alter the image's contrast first. The resultant image is then enhanced by applying the image sharpening process and scaling it using a weighting fraction. As using the final image has increased quality, blur and undesirable noise are removed using image restoration. Next, the pre-data are used in the Attention U-Net segmentation procedure, which segments the region of the pre-data. To extract features from this segmented image to perform an accurate diagnosis, efficientnetB0 is used. In data extraction, the Bidirectional GRU model is used to process the data further in order to develop predictions. When processing input sequences in both directions with the BiGRU model, it is feasible to gather contextual information to increase accuracy and predict colon cancer effectively. In the proposed model colon disease prediction classifier offer 97% accuracy, 96% specificity and 95.49% F1_score. Thus, the proposed model effectively predicts colon cancer and improves accuracy.
Colon cancer, histopathology, ATT-Unet, efficientnetB0, BiGRU, image restoration
Short address: https://sciup.org/15019571
IDR: 15019571 | DOI: 10.5815/ijigsp.2024.06.08
Text of the scientific article CD-BGRU Net: Detection of Colon Cancer in Histopathology Images Using Bidirectional GRU with EfficientnetB0 Feature Extraction System
As stated by the World Health Organization (WHO), cancer is the leading cause of moral degradation worldwide [1]. Colon cancer typically initially presents as either the rectum (the end of the colon) or the vast entrails (the colon) [2]. Additionally, the term cancer describes a broad spectrum of diseases in which atypical cells arise due to random mutations within the human body. These cells begin to multiply uncontrollably upon creation and disperse throughout the organs. Cancer detection is now done in a labour-intensive and time-consuming manner. To recognize colon images, pathologists need to have in-depth understanding through the study of labelled histological images. Consequently, a large quantity of resources and labour are wasted. Consequently, better diagnostic speed and accuracy are required.
We stated by the World Health Organization (WHO), cancer is the leading cause of moral degradation worldwide [1]. Colon cancer typically initially presents as either the rectum (the end of the colon) or the vast entrails (the colon) [2]. Additionally, the term cancer describes a broad spectrum of diseases in which atypical cells arise due to random mutations within the human body. These cells begin to multiply uncontrollably upon creation and disperse throughout the organs. Cancer detection is now done in a labour-intensive and time-consuming manner. To recognize colon images, pathologists need to have in-depth understanding through the study of labelled histological images. Consequently, a large quantity of resources and labour are wasted. Consequently, better diagnostic speed and accuracy are required.
Recently, digital pathology has emerged as a critical diagnostic and prognostic tool for cancers [3]. The lack of resources has long prevented modernity from producing such a prediction, even though it is not an inevitable result of it. Therefore, current technological improvements have made it easier to employ digital pathology widely in a variety of applications. Unlike traditional glass slides, the creative Whole Slide Images (WSI) are numerical reproductions of stained specimen pieces [4]. Because they facilitate data sharing and storage, these images are also crucial to the pathological diagnosis process [5]. In actuality, pathologists can accurately diagnose tumors and cancer subtypes thanks to the analysis of WSI, allowing them a comprehensive understanding of the data content. Many techniques have been used recently to classify and segment WSI in these types of situations. The majority of these experiments concentrated on teaching shallow characteristics, such as texture and pattern recognition, as demonstrated by the examples of texture [6], grey level co-occurrence matrices [7] and local binary patterns [8].
Nonetheless, every tumor concurrently shows diverse patterns of texture, shape, and color. As such, the strategies listed above are inadequate for handling the difficulties [9]. In actuality, histopathology scans from today can contain billions of pixels and are incredibly huge. Usually, these slides depict advanced, intricate clinical aspects. Furthermore, they often only represent a small portion of the accessible annotated regions. In actuality, manually labelling each method takes a lot of time, effort, and dedication [10].
The development of automated image analysis techniques has been accelerated by the distinctive features of histopathology images. A scenario can lessen pathologists workload, integrate clinical applications, and reduce on handling and processing time. Artificial intelligence (AI) models have actually evolved from expert systems to traditional machine learning (ML) and then to deep learning (DL). Naturally, the development of powerful computing resources has diverted attention from deep learning models in a number of medical image processing applications. The investigation and development of deep learning models that will facilitate comprehensive interpretation and analysis currently constitute a significant portion of the digital pathology research domain. Colon cancer prediction methods include AlexNet, ResNet [11], VGG [12], and Inception [13]. These approaches have a few major drawbacks. These drawbacks typically involve lengthy processes, intrusive examination techniques (such as those used for histological diagnoses), analytical requirements, a strong necessity for highly specialized training, and erroneous outcomes. Thus, it is suggested that novel DL networks can automatically learn features from the data itself in a more precise and user-friendly way. The following was listed as the proposed model's primary contribution:
• A BiGRU approach based on ATT-Unet and efficientnetB0 feature extraction is used to detect colon cancer in histopathology images.
• Collected datasets are pre-processed by using image resize, colour map enhanced image sharpening and image restoration to improve image quality.
• In pre-processed images are segmented by using Attention Unet in order to enhance prediction performance, thus enhancing the model's sensitivity and accuracy to foreground pixels while minimizing computational overhead.
• Features are extracted from this segmented image using efficientnetB0 for accurate diagnosis. Global-average pool layer's features were taken out, and the output vector's dimension was taught distinct features at various levels in the data.
• In BiGRU classifier is used to further forecast the colon cancer disease by combining the extracted data.
2. Related Work
The following sections constitute the remainder of the manuscript: Section 2 indicates a fraction of the studies on colon cancer prediction. Section 3 presents a suggested approach for deep learning-based colon cancer prediction. The results and analysis of the suggested work are presented in Section 4, and the work's conclusion is defined in Section 5.
Colon cancer is one of the main causes of disease and death in humans. For effective analysis, colon tumors have to be accurately classified. Numerous approaches were developed to predict colon cancer prediction according to the technology development. A few methods recently developed for colon cancer diagnosis are reviewed as follows.
Davri et al. [14] presented and evaluated state-of-the-art DL models for patch and pixel level classification of a sparsely annotated colon histopathological dataset. This technique has made it possible to apply transfer learning to a specific histological image context from a generic multimedia dataset. In a pixel-wise tumour segmentation challenge using histopathology data, a from-scratch training has also been demonstrated. Additionally, the models were tested versus state-of-the-art techniques and assessed using various colorectal histopathology datasets. This approach works well, although it has poor accuracy as well as high computation costs.
Sakr et al. [15] introduces a lightweight deep learning method for accurate colon cancer diagnosis that is based on CNN. This system's effectiveness is evaluated using a database of histopathological images, and it is contrasted with other methods currently used in this area. This approach is reliable and effective as it facilitates the acquisition of an appropriate diagnosis, regardless of circumstances in which the pathologist who examined the colon images requests insurance. But, this method is not suitable for evaluating the performance of deep model using various datasets.
Tasnim et al. [16] invented the transfer learning MobileNetV2 model and the CNN method with max and average pooling layers, which are utilized to identify colon cancer. Colon cancer is detected using this method from the input images in less than a minute. Implementing this process as simple, rapid, and real-time as is possible is the study's aim. The training and testing dataset include both malignant and healthy cells. For huge data sets, this strategy is not appropriate.
Azar et al. [17] presented and investigated improved deep learning models for the automated system's segmentation and colon cancer detection. This study's performance measures and classification task aren't intended to be used to diagnose cancer with precision. Developing and testing deep learning models to accurately classify various types of aberrant lesions and tissues linked to colorectal cancer is anticipated to be the main focus of this endeavour. But, deciding which areas pathologists should focus on when diagnosing cancer is not suitable.
Radhakrishnan et al. [18] developed an image dataset for colon histology that was gathered to enable the early identification of colon cancer. Early diagnosis helps lower the death rate from illness. A median filter is applied following a color image's conversion to grayscale. Features are extracted from the image using KMean, FCM, and FFT methods. The data will be classified using a KNN classifier. The methods that can be applied to objectively assess histopathological images will be the main emphasis of this method. However, computation takes a long time.
Irawati et al. [19] presented a system of automatic colon cancer classification. Based on CNN, the system was developed using many architectures to achieve optimal performance, such as VGG16, VGG19, ResNet101, ResNet152, MobileNetV2, DenseNet201, and InceptionV3. Using the VGG19, ResNet101, and ResNet152 architectures, this model performance is attained. Screening of large populations is another application for this technique. However, this technique is not sufficient to determine the cancer severity of a larger and more varied source dataset.
Al-Rajab et al. [20] developed a method uses a two-stage, multifilter feature selection model to improve the diagnosis of colon cancer. The presented model handles feature selection by combining a genetic algorithm with information gain. This method's main contributions were improved gene categorization and diagnosis accuracy. This was accomplished by reducing the total number of features that were taken into consideration during the analysis. However, the system's classification performance has to be improved.
Vafapour et al. [21] describes a device for the terahertz electromagnetic detection of colon cancer, which uses surface plasmon polaritons to distinguish between different water contents in healthy and malignant colon tissue. This device's spectral response changes as a result, revealing the presence of malignant tissue in our sample. This method of detecting colon cancer allows for the disease less invasive as well as easier to recognize, which is crucial for lowering the disease's deadly fatality rate. However, this approach of designing is difficult.
Su et al. [22] employs gene expression profiling data from The Cancer Genome Atlas (TCGA) to diagnose and stage colon cancer. This study initially selected the gene modules with the highest association to cancer using Weighted Gene Co-expression Network Analysis (WGCNA), which allowed cancer to be diagnosed at each stage. It then performed a survival analysis, used the least absolute shrinkage and selection operator technique (Lasso) to extract the characteristic genes for differential expression data, and integrated the feature genes generated by Lasso with the genes in the modules. However, system design is difficult.
Fahami et al. [23] utilized machine learning techniques to identify this cancer's tumor features. Determining the harmful genes is a critical step in the identification of colon cancer. To do this, a number of machine learning techniques have been applied to data on colon cancer. Using both supervised and unsupervised machine learning techniques, this study identified the genes that are best for the vital status of patients with colon cancer. Following the patients division into two primary groups, each group's top 20 important status genes were determined. Additionally, several deep learning techniques can be used on data related to colon cancer.
The above literature have numerous techniques and algorithms were introduced to predict colon cancer. The outcome of these methods provide well performance but they have some limitation that reduces the accuracy of the system. The impacts that are having in the training is needed and inaccurate disease prediction [14, 20] high computation costs and complex to implement [21, 22] for huge data sets, this strategy is not appropriate [15], [16, 19] it is not appropriate to choose the best regions and long time to process [18, 23]. A novel approach that employs an effective deep learning classifier based model to predict an accurate result is provided to overcome these drawbacks. A clear explanation of the proposed colon cancer prediction process is provided in the upcoming section.
3. Proposed Methodology
One of the diseases with a high death rate that can claim a person's life is colon cancer. In the meantime, because the colon is close to the liver and spleen, issues from liver and spleen metastases are more common when colon cancer develops. For this reason, the patient values an exact, impartial, and real-time examination result significantly. The method of diagnosis that is most frequently utilized is histopathological inspection. The best treatment stage may be missing as histological diagnosis necessitates a lengthy inspection duration and a high level of professional knowledge. Additionally, physicians subjective perceptions play a role in the decision-making process. The goal of this work is to use deep learning to detect colon cancer in pathological images, which will significantly reduce the workload for clinicians and reduce the inspection duration. The architecture of the proposed colon cancer prediction model is shown in Fig 1.
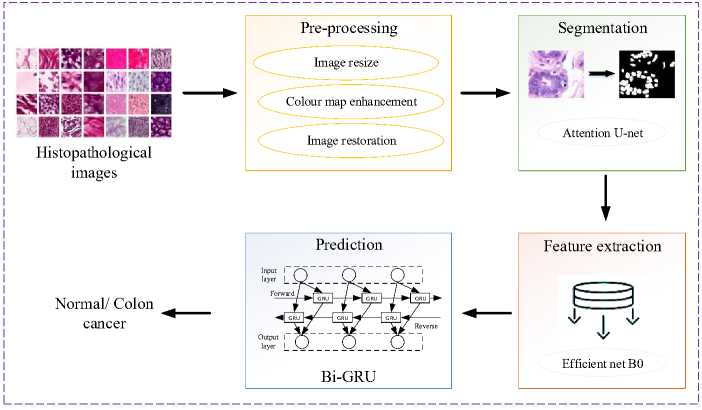
Fig. 1. Process flow of the proposed model.
In the first step, gather the colon histopathological image from the standard clinic which was need to be preprocessed because the image contain noise and poor quality that are not suitable for the prediction process. Pre-processed techniques are included in Image resizing, colour map enhanced image sharpening and image restoration to improve the quality of raw images. In image resizing, resize the image dimensions, which aids to reduce the processing time consumption. A color map enhances the sharpness of an image by combining two techniques: The contrast adjustment technique is used to change the image's contrast first. Then, the image sharpening technique is applied, scaled by a weighting fraction, and added to the final image. Using the final image has improved quality thus image restoration is used to remove blur, unwanted noise. After that, the pre-data are applied to the segmentation process using ATT-UNet segmentation which segment the pre-data's region that was most useful for colon cancer histopathological image segmentation. In this segmented image, efficientnetB0 is used to extract features for effective diagnosis. The extracted data are then further processed for the prediction process by using the BiGRU model. The BiGRU model includes contextual information to increase accuracy by processing input sequences in both directions. The mathematical discussion of the proposed model was done as follows.
-
3.1 Pre-processing
-
3.2 Image resizing
-
3.3 Colour map enhanced image sharpening
Collected histopathology images are required pre-processing since it enhances the quality of the raw data. Preprocessing uses image resizing, text, noise removal and contrast enhancement in order to identify the image aspect. In the proposed model, various pre-processing approaches are utilized for improving image information, such as image resizing, colour map enhanced image sharpening and image restoration. A clear discussion of the proposed model was discussed as follows.
Initial step is to resize and crop the image into a dimension of 256×256 pixels to reduce the processing time. Eqn. (1) represents the calculated term used for image resizing is,
P (a,b ) = s^ 02 j= о Хца1 b 1 (1)
Where b signifies height in pixel, a represents width in pixel, and Xtj denotes the squared area in the image. To enhance the image quality, pre-processing is performed on the resized images.
This method efficiently combines two methods: first, the contrast of the image is modified using the contrast adjustment technique; second, the outcome of the sharpening process is applied to the image, reduced by a weighted fraction, and then added to the end result. The color balance is oriented toward the crisper material that remains in the original image and the brightness value range is adjusted to produce a better image. The process is defined mathematically as,
E (m, n) = [0(m , n) + a{0 (m, n) - 0 (m, n)}] (2)
Where E (m, n) is the final enhanced image, a is the weighting fraction, К is the scaling constant, and 0 (m ,n) is the original image and 6 (m, n) that has been blurred or smoothed.
-
3.4 Image restoration
-
3.5 Segmentation
-
3.6 ATT-UNET
Utilizing a number of methods, the patient's spatial information, including spin density and relaxation parameters, can be encoded into the measured histopathological images. The observed data related to the spatial information is usually subjected to mathematical analysis in a forward imaging model. The most often used linear imaging model, which may be stated as follows:
f = Am + £ (3)
Where, under the premise that noise affects each frequency equally, A: CN ^ C M is the encoding matrix, f eC M is the acquired k-space data, meCN is the image to be reconstructed, and e is the noise measurement. At the time of data acquisition, the imaging model stored in the encoding matrix A and the measured data f are both known. Recovering the desired image m from measurements f is the difficult task of recovering an image. In this way the images were enhanced by removing blur, noise, and text, then these images are given to the supervised ATT-UNet segmentation process.
Image segmentation is the process of splitting up a digital image into various pixel subgroups. Here, an ATT-UNet segmentation is utilized to segment the disease portion in the histopathological image.
The advantage of UNET [24] is that it combines high semantic reused features with high resolution characteristics. Because the expanding and contracting paths are symmetric, accurate learning of the image's location as well as its content is ensured. An encoder, a bottleneck, and a decoder are the three main components of Unet. Convolutional layers are stacked classically in the CNN models, which is the Encoder. It ensures the mapping of the inputs into a feature vector so as to understand the context present in the original images. By decreasing the spatial dimensions and increasing the number of channels in each layer, the convolutional layers eventually learn the salient features. Each block is made up of two convolutional layers with three by three filters and one by one stride layered together. The Gradient Reduction of Feature Map Size is achieved by applying ReLU activation functions to each convolutional layer along with batch normalization and max-pooling. The decoding units and the down sampling block are connected through the bottleneck. Two convolutional blocks make up its single component. Batch Normalization and ReLu Activation are applied to each Conv2d layer. The primary goal of bottleneck technology layers is to reduce the input to a limited file that only has information that is necessary for reconstruction. The energy of a unit is given in eqn. (4):
E = Zw(x) log(PkM (x)) (4)
Where Pk seems to be a softmax function applied pixel-by-pixel to the final feature map, defined as in eqn. (5):
Pk = exp(ak(xy)/s k- - i exp( а к(хУ) (5)
Here, ak denotes the activation in channelfc. In order to move the output from the encoder to the decoder, the U-Net architecture also includes a skip link. These feature maps are integrated with the results of the up sampling method, and the resulting feature map is passed to succeeding layers. The network can regain the lost spatial information pooling processes have lost by employing the skip connection. Although this method is effective, it is not suitable for large datasets and may lead to overfitting of the model. U U-Net model is developed to overcome these drawbacks in enhanced attention. It is proposed to use spatial attention gates to connect all of the disconnects in the UNET model. The encoder, decoder, and bottleneck included in the UNET architecture are all included in the suggested ATT-UNET model. The binary mask output is mapped by a final 1D-convolutional layer after four convolutional blocks constitute the encoding and decoding paths. Each convolutional block has two convolutional layers, which are followed by the appropriate ReLU for activation non-linearity and Batch Normalization. Fig 2 demonstrates the overall attention U-net model.
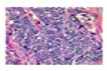
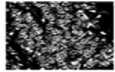
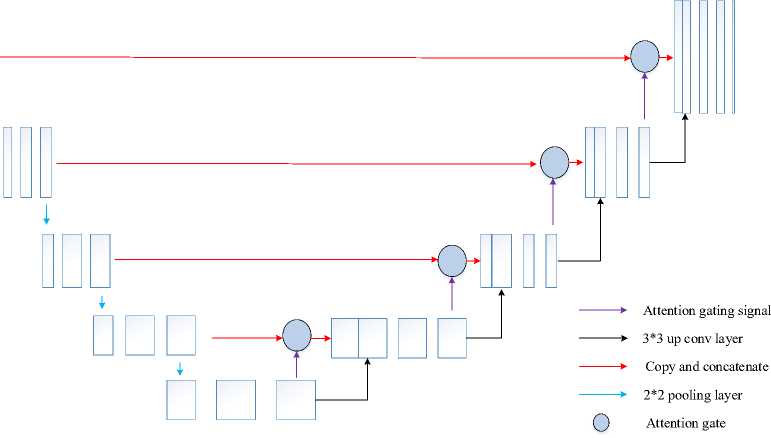
Fig. 2. Structure of Attention U-net.
Attention gates provide a selective feature learning method such that spatial data from the Encoder path and the Decoder path are not only concatenated. Actually, attention gates serve the purpose of effectively weighting the various visual regions, providing the most weight to the areas that are most pertinent. These modules are trainable, so each patch of the image obtains a consistent weight distribution and increased focus on the important regions. Provide each of the two main inputs listed below for each spatial gate: 1) The vector signal X , which is the encoder vector from the same hierarchical level; and 2) The gating signal 9 , which is the output of the previous low-level layer. To put it briefly, x provides the spatial information because it comes from the encoding path, while 9 represents the high-level features because it comes from deeper in the network. After the two elements are equal in size, are added together element by element. Next, inharmonious weights are penalized and aligned weights are highlighted. A 1 × 1 convolutional layer and a ReLU activation get the summed vector. The vector is scaled into a [0, 1] range by adding a sigmoid layer. The attention weights are stored in the output 1D vector; weights nearer 1 indicate more pertinent features. The signal x is then subjected to this attention vector, resulting in a weighted feature map that is passed into the ATT-UNET convolutional block. Finally segmented image further include in feature extraction.
-
3.7 Feature extraction
-
3.8 Bidirectional Gated Recurrent Units (BiGRU)
Extraction of features is crucial for colon illness classification. Effective feature extraction from histopathological images enhances the precision of diagnosis and assists in the categorization of cancer. Typical image processing methods for identifying characteristics are costly and inaccurate. Utilize the EfficientNetB0 deep learning algorithm to extract features from histopathology images because their characteristics are complex. The EfficientNetB0 basic network is developed by a multi-objective neural architecture search and then scaled vertically, horizontally, and at a balance between these dimensions. An MBConv, or portable inverted bottleneck convolutional module, is at the core of the network. Here's how the compound scaling approach is defined:
Dерth: d= ∅
Width: w= ∅
Rеsolution: r= ∅ a․ P2 ․ У2≈2
a≥1,$≥1,у≥1
Where a, P and у can be determined using a small grid search. The feature extraction for a colon cancer classification is obtained by using the state of the art for EfficientNetB0. Using the BiGRU classifier, the extracted feature is further used to predict colon cancer.
In sequential data processing, recurrent neural networks and other deep learning models are increasing popularity recently. Compared to an RNN, a normal feed-forward neural network does not have the recurrent hidden stateh l. The state at time t — 1 determines whether or not this state is activated at a given time t. The following fig 3 clearly illustrates the architecture of the BiGRU classifier.
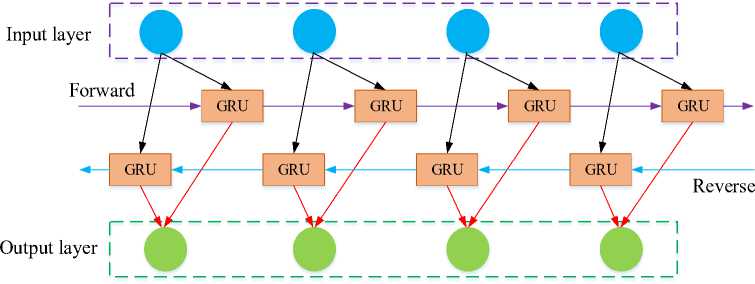
Fig. 3. Architecture of BiGRU classifier.
The following equation illustrates this:
h l = g(W- X[ + U.hl 1 + b )
Where is the activation function, is the input vector, is the bias term, and and are the weight matrices. Networks are effective at modelling sequential data, but RNNs are known to suffer from the vanishing gradient problem, which makes it difficult for them to capture long-term dependencies. To tackle this problem, element-wise non-linearities are frequently employed, which employ the Gated Recurrent Unit (GRU) and the Long-Short Term Memory (LSTM) as recurrent units. Both variants have the potential to improve performance, although GRU-based models are more computationally affordable than LSTMs due to their smaller gate count and fewer parameters that need to be learned.
Consider using Bidirectional GRU (BiGRU) layers to further improve learning. A BiGRU combines two separate GRUs in a bidirectional method as it evaluates the input sequence forward. Or the same arrangement proceeding in the opposite direction. Concatenation of the hidden states from each GRU appears as follows:
(h)f = GUU ftf , hl - г), V t e [1, Ti](12)
(hl)b = UUU ^h--г)лte [Ti,1]
hl = [(hl)p (hl)b]
Where f and b denotes forward and backward, respectively. Next, examine a sequence in both ways to discover patterns that a unidirectional model can ignore.
Two BiGRU layers come after the previously described convolutional layers. To further reduce overfitting, two types of dropouts a conventional dropout and a recurrent dropout with a dropout rate of 0.1 separate the two BiGRU layers. Before the final BiGRU output reaches an output neuron, a sigmoid activation is added to it in order to foresee the disease.
Pseudocode for proposed colon cancer prediction
Histopathology image dataset = B
Begin
{
For all colon images in dataset
-
# Pre-processing
R= Resizing (B) //change dimension of data using eqn. (1)
N= Colourmap enhance (R) // noise removal of data using eqn. (2)
E= IR (N) //convert high resolution image using eqn. (3)
# Segmentation
S=Att Unet (E)
# Feature extraction
A= Efficient B0 (S)
# Classification
Data splitting
{
Training data
Testing data
Actual class
}
O= BiGRU (A)
}
End
Outcome: Predict colon cancer
//segment the pre-data using eqn. (4) and (5)
// extract features using eqn. (6)- (10)
// detect the colon cancer
4. Result and Discussion4.1 Dataset description
The dataset was gathered from the Kaggle website [25]. There are 25,000 histopathological pictures in 5 classes in this collection. Each image is saved in the jpeg file format and has a resolution of 768*768 pixels. The initial sample of HIPAA compliant and validated sources provided 500 total images of colon tissue (250 colon adenocarcinomas and 250 benign colon tissue) and 750 total images of lung tissue (250 lung squamous cell carcinomas, 250 lung adenocarcinomas, and 250 benign lung tissue). These images were then increased to 25,000 using the Augmentor package. There are five classes in the dataset: colon benign tissue, lung squamous cell cancer, lung adenocarcinoma, and lung benign tissue. Each class has 5000 images.
A novel deep learning method for colon cancer diagnosis is performed out by using the BiGRU classifier which is simulated using python with Windows 11 PC with Intel Core i7-11800H CPU, 8GB Nvidia GeForce RTX 3070 GPU and 64GB RAM. The collected histopathology images are not suitable for disease diagnosis due to noise content and poor image quality. Resize, colour map enhanced image sharpening and image restoration are utilized for pre-processing, then the pre-data are further moved to the segmentation process. Attention UNet segmentation is utilized to segment the effective region of the colon and these images were utilized for the feature extraction process. In this segmented image features are extracted by using efficient B0 and then the extracted data are then further processed for the prediction process by using the BiGRU model to improve accuracy. Table 1 illustrates the simulation parameter considered for analysis.
Table 1. Simulation Parameter of Bi-GRU model
|
Parameter |
Range |
|
Optimizer |
Adam |
|
Loss function |
Cross entropy |
|
Activation function |
Tanh |
|
Drouput |
0.5 |
|
Learning rate |
0.005 |
|
Number of layer |
3 |
|
Maximum epoch |
500 |
|
Batch size |
100 |
These gathered images are provided to the segmentation process, which improves their quality and segments the data into an accurate region after pre-processing to increase quality. Fig 4 demonstrates the outcome of the preprocessing process.
|
Input samples |
Resized image |
Colour map enhanced |
Image restoration |
|
ЙЖ "К |
|||
|
ЯяЙЙР^ Wfel’w |
-М' ’ ■ |
|
-^о |
|||
|
/ |
|||
|
ужи |
К |
||
|
ни |
ййй |
||
|
га |
l '7W £ . -* ж. |
||
|
nSS'diS* |
КИ i.... |
ы Жа.^ |
Я |
|
ГУ |
|||
|
Йм^ЮТй |
|||
|
и |
|||
|
Шг |
SS® |
Fig. 4. Samples of pre-processing outcome.
The pre-processing of the proposed model is taken as resizing, colour map enhanced image sharpening and image restoration. These pre-data are segmented by using attention Unet to detect the region of the data for enhance prediction performance. Fig. 5 demonstrates the segmentation output of pre-data.
|
Predate |
Attention Unet segmentation |
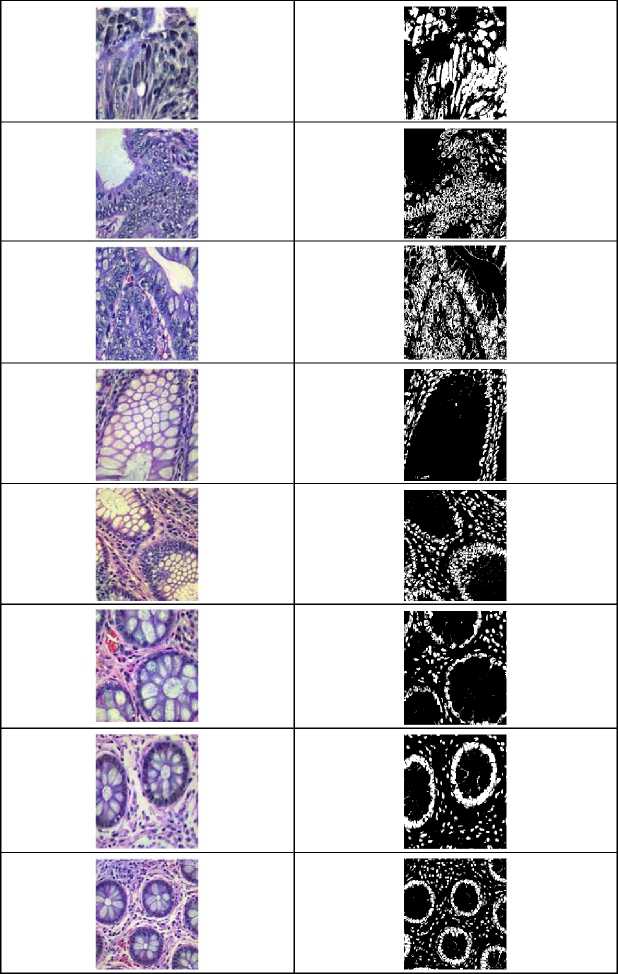
Fig. 5. Samples of attention UNet segmentation outcome.
Attention-Unet provides an effective segmentation process which segments the disease region from the pre-data. For validation, performance metrics of the segmented images and pre-processed images are compared with some other models. The Autoencoder denoising (AED), Bounding Box Labeling (BBL) and Data Partitioning (DP) are contrasted with the Image Restoration (IR) images. The following figure presents a comparison of pre-data indicators.
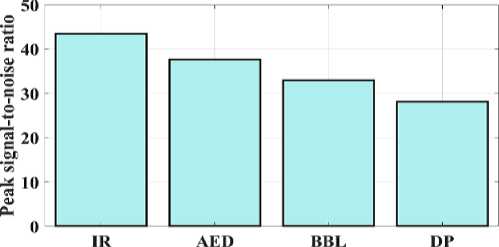
Technique
Fig. 6. Peak signal-to-noise ratio for a proposed and existing model.
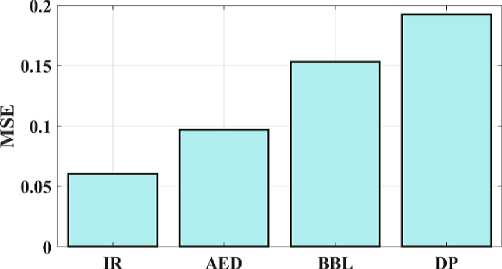
Technique
Fig. 7. Mean square error for a proposed and existing model.
The proposed IR model's peak signal-to-noise ratio (PSNR) can be compared to test the approaches presented in Fig 6. The PSNR measures the relationship between a signal's maximum attainable durability and the maximum quantity of distorted noise that may harm the signal's representational accuracy. The suggested IR model provides 43.4 PSNR, AED provides 37.6 PSNR, BBL provides 32.9 PSNR, and DP provides 28.1 PSNR. As a result, fig 6 illustrates how the suggested model provides a higher PSNR value than the conventional techniques. The approach depicted in Figure 7 is validated by examining the MSE and contrasting the observed values with the convolution model. The proposed IR model's mean square error (MSE) is 0.0605; for the AED, 0.0968; the BW-Net, 0.1532; and for the SRGAN, 0.1924. Therefore, shows that the suggested model has a lower error value than the traditional approaches.
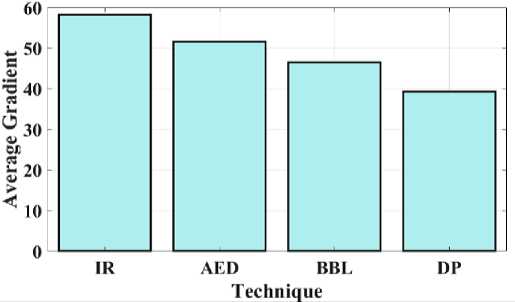
Fig. 8. Average gradient for a proposed and existing model.
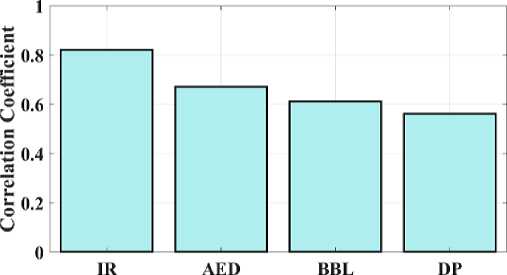
Technique
Fig. 9. Correlation coefficient for proposed and existing model.
Fig 8 compares the proposed IR average gradient to the current approaches. The relationship between the image's clarity and the pattern's minutely varied variation is developed by the average gradient. The proposed IR model provides a gradient of 58.2, while AED, BBL, and DP provide 51.6, 46.5, and 39.3 respectively. Fig 8 shows that the suggested model has high gradient values when compared to other methods. Fig 9 depicts the study of the image's correlation. A filter mask, sometimes referred to as a kernel, is moved over the image during correlation, and the total of the outcomes is determined at each location. The proposed IR model offers a 0.82 correlation, whereas AED, BBL and DP provides 0.67, 0.61, and 0.56, respectively. It demonstrates that compared to other models, the suggested model has a higher correlation coefficient value.
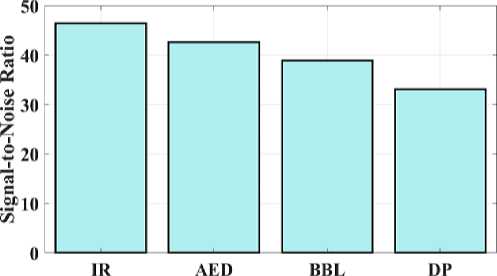
Technique
Fig. 10. Signal-to-noise ratio for a proposed and existing model.
The proposed IR model's signal-to-noise ratio (SNR) is compared, which allows for testing of the methods illustrated in Fig 10. Images with high SNR are obtained by large pixels that can pick up more signal. AED has 42.6 SNR, BBL has 38.9 SNR, DP has 33.1, and the proposed IR model has 46.4 SNR. This shows that the suggested model offers a higher SNR value than other models. This comparison shows that the suggested IR model outperforms conventional models in terms of results.
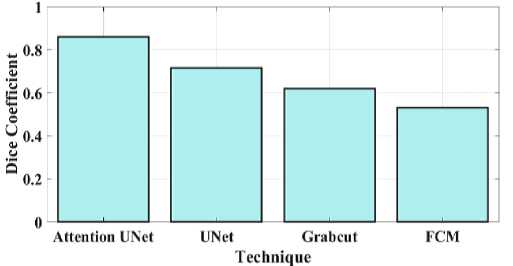
Fig. 11. Dice coefficient for a proposed and existing model.
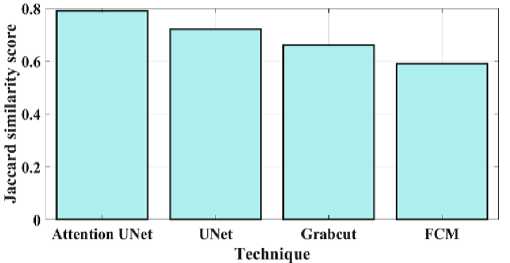
Fig. 12. Jaccard similarity for a proposed and existing model.
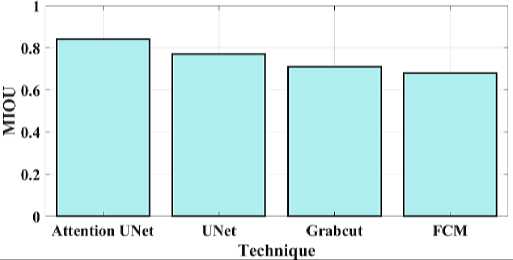
Fig. 13. MIOU for proposed and existing model.
Fig 11 compares the proposed attention Unet segmentation dice coefficient with the current approaches. A statistical method for determining how similar two sets of data are is the Dice similarity coefficient, sometimes referred to as the simple Dice coefficient. The proposed attention UNet model provides 0.86 DC, UNet have 0.715 DC, Grabcut have 0.62 and the FCM model have 0.53 DC. Consequently, it can be shown that the suggested model has a higher DC than the traditional approaches. Fig 12 compares the proposed attention Unet segmentation Jaccard similarity with the current approaches. A function of the method known as Jaccard similarity (JS) is to compare and determine how similar the two images are. The intersection size of the set of samples divided by their union size is how Jaccard similarity is calculated. The proposed attention UNet model provides 0.79 JS, UNet have 0.72 JS, Grabcut have 0.66 JS and the FCM model have 0.59 JS. Fig 13 compares the proposed attention Unet segmentation Mean Intersection over Union (MIOU) with the current approaches. The calculation of a predicted mask or bounding box's degree of match with the ground truth data is known as AMIOU. The proposed attention UNet model provides 0.84 MIOU, UNet have 0.77 MIOU, Grabcut have 0.71 MIOU and FCM model have 0.68MIOU.
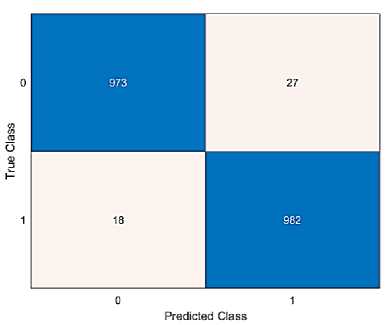
Fig. 14. Confusion matrix of the proposed method.
Fig 14 illustrates the proposed model's confusion matrix. Confusion matrix is used to verify the classification technique's accuracy. Two distinct groups (Normal and colon) based on the prediction of colon disease are taken into consideration in order to assess the efficacy of the suggested strategy. The correct prediction values of class 0 is 973 and class 1 is 982, respectively. Additionally, the positive and negative rates are used to measure the accuracy, sensitivity, specificity, and null error rates. The performance metrics are compared to existing approaches like LSTM, DNN and Resnet 18 models.
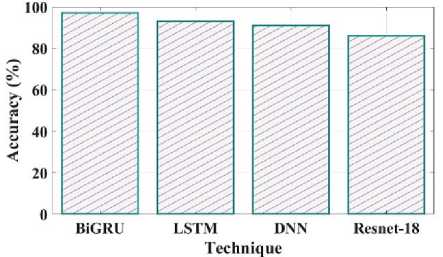
Fig. 15. Accuracy comparison of proposed and existing methods.
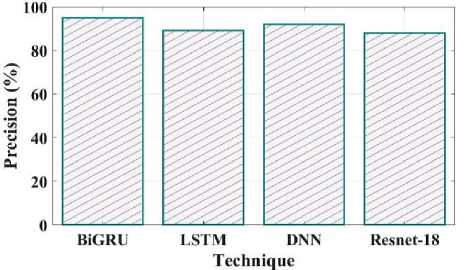
Fig. 16. Precision comparison of proposed and existing methods.
Fig 15 illustrates the accuracy of the proposed and current methods. The system that predicts a value with the least degree of error is said to be accurate. The proposed method has a 97% accuracy, compared to LSTM have 93%, DNN have 91% and Resnet 18 have 86%. Compared to existing methods proposed model is more efficient. Fig 16 shows the precision comparison between the existing and suggested methods. The precision value of the proposed method was discovered to be 95%, which is higher than the quantity of anticipated favourable events is what is meant by accurate measurement. The current approaches like LSTM, DNN, and Resnet 18 with corresponding precision values of 89%, 92%, and 88%.
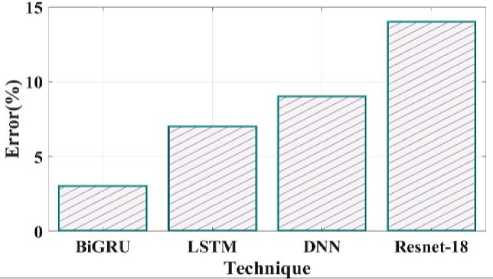
Fig. 17. Error comparison of proposed and existing methods.
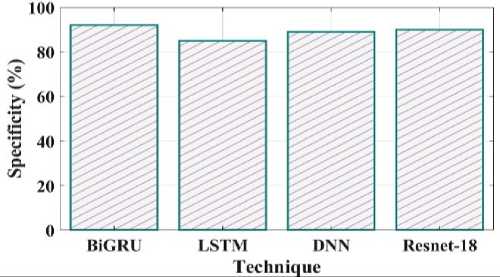
Fig. 18. Specificity comparison of proposed and existing methods.
Fig 17 depicts an error comparison using various proposed and existing methodologies. The error percentages observed by prior techniques like LSTM, DNN and Resnet 18 are 7%, 9% and 14%. The 3% % error value obtained for the proposed BiGRU approach. Fig 18 compares the specificity of the suggested and current methods. The degree to which a model can predict the real negatives of every imaginable sort is known as specificity. The suggested method's specificity value was discovered to be 92% when compared to a few of the other current approaches, including LSTM, DNN and Resnet 18 which had equivalent specificity values of 85%, 89%, and 90%.
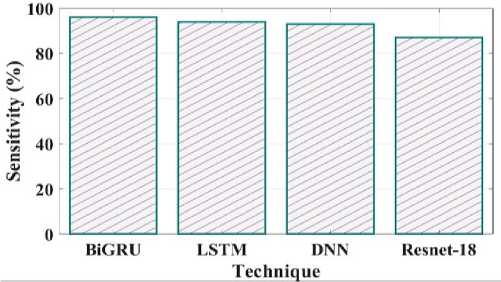
Fig. 19. Sensitivity comparison of proposed and existing methods.
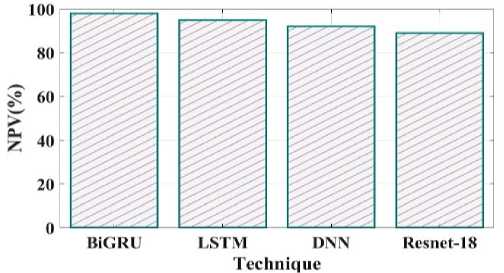
Fig. 20. NPV comparison of proposed and existing methods.
Comparing the sensitivity of suggested and existing approaches is shown in Fig 19. The proposed method's sensitivity is 96%, LSTM is 94%, DNN is 93% and Resnet 18 is 87%. Negative predictive value concentrates on subjects with a negative test result, as shown in Fig 20. The proposed method NPV is 98% existing method LSTM is 95%, DNN is 92%, and Resnet18 is 89%.
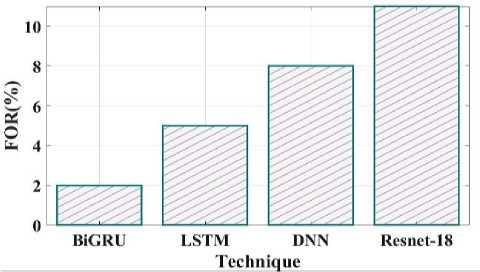
Fig. 21. FOR comparison of proposed and existing methods.
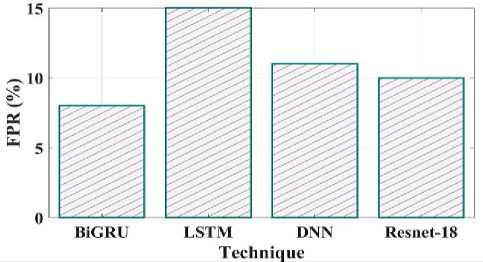
Fig. 22. FPR comparison of proposed and existing methods.
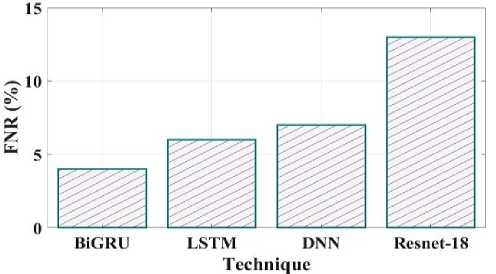
Fig. 23. FNR comparison of proposed and existing methods.
Fig 21 clearly shows the false omission rate of the proposed and existing comparison. The comparison shows the BiGRU have 2 FOR, LSTM have 5 FOR, DNN have 8 FOR and Resnet18 have 11 FOR. The false positive rate contrast of the recommended and current techniques is shown in Fig 22. The proposed method have false positive rate is 8%, the existing LSTM have 15%, DNN have 11% and Resnet18 have 10%.
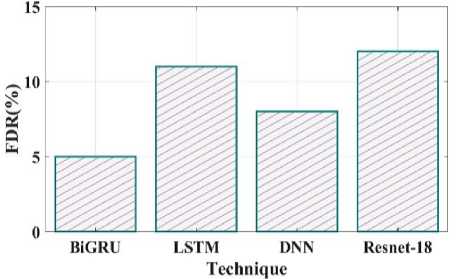
Fig. 24. FDR comparison of proposed and existing methods.
The false negative rate contrast of the recommended and existing techniques is shown in Fig 23. The proposed method have false negative rate is 4%, the existing LSTM have 6%, DNN have 7% and Resnet18 have 13%. Fig 24 clearly shows the false discovery rate of the proposed and existing comparison. The comparison shows the BiGRU have 5 FDR, LSTM have 11 FDR, DNN have 8 FDR and Resnet18 have 12 FDR.
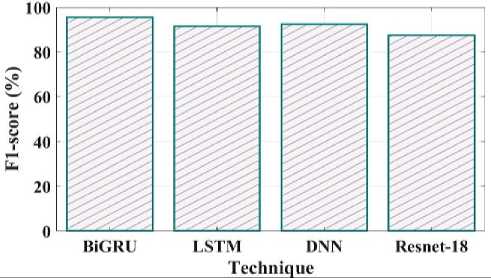
Fig. 25. F1_Score comparison of proposed and existing methods.
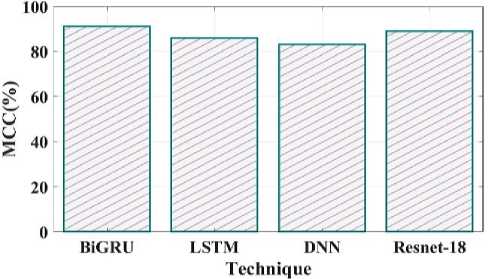
Fig. 26. MCC comparison of proposed and existing methods.
The comparison of the proposed and existing F1 score is shown in Fig 25. The F1 Score value for the proposed technique is 95%, LSTM is 91%, DNN is 92% and Resnet18 is 87%. MCC in the suggested method has a value of 91%, LSTM have 86%, DNN have 83% and Resnet 18 have 89% shown in Fig 26.
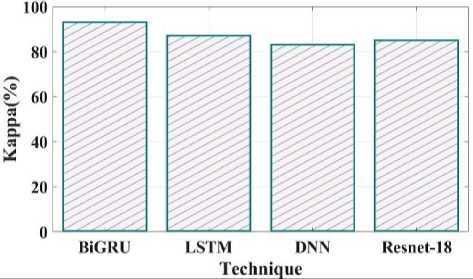
Fig. 27. Kappa comparison of proposed and existing methods.
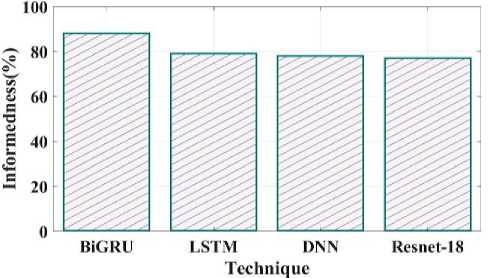
Fig. 28. Informedness comparison of proposed and existing methods.
Fig 27 shows the kappa comparison between the proposed and current methods. The kappa values for the suggested technique are 93%, LSTM is 87%, DNN is 83%, and Resnet 18 is 85%. Fig 28 compares the informedness of the proposed method with the current one. As a secondary metric for the probability that a prediction is marked compared to chance, informedness is introduced. The informedness values of the suggested technique are 88%, LSTM 79%, DNN 78%, and Resnet 18 77%.
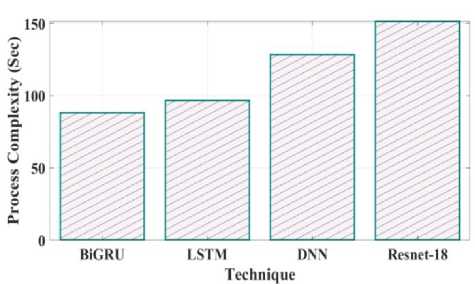
Fig. 29. Process Complexity for proposed and existing model.
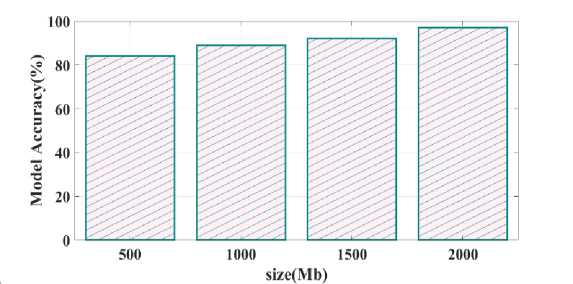
Fig. 30. Model accuracy varying memory size
Training time validated for proposed as well as existing model is provided in Fig.28. Training time reached for proposed Bi-GRU model is 80 sec whereas other existing model such as LSTM, DNN and Resnet-18 is 90 sec, 125 sec and 148 sec. Process complexity analysed for different technique is given in Fig.29. Bi-GRU attain process complexity of 85 sec, LSTM has 98 sec, DNN has 125 sec and Resnet-18 has 150 sec. This process complexity analysis showed that model complexity is minimal and computational efficiency is better using proposed Bi-GRU when compared to other existing models. Fig.30 illustrates the calculation of model accuracy through varying memory size. 97% rate of accuracy is achieved when the memory size is 2000 Mb and for other memory size such as 500 Mb, 1000 Mb and 1500 Mb the model accuracy is found to be 85%, 87% and 90%.
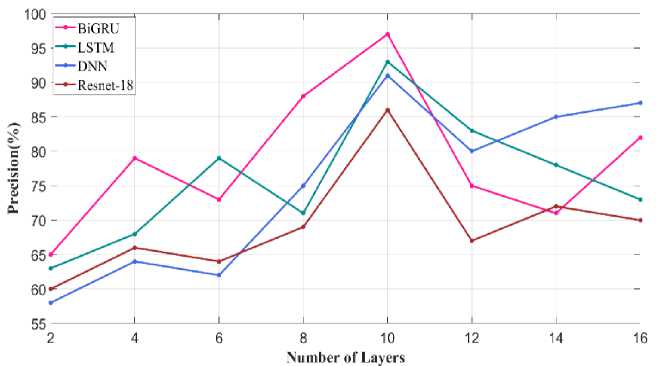
Fig. 31. Precision metric varying number of layers
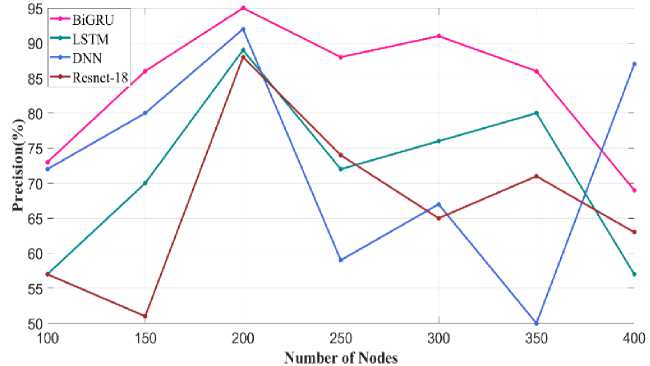
Fig. 32. Precision metric varying number of nodes
Fig. 31 illustrates the precision metric obtained through varying the number of layers in Bi-GRU model. When the number of layer is 10 precision value attained using proposed Bi-GRU model is 97% and other existing model such as LSTM, DNN and Resnet-18 has precision value of 93%, 90% and 86%. For similar number of layer. This analysis showed that through fixing the number of layers in the classifier as 10 better performance is achieved. Similar precision metric validated through varying the number of node is given in Fig.32. Higher precision of about 95% is achieved using proposed Bi-GRU model when the number of nodes is 200. Also, other existing approaches such as LSTM, DNN and Resnet-18 attains precision value of 90%, 88% and 86%.
The droupout rate is varied and the recall metric is calculated for proposed as well as existing approaches given in Fig.33. Optimal dropout rate is 0.4 using which the proposed Bi-GRU as well as other existing models such as LSTM, DNN and Resnet-18 attains recall value of 96% and 93%, 92% and 88%. Whereas in other remaining dropout rate the proposed and existing models perform low.
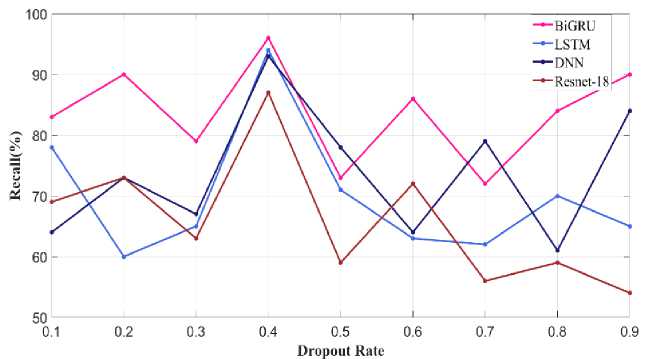
Fig. 33. Recall metric varying Dropout Rate
-
4.2 Evaluation metrics comparison
Table 2 presents the proposed model metrics, including accuracy, precision, recall, and f1_score, in comparison with some other current approaches.
Table 2. Comparison of proposed and existing state-of-the-art methods for colon cancer prediction
|
Metrics |
Accuracy |
Precision |
F1_score |
Sensitivity |
|
Proposed |
97% |
95% |
95.49% |
96 % |
|
Ensemble [26] |
84.1% |
84.1% |
84.1% |
87.1% |
|
CoC-ResNet [27] |
94% |
94% |
94% |
95% |
|
CNN-GOA [28] |
99.12% |
98.91% |
98.94% |
99.34% |
The above table 2 clearly shows that the proposed model effectively works in comparison to existing ones such as Resnet50, Naïve Bayes classifier and CNN-GOA. The accuracy of the current method's ensemble, CoC-ResNet classifier and CNN-GOA is considered to be 84. 1%, 94%, and 99.12%, respectively. Thus the proposed model provides an effective disease prediction outcome than the traditional approaches. Also, the comparison between the proposed and existing colon cancer prediction models using a similar dataset is given in Table 3.
Table 3. Comparison between proposed and existing model using a similar dataset
|
Metrics |
Dataset |
Accuracy |
Precision |
F1_score |
Sensitivity |
|
Proposed |
Kaggle |
97% |
95% |
95.49% |
96 % |
|
RF-DenseNet-121 [29] |
Kaggle |
98.6% |
98.6% |
98.5% |
98.6% |
|
MA_ColonNET [30] |
Kaggle |
94.5% |
93% |
93% |
94% |
|
CRCCN-Net [31] |
Kaggle |
93.5% |
94.12% |
93.86% |
93.62% |
A comparison between the proposed and existing state-of-the-art method which is validated using a similar dataset is provided in table 3. Through validating different techniques using the benchmark Kaggle dataset the performance varies gradually. Overall analysis showed that the proposed model performs better by achieving a high rate of accuracy, precision and sensitivity. Using this proposed model colon cancer can be predicted more accurately with a lesser rate of error using histopathological images.
5. Conclusion
In proposed model concentrates on designing a deep learning model with an effective feature extraction process based on colon cancer disease prediction. The second leading cause of mortality for men and third for women globally respectively, is colon cancer. Due to the elevated death rate and expenses incurred by patients and their families. Early cancer diagnosis and identification can significantly improve patient survival and save treatment costs. The major goal is to develop a system that uses preprocessing techniques and a deep network model (BiGRU) to identify colon adenocarcinomas in histopathology images is proposed. Inspection of the histology is the most widely utilized diagnostic technique. Collect the colon histopathology image from a typical clinic in the first phase. This image needed to be preprocessed because it contained noise and extraneous factors that made it inappropriate for the prediction method. To enhance the quality of raw images, pre-processed techniques are used for image resizing, color map improved image sharpening and image restoration. Resize the image's dimensions during image resizing to decrease the processing time. In a colour map enhanced image sharpening technique, two techniques are essentially combined. The contrast adjustment technique is used to alter the image's contrast first. The resultant image is then enhanced by applying the image sharpening procedure and scaling it using a weighting fraction. Image restoration is used to reduce blur and undesired noise as using the final image has better quality. The pre-data are then applied to the ATT-UNet segmentation technique, which segments the pre-data's region that was most useful for colon cancer histopathology image segmentation. EfficientnetB0 is employed to extract features from this segmented image in order to make an accurate diagnosis. The information obtained is then further processed for the prediction process using the BiGRU model. It is possible to process input sequences in both directions and accurately forecast colon cancer by using the BiGRU model. Additionally the efficacy of the proposed BiGRU approach was analyzed and evaluated against other conventional approaches like LSTM, DNN and Resnet18. The proposed approach has 97% of accuracy, 92% of specificity, 91% of MCC and 93.5% of kappa. The comparative analysis demonstrates that the suggested model provides an efficient result than the present approaches. Limitation of this current research include that focuses only on categorizing presence and absence of colon cancer but it does not categorize the types of colon cancer. In future work, concentrate on optimal deep learning to classify disease types effectively. Additionally, the proposed model can also be validated using real time data collected from various clinical aspects.
Acknowledgement
Funding : The authors declare that no funds, grants, or other support were received during the preparation of this manuscript.
Conflict of Interest: The authors declared that they have no conflicts of interest to this work. We declare that we do not have any commercial or associative interest that represents a conflict of interest in connection with the work submitted.
Availability of data and material: Not applicable
Code availability: Not applicable
Author contributions: The corresponding author claims the major contribution of the paper including formulation, analysis and editing. The co-authors provide guidance to verify the analysis result and manuscript editing.
Compliance with ethical standards: This article is a completely original work of its authors; it has not been published before and will not be sent to other publications until the journal’s editorial board decides not to accept it for publication.
References CD-BGRU Net: Detection of Colon Cancer in Histopathology Images Using Bidirectional GRU with EfficientnetB0 Feature Extraction System
- H. Qiu, S. Cao and R. Xu, “Cancer incidence, mortality, and burden in China: a time‐trend analysis and comparison with the United States and United Kingdom based on the global epidemiological data released in 2020,” Cancer communications, vol. 41, no. 10, pp. 1037-1048, 2021.
- M. Mahanty, D. Bhattacharyya, D. Midhunchakkaravarthy and T. H. Kim, “Detection of colorectal cancer by deep learning: An extensive review,” Int. J. Curr. Res. Rev, vol. 12, no. 22, pp. 150-157, 2020.
- A. Echle, N. T. Rindtorff, T. J. Brinker, T. Luedde, A. T. Pearson and J. N. Kather, “Deep learning in cancer pathology: a new generation of clinical biomarkers,” British journal of cancer, vol. 124, no. 4, pp. 686-696, 2021.
- C. Ho, Z. Zhao, X. F. Chen, J. Sauer, S. A. Saraf, R. Jialdasani... and W. Q. Leow, “A promising deep learning-assistive algorithm for histopathological screening of colorectal cancer,” Scientific Reports, vol. 12, no. 1, pp. 2222, 2022.
- M. Cui and D. Y. Zhang, “Artificial intelligence and computational pathology,” Laboratory Investigation, vol. 101, no. 4, pp. 412-422, 2021.
- T. Babu, T. Singh and D. Gupta, “Colon cancer prediction using 2DR e CA segmentation and hybrid features on histopathology images,” IET Image Processing, vol. 14, no. 16, pp. 4144-4157 (2020).
- A. B. Hamida, M. Devanne, J. Weber, C. Truntzer, V. Derangère, F. Ghiringhelli... and C. Wemmert, “Deep learning for colon cancer histopathological images analysis,” Computers in Biology and Medicine, vol. 136, pp. 104730, 2021.
- D. Ho, I. B. H. Tan and M. Motani, “Prognosticating Colorectal Cancer Recurrence using an Interpretable Deep Multi-view Network,” In Machine Learning for Health, pp. 97-109, 2021, PMLR.
- S. Karthick, N. Muthukumaran, “Deep Regression Network for Single-Image Super-Resolution Based on Down- and Upsampling with RCA Blocks,” Natl. Acad. Sci. Lett. (2023). https://doi.org/10.1007/s40009-023-01353-5
- A. Kumar, “Development of pattern analysis and machine learning technique for cancer diagnosis (Doctoral dissertation, School of Computer Science, UPES, Dehradun),” 2020.
- D. Sarwinda, R. H. Paradisa, A. Bustamam and P. Anggia, “Deep learning in image classification using residual network (ResNet) variants for detection of colorectal cancer,” Procedia Computer Science, vol. 179, pp. 423-431, 2021.
- T. Babu, T. Singh, D. Gupta and S. Hameed, “Colon cancer prediction on histological images using deep learning features and Bayesian optimized SVM,” Journal of Intelligent & Fuzzy Systems, vol. 41, no. 5, pp. 5275-5286, 2021.
- I. J. Swarna and E. K. Hashi, “Detection of Colon Cancer Using Inception V3 and Ensembled CNN Model, In 2023 International Conference on Electrical,” Computer and Communication Engineering (ECCE), pp. 1-6, 2023, IEEE.
- A. Davri, E. Birbas, T. Kanavos, G. Ntritsos, N. Giannakeas, A. T. Tzallas and A. Batistatou, “Deep learning on histopathological images for colorectal cancer diagnosis: A systematic review,” Diagnostics, vol. 12, no. 4, pp. 837, 2022.
- A. S. Sakr, N. F. Soliman, M. S. Al-Gaashani, P. Pławiak, A. A. Ateya and M. Hammad, “An efficient deep learning approach for colon cancer detection,” Applied Sciences, vol. 12, no. 17, pp. 8450, 2022.
- Z. Tasnim, S. Chakraborty, F. J. M. Shamrat, A. N. Chowdhury, H. A. Nuha, A. Karim... and M. M. Billah, “Deep learning predictive model for colon cancer patient using CNN-based classification,” International Journal of Advanced Computer Science and Applications, vol. 12, no. 8, pp. 687-696, 2021.
- A. T. Azar, M. Tounsi, S. M. Fati, Y. Javed, S. U. Amin, Z. I. Khan... and J. Ganesan, “Automated System for Colon Cancer Detection and Segmentation Based on Deep Learning Techniques,” International Journal of Sociotechnology and Knowledge Development (IJSKD), vol. 15, no. 1, pp. 1-28, 2023.
- P. Radhakrishnan, A. Anbarasi, K. Srujan Raju, Sai and B. V. Thrinath, “Detection of Colon Cancer Using Image Processing,” Cybernetics and System, pp. 1-13, 2023.
- I. D. Irawati, I. A. Larasaty and S. Hadiyoso, “Comparison of Convolution Neural Network Architecture for Colon Cancer Classification,” International Journal of Online & Biomedical Engineering, vol. 18, no. (3) (2022).
- M. Al-Rajab, J. Lu and Q. Xu, “A framework model using multifilter feature selection to enhance colon cancer classification,” Plos one, vol. 16, no. 4, pp. e0249094, 2021.
- Z. Vafapour, W. Troy and A. Rashidi, “Colon cancer detection by designing and analytical evaluation of a water-based THz metamaterial perfect absorber,” IEEE Sensors Journal, vol. 21, no. 17, pp. 19307-19313, 2021.
- Y. Su, X. Tian, R. Gao, W. Guo, C. Chen, C. Chen... and X. Lv, “Colon cancer diagnosis and staging classification based on machine learning and bioinformatics analysis,” Computers in biology and medicine, vol. 145, pp. 105409, 2022.
- M. A. Fahami, M. Roshanzamir, N. H. Izadi, V. Keyvani and R. Alizadehsani, “Detection of effective genes in colon cancer: A machine learning approach,” Informatics in Medicine Unlocked, vol. 24, pp. 100605, 2021.
- A. B. Hamida, M. Devanne, J. Weber, C. Truntzer, V. Derangère, F. Ghiringhelli... and C. Wemmert, “Weakly Supervised Learning using Attention gates for colon cancer histopathological image segmentation,” Artificial Intelligence in Medicine, vol. 133, pp. 102407, 2022.
- Dataset 1: https://www.kaggle.com/datasets/andrewmvd/lung-and-colon-cancer-histopathological-images
- Talukder, M. A., Islam, M. M., Uddin, M. A., Akhter, A., Hasan, K. F., & Moni, M. A. (2022). Machine learning-based lung and colon cancer detection using deep feature extraction and ensemble learning. Expert Systems with Applications, 205, 117695.
- RS, V. K. (2023). CoC-ResNet-classification of colorectal cancer on histopathologic images using residual networks. Multimedia Tools and Applications, 1-25.
- A. A. A. Mohamed, A. Hançerlioğullari, J. Rahebi, M. K. Ray, S. Roy, “Colon Disease Diagnosis with Convolutional Neural Network and Grasshopper Optimization Algorithm,” Diagnostics, vol. 13, no. 10, pp. 1728, 2023.
- Kumar, N., Sharma, M., Singh, V. P., Madan, C., & Mehandia, S. (2022). An empirical study of handcrafted and dense feature extraction techniques for lung and colon cancer classification from histopathological images. Biomedical Signal Processing and Control, 75, 103596.
- Yildirim, M., & Cinar, A. (2022). Classification with respect to colon adenocarcinoma and colon benign tissue of colon histopathological images with a new CNN model: MA_ColonNET. International Journal of Imaging Systems and Technology, 32(1), 155-162.
- Kumar, A., Vishwakarma, A., & Bajaj, V. (2023). Crccn-net: Automated framework for classification of colorectal tissue using histopathological images. Biomedical Signal Processing and Control, 79, 104172.
