Characterization of a pearlescent biaxially oriented multilayer polypropylene film

Author: Arkis Esen, Cetinkaya Hayrullah, Kurtulus Isil, Ulucan Utku, Aytac Arda, Balci Beste, Colak Funda, Germen Ece Topagac, Kutluay Gulistan, Dilhan Begum Can, Balkose Devrim
Journal: НБИ технологии @nbi-technologies
Section: Технико-технологические инновации
Article in issue: 3 (12), 2014.
Free access
The morphology, composition, optical, thermal and mechanical properties of a commercial pearlescent and multilayer BOPP film were determined in the present study. The film was polypropylene and it was biaxially oriented as shown by FTIR spectroscopy and X-ray diffraction. FTIR spectroscopy indicated carbonate ions, EDX analysis indicated the presence of Ca element, X-ray diffraction showed the presence of calcite and thermal gravimetric analysis indicated that 11.2 % calcite was present in the film. The 30 μm film consisted of a core layer filled with calcite and 4 μm thick upper and lower layers without any filler and from different polymers. There were long air cavities in the core layer with aspect ratios of 23 and 19 in machine and transverse directions making the film pearlescent. The surfaces of the film were very smooth and had surface roughness in the range of 3.052 nm and 11.261 nm as determined by AFM. The film melted at 163.6 oC had 51% crystallinity and had 6.3 nm polymer crystals when heated at 10 oC/min rate. The film thermally degraded in two steps. They consist in polymer fraction and decomposition of calcite, respectively. For 10 oC/min heating rate the onset of polypropylene degradation was 250 oC and calcite decomposition was 670 oC. The activation energies for polypropylene degradation and calcite decomposition were 64.8 kJ/mol and 204.8 kJ/mol. The tensile strength of the film in machine and transverse directions was 97.7 and 35.9 MPa, respectively.
Pearlescent film, bopp, x-ray diffraction, sem, afm, tensile strength
Short address: https://sciup.org/14968330
IDR: 14968330 | UDC: 667.633.2 | DOI: 10.15688/jvolsu10.2014.3.3
Характеристика перламутровой биаксиально-ориентированной полипропиленовой пленки
В настоящем исследовании были определены структура, состав, оптические, тепловые и механические свойства коммерческой перламутровой многослойной биаксиально-ориентированной полипропиленовой пленки (БОПП). Как показали НПВО-спектроскопия и рентгенография, пленка была полипропиленовой и биаксиально-ориентированной. НПВО-спектроскопия выявила наличие карбонатионов, электродиагностический анализ показал присутствие элемента Ca, рентгенография показала наличие кальцита, а термогравиметрический анализ выявил 11,2 %-ное присутствие кальцита в пленке. Пленка толщиной 30 мкм состояла из основного слоя, заполненного кальцитом, а также верхнего и нижнего слоев толщиной по 4 мк без наполнителей и состоящих из полимеров. В основном слое находились длинные полости воздуха с соотношением сторон 23 и 19 в продольном и поперечном направлениях, что сделало пленку перламутровой. Поверхности пленки были очень гладкими и, в соответствии с показателями АСМ, шероховатость поверхности варьировалась в диапазоне от 3052 нм до 11261 нм. Пленка, температура плавления которой составляла 163,6 °С, имела 51 % кристалличности и полимерные кристаллы диаметром 6,3 нм при скорости нагреваниядо 10 °С/мин. Термическое разложение пленки происходит в два этапа. На первом этапе происходит полимерная фракция, и на втором - разложение кальцита. При скорости нагревания 10 °С/мин распад полипропилена происходит при 250 градусах, а распад кальцита - при 670. Объемы энергии, образующиеся при вышеуказанных процессах, составляют 64,8 и 204, 8 кДж/моль соответственно. Прочность пленки в продольном и поперечном направлениях равна 97,7 МПа и 35,9 МПа соответственно.
Text of the scientific article Characterization of a pearlescent biaxially oriented multilayer polypropylene film
DOI:
Polypropylene (PP) is one of the most preferred polymers in food packing, protective coating and printing applications with its high stifness, high temperature resistance, good chemical resistance, lower moisture transmission rate and high mechanical stress properties [14; 16; 19; 22]. The polypropylene film that is stretched in both machine direction (MD) and across machine(transverse) direction to improve mechanical properties is called biaxially oriented polypropylene (BOPP). BOPP is widely used in packaging and in a variety of other applications due to their great potential in terms of barrier properties, brilliance, dimensional stability and processability [14]. Different fillers such as talc and calcium carbonate and pigments may be added to BOPP films in order to improve its optical properties and provide a pearly aesthetic look [11; 15]. Thus, flexible packaging companies are willing to use pearl films for their inexpensive prices, good decoration, and excellent performance. Generally, as they have a certain pearl effect, they are often used in cold drink packaging, such as ice cream, heat seal label, sweet food, biscuits, and local flavor snack packaging [16].
Mineral particles, such as calcium carbonate and talc powders, are widely used in biaxially oriented films, which are also called cavitated and pearlized structures. Pearled film is based on orientation process, where the interface around the particles is stretched forming small cavities in the polymer structure. The foam extent of the film is low but the film becomes highly opaque because of interscratches [12; 18; 22]. Pearl film is a kind of BOPP film by adding pearl pigments into plastic particles and through biaxial stretch heat setting. A typical pearl film is BOPP pearl film produced by A/B/A layer co-extruded biaxial stretch [30]. Three layer films are coextruded where the surface is optimized in order to attain good printability. In fact, the more pigment is in the system, the more light is scattered outward, making the system appear opaque and white [31]. Calcium carbonate particles having 0.7-3 µm size are often used in producing micro porous films [6].
The surface morphology of BOPP film could be investigated by atomic force microscopy. The polymer film is characterized by a nanometerscale, fiberlike network structure, which reflects the drawing process used during the fabrication of the film. The residual effects of the first stretching of the film surface can provide information on the way in which morphological development of the BOPP occurs [16; 17].
The aim of the present study is characterization of a commercial pearlescent BOPP film by advanced analytical techniques. The functional groups, crystal structure, morphology, surface roughness, light transmission and reflection, melting and thermal degradation of the film and mechanical properties were investigated.
ExperimentalMaterials
The pearlecent films that were kindly supplied by BAK Ambalaj Turkey were produced at their plant in Izmir. They were kindly supplied in form of A4 sized sheets with 30 µm thickness.
Methods
The functional groups in perlescent film were determined by infrared (IR spectroscopy). IRPrestige-21 FT-IR 8400S by Shimadzu was used to obtain FTIR spectrum of the film by transmission technique. The DRIFT FTIR spectra of the both surfaces of the film were obtained in Digilab Excalibur FTIR spectrophotometer using Harricks Praying Mantis attachment.
Crystal structre of the films was determined by X-ray diffraction using Phillips X’Pert Pro diffractometer system . Cu K a radiation was used and a scan rate of 2 o q /min was applied.
SEM micrographs of upper and lower surfaces and cross section of gold coated Pearlescent BOPP films taken by a FEI Quanta 250 FEG type scanning electron microscope. Chemical composition of the film surface was determined by EDX analysis using the same instrument.
AFM (Nanoscope IV) and silicon tip were used to obtain surface morphology and roughness of the film. 1 Ohm Silicon tip has coating: front side - none, back side - 50 +/-10 nm Al. Cantilever properties are: T - 3.6-5.6 µm, L - 140-180 µm, k - 12-103 N/m, fo - 330-359 kHz, W- 48-52 µm. To achieve surface properties of pearlescent BOPP film, it was cut in 1x1 cm size, then it was put in sample holder in AFM. USRS 99-010, AS 01158-060 serial no OD57C-3930 standard was used in reflection mode. For the reflection spectrum, a black CD was placed at back of the film. The film was thermally treated under pressure to eliminate its pores. Thus, the transparency of perlescent film and heat treated film were tested. The perlecent film’s thickness was reduced from 30 µm to nearly 23 µm in a compression molding machine (Shinto) in two stages. Film is exposed in the hot press with preheating for 3 minutes under 0 kg/cm2 pressure, then heated for 3 minutes at 60 kg/cm2. After this stage, film was placed in a cold press for 3 minutes at 150 kg/cm2. The light transmission from the films was tested by covering the surface of a paper with our Institute’s logo.
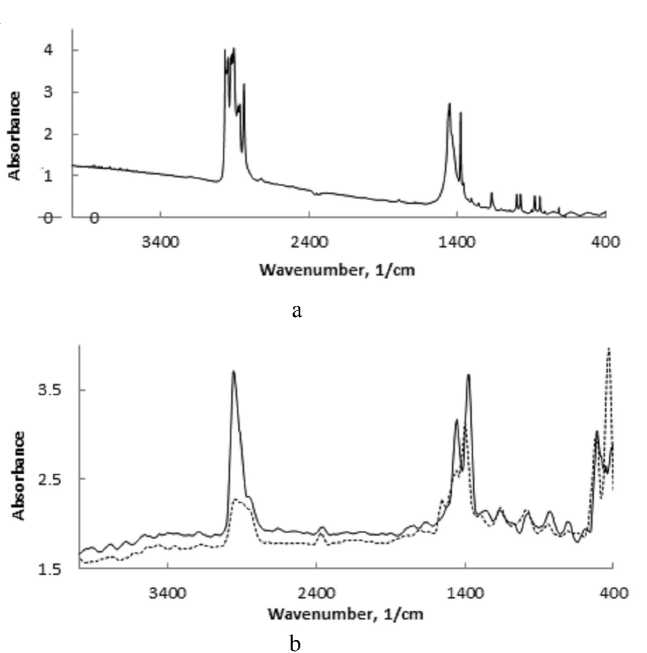
Fig. 1. a . DRIFT FTIR spectra of front (dotted line) and back (continious line) surfaces of the film, b . Transmission spectrum
The stress strain diagrams of the film in machine direction and transverse direction were obtained with Texture Analyser TA-XT2 (Stable microsystem, Godalming, UK) having Exponent stable Micro Sytem software. The test is done in ASTM D882. The strips with 5 mm width and 10 mm length were strained at 5 mm/min rate.
Results and DiscussionFTIR spectroscopy
Figure 1, a shows the pearlescent BOPP film FTIR spectrum taken by the transmission method. The peaks between 2950 and 2800 cm-1 correspond to the various aliphatic CH stretching modes. The peaks near 1450 cm-1 and 1380 cm-1 are the CH2 and CH3 deformation bands, respectively [10]. The other peaks below 1400 cm-1 are the well-known “fingerprint” of isotactic PP. The peak at around 1500 cm-1 of pearlescent BOPP film is wide and caused by existence of calcite. The reason of the increase of the peaks around this region is calcite. The bands at ~1420, ~874 and ~712 cm-1 could be attributed to vibrations of CO3 group of calcite [8].
The DRIFT FTIR spectra of the both surfaces of the film are seen in Figure 1, b . The peak around 3000 cm-1 for back surface is similar to previous result but for front surface, peak is very small. The spectrum of the surfaces of the pearlescent film was very different from the transmission spectrum, indicating that they were made out of a different polymer. PVdC and acrylic coatings were used for making the pearlescent film heat sealable and printable. However, without further characterizations it was not possible to identify the polymer surfaces of the film.
X-ray diffraction
In Figure 2 X-ray diffraction diagram of the film in 5-35o 2 theta range is seen. The maximum reflection points of biaxially oriented isotactic polypropylene were observed at 14.2o (110); 17o (040); 18.85 (130); (111) 21.4o; (-131) 21.8o 2 theta values in the figure [9].
The sharp peak at 29.4o 2 theta value can be attributed to 104 planes of calcite. The X-ray diffraction diagram of the film in 35-65o 2 theta values is seen in Figure 3. Observed peaks at
36.03, 39.4, 43.2, 47.2, 47.4, 47.6, 48.5o2 theta values are very close to peaks of calcite reported in JCPDS Card Index File, Card 5-5868, which are two theta values of 36.03, 39.4, 43.2, 47.2, 47.5, 48.6. Thus the presence of calcite was also confirmed by X-ray diffraction.
SEM and EDX
The SEM micrographs of the cross sections of the film in machine and transverse direction are seen in Figure 4. The film has a layer structure. The top and bottom surface layers which had 4 µm thickness do not have any solid particles. FTIR analysis had indicated that the two surfaces were made out of two different polymers other than the core layer. The SEM micrographs of the surfaces indicated that they were very smooth. The core layer with 22 µm thickness had a stratified structure. There were holes having very high aspect ratio created by the 0.8-3 µm sized particles and the orientation process. The dimensions of the pores in machine direction has length 16.4 ± 6.2 µm and width 0.7 ± 0.3 µm, in transverse direction -length 9.14 ± 3.99 µm and width 0.47 ± 0.5 µm.
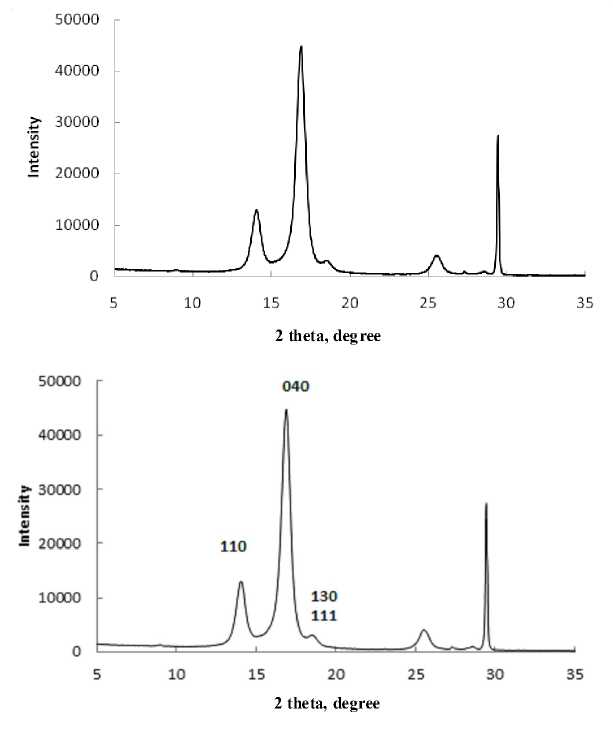
Fig. 2. X-ray diffraction diagram of the film in 5-35 o2 theta range
Mean aspect ratios (length/width) of poresobserved in Figure 4, a and Figure 4, b are 23 and 19 respectively.
The EDX analysis of the surface of the filler particles indicated that they consisted of Ca, C and O elements. They had a composition similar to CaCO3 which had 40% Ca, 12 % C and 48 % O. EDX analysis of the particles showed that the particles had 42.8 ± 1.6 % Ca, 22.3 ± 3.73 % C and 34.9 ± 5.2 % O. The particles were calcite and they were coated by a compound which was rich in C.
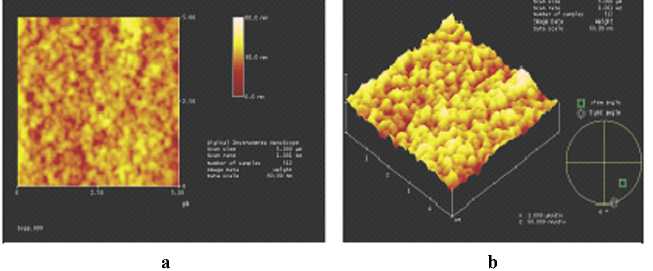
AFM study
Typical images of the surface of the perleascent film in two and three dimensions are seen in Figure 5. The surface consists of spherical particles. No network stucture was observed as indicated by previous studies for 8:1 draw ratio, indicating the draw ratio of the pearleascent film in machine and transverse direction were close to each other. The surface rougness of the films was determined in three different regions and reported in Table 1. The rootmean square roughness (Rms) was between 3.052 and 11.261 nm and average roughness (Ra) was in the range 2.330-7.326 nm. This low roughness values indicated that the surface of the pearlescent films was very smooth.
DSC analysis
DSC analysis was used to determine melting point, melting heat and crystallinity, the crystallite size and activation energy of the melting process.The DSC curves of the sample heated at different rates are seen in Figure 6. A shoulder corresponding to the melting of small crystallites was observed at all heating rates. This shoulder was also observed for biaxial oriented polypropylene by previous investigators [24]. The melting temperature shifts to higher temperatures as the rate of heating was increased.
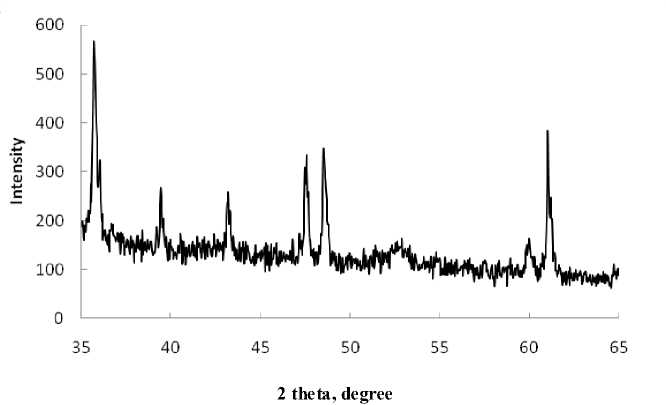
Fig. 3. X-ray diffraction diagram of the film in 35-65° 2 theta range
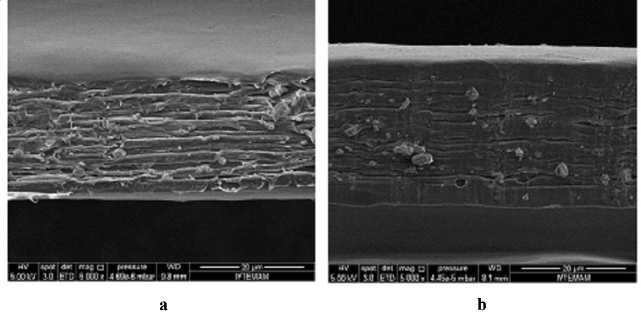
Fig. 4. SEM micrograps of the crossections of the film in a . Machine direction, b . Transverse direction
Table 2 shows enthalpy of melting, melting temperature and crystallinity determined at different rates of heating of the film.
The degree of crystallinity ( Xc ) of the samples from DSC melting peaks were determined using Equation 1.
The Thompson-Gibbs equation predicts a linear relationship between Tm and the reciprocal of crystal thickness.
T
m
= T 0 1 m
V
2σ
L c P c KH 0
xc ( % ) = ^Hmr x 100 . cV ' wKH0
Where D H m is the melting enthalpy of the samples (J/g) and D H 0 f is the heat of the fusion of PP at 100 % crystallinity, correspondent to 207 J.g-1 [24] . The crystallinity of the film also increases with the rate of heating.
Where s is the fold surface free energy, T0m is the equilibrium melting temperature, r c is the crystal phase densitiy of pp, D H 0 f is the heat of the fusion of PP at 100 % crystallinity, correspondent to 207 J.g-1 [7], and Lc is the thickness of the lamellar crystals. T 0 m is 459,1 K [23], r c is 946 kg/m3 [26] and s is 30.1 mN/m [27]. The crystal thickness values determined by using the melting temperature for different heating rates are reported in Table 2. They were in the range of 6.1 to 6.5 nm.
a
b
Fig. 5. AFM micrographs of the surface of the perleascent films a . Two dimensional, b . Three dimensional appearence
Table 1
Image Statistics of Perleascent BOPP Films at three different regions
|
Scan size, µmx µm |
5x5 |
5x5 |
1x1 |
|
Z range, nm |
38.155 |
113.93 |
21.031 |
|
Raw mean, nm |
25.591 |
53.191 |
-37.563 |
|
Rms (Rq), nm |
4.861 |
11.261 |
3.052 |
|
Ra, nm |
3.821 |
7.326 |
2.330 |
|
Srf. Area, µm² |
25.057 |
25.121 |
1.003 |
Table 2
Enthalpy of melting, melting temperature and crystallinity determined by DSC
|
Β, oC/min |
ΔHm, J/g |
Tm, oC |
Crystallinity, % |
Lc, nm |
|
5 |
87.63 |
162.9 |
48 |
6.1 |
|
10 |
93.75 |
163.6 |
51 |
6.3 |
|
15 |
129.07 |
164.2 |
60 |
6.5 |
TG analysis
Thermo gravimetric analysis (TGA) method was also employed to understand thermal degradation behavior of the BOPP film. Typical weight loss (TGA) curves of BOPP film at heating rate of 5, 10 and 15 oC/min under nitrogen is seen in Figure 7. It is observed that thermal degradation process of BOPP film proceeds in two stages. The first stage corresponds to the degradation of polymer. The second stage is related to the decomposition of calcium carbonate. The degradation of the BOPP film started at 235 oC, 258 oC and 265 oC at heating rate of 5 oC, 10 oC and 15 oC/min respectively. The maximum rate of degradation of BOPP film was 358, 404.6 and 412 oC at 5 oC, 10 oC and 15 oC/min heating rates respectively. The second step of the mass loss observed in Figure 7 was for the decomposition of calcite. Figure 7 displays that the degradation of the calcium carbonate started at 648 oC, 670 oC and 675 oC at the heating rate
5, 10 and 15 C/min, and its rate was maximum at 690 oC, 721.5 oC and 714.7 oC for 5 oC, 10 oC, 15 oC heating rates.
The second stage of the mass loss belongs to decomposition of calcium carbonate. The calcium carbonate decomposes calcium carbonate and carbon dioxide;
CaCO 3 ( s ) ^ CaO ( s ) + CO 2 ( g ) . (3)
If one mole of calcium carbonate decomposes, one mole of calcium oxide and one mole of carbon dioxide would form. Thus the second step is for the evolution of CO2 from CaCO3. From the mass loss of the second step of the degradation curve it was found that the film contained 11.2 % CaCO3.
In this study decomposition activation energy was determined by using Flynn and Wall equation. Flynn and Wall derived a convenient method to determine the activation energy from weight loss curves measured at several heating rates.
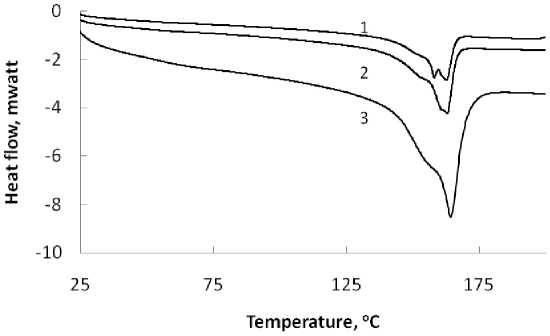
Fig. 6. DSC curves of the film at 1.5 °C/min, 2.10 °C/min, 3.15 °C/min heating rates
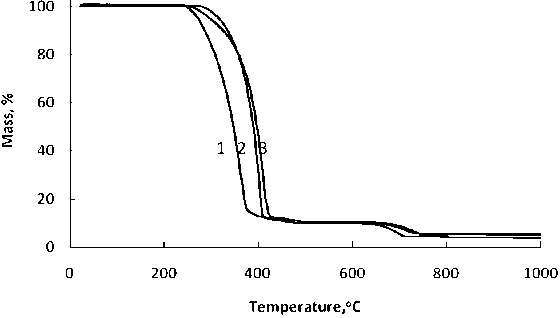
Fig. 7. TG curves of the film for 1.5 °C/min, 2.10 °C/min, 3.15 °C/min heating rates
The following relationship is used to calculate the activation energy [28].
E = - R b
d log ( e )

where E = activation energy (j/mol), R = gas constant (8.314 j/mol K) and b = constant (0.457) [ibid.].
The values of 1, 2 and 5 % decomposition level were chosen to determine the activation energy for degradation of the polypropylene and temperatures for these conversions were red from Figure 7. The activation energy was determined directly by plotting the logarithm of the heating rate versus 1000/T at constant conversion. The plotted data produced straight lines with R 2 values higher than 0.93. From the slopes the activation energy values were found and they are reported in Table 3. The average activation energy was 64.8 kJ/mol.
The activation energy for the decomposition of the calcite in the film was detemined in the same manner and reported in Table 3. The average activation energy for the decomposition of calcite was found as 204.8 kJ/mol.
Optical properties
The unique luster of pearls depends upon the reflection, refraction, and diffraction of light from the translucent layers. The thinner and more numerous the layers in the pearl, are the finer the luster is. The iridescence that pearls display is caused by the overlapping of successive layers, which breaks up light falling on the surface [29]. The film under study had polypropylene layers separated by long and thin air pockets formed by orientation process and calcite particles as seen electron micrograph in Figure 4. Thus it shows pearlescent behavior.
Polypropylene polymer can reflect only a very small percentage of incoming light. We used Fresnel equation
R _ ( n 1 — n 2 Г ( n 1 + n 2 ) 2
In the above equation, ‘n1 ’ and ‘n2’ indicate the reflection indices of polypropylene and air, respectively. Reflection values were calculated considering Frensel’s equation. Reflection index of polypropylene is 1.49 and 1.0 for air [5] . Then, reflection ( R %) was calculated as 3.87 %. However, the film under
Table 3
Activation energy for degradation of polypropylene and calcite
|
polypropylene |
calcite |
||||
|
Mass loss, % |
R 2 value |
Ea , kJ/mol |
Mass loss, % |
R 2 value |
Ea , kJ/mol |
|
1 |
0.99 |
64.8 |
93.1 |
0.98 |
-195.6 |
|
2 |
0.96 |
66.4 |
92 |
0.99 |
-209.6 |
|
5 |
0.93 |
63.4 |
93 |
0.99 |
-209.1 |
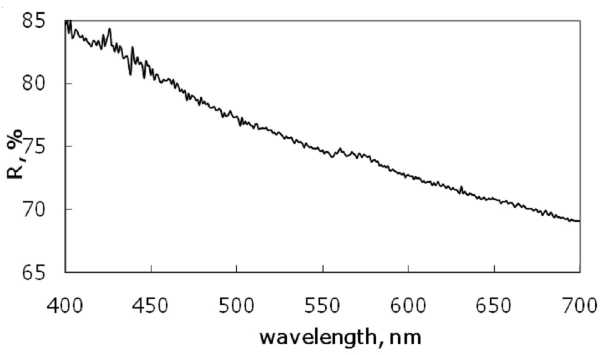
Fig. 8. Reflection spectrum of the film under study
study reflects 85 % of light at 400 nm and 65 % at 700 nm as seen in its reflection spectrum in Figure 8. The thin layers and the air gaps between them is the cause of this pearlescent effect.
It was reported that BOPP films were transparent to light and the smoother surface they had, the more transparent they were [20]. It followed that the clearest films were obtained from sheets with the most homogeneous texture, such as obtained by quenching from the melt, and by orienting at the lowest temperature, which minimized the amount of melting [ibid.]. The film in the present study was a sandwich type BOPP film having a core layer with calcite. The film reflects light but it does not transmit it. The transmission spectrum of the film in Figure 9 indicated that 0.36 % of incident light was transmitted at 400 nm and 0.5 % was transmitted at 700 nm.
The light was not transmitted from the film because of the air holes in the film. When these holes were removed by hot pressing of the film, it became transparent as seen in Figure 10. The logo of our Institute covered by the pressed film was visible, but when the logo was covered by the pearlescent film it was not visible. The perlescent film was opaque and when the air holes were removed it was transparent even if it contained 12 % calcite. It was the air gaps not the calcite making the film opaque and pearlescent.
Mechanical Properties
The mechanical properties of BOPP in machine and transverse direction are different. In Figure 11 and Figure 12 stress strain diagrams of the film in transverse and machine directions are seen.
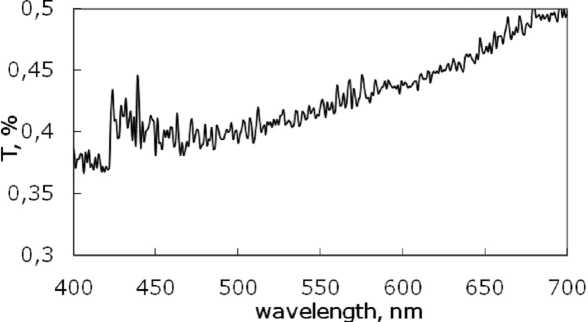
Fig. 9. Transmission spectrum of the film in visible region
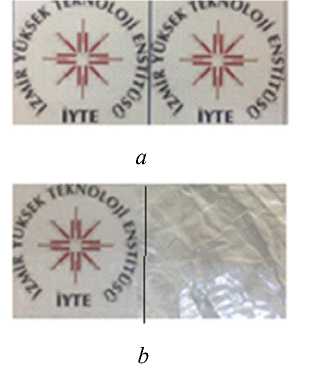
Fig. 10. a . Paper surface without sample films, b . Paper surface covered with sample films: Left side was covered with nearly 23 micron pressed film. Right side was covered with 30 micron original white BOPP film sample
The tensile strength in transverse direction is lower and strain at break is higher than those of machine direction as reported in Table 4. Tensile stress 35.9 MPa and 97.7 MPa, elongation at break 157 % and 37 % for transverse and machine directions. respectively. No yield point was observed in the BOPP film with calcite. BOPP film without calcite was characterized by Yuksekkalayci et al [1] and it had the yield point (34.2 MPa and 42.2 MPa) machine direction and transverse direction. The film without calcite had higher values of tensile stess (151 MPa and 270 MPa) [ibid.] in machine and transverse directions than the film with calcite. However, the elongation at break values (150 %, 32 %) was closed to the values for the film with calcite.
The presence of pores lowers the tensile strength, however the elongation values were closer. The modulus of elasticity of the film under study also changed with direction. It was lower (0.129 MPa/%) in transverse direction than in machine direction (2.93 MPa/%). However, the film without calcite had much higher elastic modulus values 2.8 to 5.9 GPa. Thus, the calcite filled BOPP film was much more flexible than the film without calcite.
CONCLUSION
A pearlescent packing material supplied by BAK ambalaj Turkey was characterized for obtaining information about its properties for its
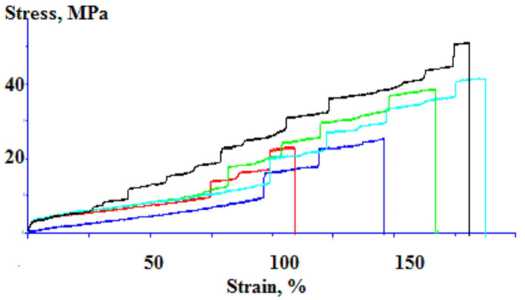
Fig. 11. Stress strain curve of the film in transverse direction
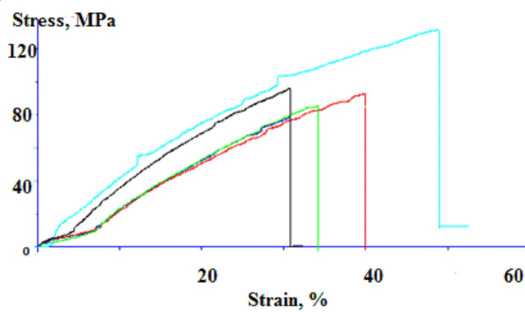
Fig. 12. Strain stress diagram of the film in machine direction
Table 4
Mechanical properties of the film in machine and transverse directions
ACKNOWLEDGEMENT
The authors thank Bak Ambalaj Turkey for providing the pearlescent films for this study.
