Characterizing export specialization of northwestern federal district regions within the framework of the economic complexity concept

Author: Cheplinskite I.R., Lukin E.V.
Journal: Economic and Social Changes: Facts, Trends, Forecast @volnc-esc-en
Section: Regional economy
Article in issue: 2 т.17, 2024.
Free access
The issue of achieving economic development, which is especially acute in the context of geopolitical turbulence, is of interest to government representatives and scientists, both Russian and foreign. One of the ways to resolve it is to make the economy more complex, and identify the most and least developed segments. The latter is implemented within the framework of the concept of economic complexity. The aim of the work is to study specifics of the export specialization of Northwestern Federal District regions. To achieve the goal, we address tasks such as determining the export specialization of the regions of the Northwest of Russia, identifying the commodity structure of the received specializations, and determining the micro-specializations of the regions within the district. Based on the statistical data of the federal customs administrations on foreign trade of the country’s constituent entities, we calculate the index of identified comparative advantages. Through the assessment of the index values and the contribution of goods to the total volume of exports of the regions, we determine the goods of the export specialization of Northwestern Federal District regions and reveal the main specialization of the district. Among the goods characterized by a small contribution to the total volume of exports of the regions, the search for promising micro-specializations is carried out in two ways. As part of the first method, among the goods exported by Northwestern Federal District regions, we highlight those in whose supplies Russia occupies a leading position in the world. The second way is to assess the markets of developing countries. Scientific novelty of the research lies in the definition of goods of export specialization of Northwestern Federal District regions using the tools of the concept of economic complexity. Information base of the study includes data from federal customs administrations, the financial company MSCI, foreign databases Trade Map and The Observatory of Economic Complexity, as well as Russian and foreign research in the field of industry specializations. The results of the study can be used by regional authorities in the development of strategic documents, to substantiate economic policy in the search for promising economic specializations and market niches.
Export specialization, specialization industries, economic complexity, micro-specializations, northwestern federal district
Short address: https://sciup.org/147243859
IDR: 147243859 | UDC: 332.12 | DOI: 10.15838/esc.2024.2.92.4
Text of the scientific article Characterizing export specialization of northwestern federal district regions within the framework of the economic complexity concept
The research was supported by Russian Science Foundation grant 23-28-01862, project/23-28-01862/.
The issue of achieving economic growth does not lose its relevance. It has become especially acute in the context of geopolitical turbulence, aggravated by sanctions intensified since February 2022, which caused a slowdown in Russia’s economic development. The studies aimed at finding ways to promote economic growth are highly relevant not only from the standpoint of theoretical economics, but also in the context of improving the quality of management decisions (Baranov, Skufina, 2018; Lukin, Uskova, 2018). However, this requires conducting research on many different aspects, including the specifics of national economies and economies of individual regions, their industry specialization, and identification of the most and least developed segments (Lyubimov et al., 2017).
Economic growth is promoted by export activities that affect the foreign economic situation of the country’s market and contribute to economic development of territories. At the same time, non- primary exports are of great importance. With a low share of products from high-tech industries in the total volume of goods and services supplied abroad, it is difficult for the country to integrate into the global economic space and ensure effective domestic development (Gulin et al., 2018; Koptseva, Salimonenko, 2020).
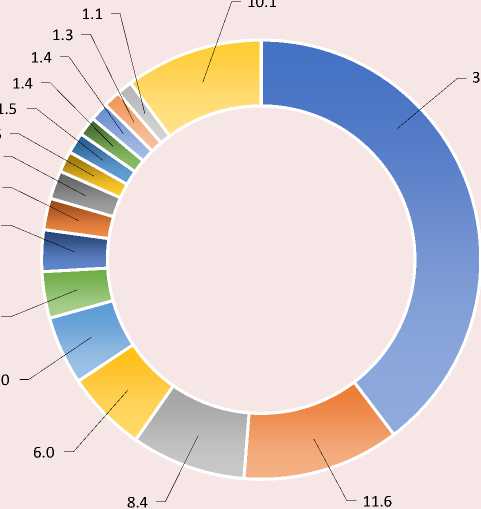
The need to increase exports of non-primary products also arises in regions of the Northwestern Federal District (NWFD; Figure ). As of 2021, in the structure of goods supplied by the NWFD abroad, the share of goods of low processing, which include oil and petroleum products, fertilizers, precious and semi-precious stones, ores, nickel, cereals, some of ferrous metal products1, accounted for more than 50% of total exports.
Commodity structure of NWFD exports in 2021, % of the total
1.3
6.0
11.6
Mineral fuels, oil and petroleum products
Fertilizers
Ferrous metals
Wood and wood products
Fish and crustaceans, shellfish
Precious and semi-precious metals and stones
“ Paper and cardboard
Ores, slag and ash
Nickel and its products
Means of land transport
Nuclear reactors, boilers
Electrical machinery and equipment
Means of water transport
Inorganic chemistry products
Cereals
Other goods
Source: own compilation based on Federal Customs Service data.
Data from a survey of heads of industrial enterprises in the Northwest of Russia conducted by RAS Vologda Research Center in 2023 (Shirokova, Lukin, 2023) show that 20% of respondents intend to increase the depth of processing of manufactured products, and only 20% of enterprises have reached the maximum processing depth. Due to restrictions on trade with unfriendly countries, industrial companies have faced a number of problems that limit their functioning. According to 85% of respondents, the most acute issues include difficulties in obtaining imported components and raw materials. Some enterprises (16%) have already launched the production of import-substituting goods; 13% plan to launch such production. However, one of the main measures to adapt to the new conditions was the search for new markets for manufactured goods both domestically (72%) and abroad (42%). The majority of respondents (65%) intend to continue producing the same goods as before, only with a change in the main consumer.
Under the current conditions, it is necessary to complicate the economy, but it requires finding out regional specializations, which is feasible through the concept of economic complexity, which evaluates the export baskets of countries and individual territories within them. Thus, the aim of our work is to study export specialization of Northwestern Federal District regions. Achieving the goal requires addressing the following tasks: identifying goods of export specialization of Northwestern Federal District regions; identifying the commodity structure of export specialization of NWFD regions; identifying goods within the microspecialization of NWFD regions.
We regard regions as units of the administrative-territorial division of Russia. The object of the study is the economy of the Northwestern Federal District, the subject is export specialization of regions of the NWFD.
Theoretical background of the study
International and Russian practice contains many approaches to determining the economic specialization of individual territories based on the calculation of various indicators and appropriate techniques. The most widely used is the localization coefficient (Kopczewska et al., 2017; Fracasso, Marzetti, 2018), otherwise called the Hoover – Balassa coefficient or the Hoover specialization index (Hoover, 1936). With its help and with the use of such indicators as, for example, production output or the number of employees, it is possible to calculate the concentration of the industry in the region and assess its significance for the economy at the moment, as well as to study its development in dynamics (Kutsenko et al., 2019). The indicator of specialization is the index value, at which a unit (or, less often, an interval from 0.8 to 1.25) is taken as a threshold value (Kutsenko, Eferin, 2019).
Some studies use indicators such as coefficients of per capita production, interdistrict marketability (Barsukov et al., 2019), Herfindahl – Hirschman indices, specialization level (Belov, 2012), Gini concentration index (Devereux et al., 1999; Kolmakov et al., 2019), and a number of others. They are based on data on the volume of output or export of products, level of consumption, share of the region in national or industry production, etc. Like the localization coefficient, they indicate the presence of specialization in the industry in the region if the numerical value of the indicator exceeds a threshold – from 0.5 to 1 (Prokopyev, 2015).
Among the listed indicators, the coefficient of interdistrict marketability is based on data on the regions’ foreign trade. It represents the ratio of the volume of goods exported from the region to the volume of its production. The use of the indicated coefficient is difficult due to the discrepancy between the commodity nomenclature and the general classifier of economic activities in statistical data on exports and shipments of regions as the main sources for its calculation. This requires searching for another indicator to identify promising economic specializations based on export data.
In addition to the limitations associated with finding the information necessary for calculations, the above indicators have another drawback. It lies in the fact that the resulting totals may lead to a reassessment of industry specialization or vice versa, which is typical for regions with large agglomerations producing a wide range of goods. To avoid inaccuracies, researchers introduce additional indicators, adjust existing ones or develop their own techniques for determining the region’s specialization. Thus, in 2014, the European Cluster Observatory proposed a methodology for identifying branches of specialization, in which the latter were distributed according to their level of development in the region, and also divided into clusters (Ketels, Protsiv, 2014). This technique was tested by Russian researchers (Kutsenko et al., 2019; Simachev et al., 2014), and it went through certain adjustments, which, in order to minimize errors, make the conditions for classifying the industry as a specialization of the region more strict, which helped to exclude regions characterized by unilateral concentration or specialization (Kutsenko, Eferin, 2019).
Some studies are aimed not only at identifying the current branches of regions’ specialization, but also at finding promising ones. So, an example is a technique developed by A.V. Kotov and co-authors under the order of the Ministry of Economic Development of the Russian Federation. It is based on the competence matrix of the region, using a number of calculated indicators characterizing the effectiveness of the current specialization, assessing the innovative and scientific and technological potential of the territory (Kotov et al., 2019).
A team of researchers from Vologda Research Center of the Russian Academy of Sciences and Vologda State University designed their own methodology for identifying promising economic specializations of the Vologda Region (Rumyantsev et al., 2022). It is based on the abovementioned research by A.V. Kotov and co-authors and considers a number of components, including the effectiveness of the industry specialization that has developed in the region, market potential, innovation activity, as well as the availability of publications corresponding to economic activities. In addition, the authors take into account the need for technological sovereignty of the economy and aspects related to the transformation of existing value chains. They highlighted indicators that, after calculation, are assigned a point score in accordance with certain intervals. The final score is an integral assessment of the potential of a promising specialization.
The techniques for identifying promising specializations described above are based on a wide range of indicators, including those taking into account the innovative and scientific component of the regions’ potential; however, our study assumes a narrower focus on the regions’ foreign trade, which requires searching for other methods and choosing other indicators. In the context of identifying branches of specialization, the concept of economic complexity has been widely used, based on the index of identified comparative advantages and a number of other indicators, among which the ECI (Economic Complexity Index) occupies a central place (Hausmann, Klinger, 2006; Hidalgo, et al., 2007; Tacchella et al., 2012). It allows assessing the structure, scope and depth of the economy, taking into account the diversity and uniqueness of its sectors. The index is also used to forecast economic growth, identify areas for diversification and development of national economies (Kudrov, 2023).
Materials and research methods
To identify export specialization branches of NWFD regions, we used the RCA (Revealed comparative advantage) index (Balassa, 1965), calculated as follows:
RCA cp = (eX^/^ cEX cp) /(^ pEX^f^p^cEX^ , (1)
where EXcp — exports of commodity p by country c ;
-
£ cEXcp — sum of total export of country c;
-
£ pEXcp — global export of commodity p;
Ep^ cEXcp — total global export.
The formula described above is used to calculate comparative advantages at the country level. Our study examines the complexity at the level of individual regions, and therefore expression (1) requires some adjustments. So, we consider EXcp as export of a particular commodity p by region c ; £cEXcp — total export of region c ; £pEXCp – export of commodity p by the whole country; EpE cEXCp — total export of the country. The numerator calculates the share of commodity p in the total export of region c , the denominator – the share of the same commodity in the structure of economic activity of the whole country. Thus, in this expression, the shares of commodity p in the total export of the region and the country are compared.
To establish the fact of the revealed comparative advantage in the export of commodity p , the calculated indices are checked for a restriction type condition from the bottom: if its value is greater than a certain value, then the region has advantages, if less, then there are none (Afanasiev, Kudrov, 2021). In the framework of the works we have reviewed, a unit was chosen for the threshold value in most cases, so we introduced the same value by analogy.
The information base of our study includes statistical data from the customs administrations of federal districts and the Kaliningrad Regional Customs, foreign databases containing information on the volume and structure of world export, such as Trade Map and The Observatory of Economic Complexity, data from the financial company MSCI in the field of emerging markets. Domestic and foreign research in the field of industry specializations was also used.
Body of the work
In the course of our work, we collected data on foreign trade of 85 constituent entities of Russia for 2021, obtained on the websites of customs administrations for federal districts. On this basis we calculated RCA indices for each constituent entity. With the established limitation of the index value at the unit level, we received the following number of goods in the export of which NWFD regions have the identified comparative advantages: Republic of Karelia – 60, Komi Republic – 25, Arkhangelsk Region (together with the Nenets Autonomous Area) – 60, Vologda Region – 55, Kaliningrad Region – 22, Leningrad Region – 200, Murmansk Region – 26, Novgorod Region – 101, Pskov Region – 194, Saint Petersburg – 351. Reducing their number requires introducing an additional restriction, namely the contribution of these goods to the total exports of each region. Thus, those items whose share in the total volume was at least 1% are classified as export specialization goods. The total number of commodity items is shown in Table 1.
The Pskov Region occupies a leading position in terms of the number of goods with the identified comparative advantages in its export. The Vologda Region and the Karelia Republic are also characterized by a large number of such goods, while their number for the Kaliningrad and Novgorod regions and Saint Petersburg is the smallest. The latter is distinguished by a large number of goods with a comparative advantage from different industries, but their share in the total supply is small.
As a result of the calculations, a list of goods in the export of which there is an identified comparative advantage was obtained for each region ( Tab. 2 ).
The obtained values of the comparative advantage index range from several units (for example, 1.72 for oil and petroleum products in the Komi Republic or 3.58 for wheat and meslin in the Kaliningrad Region) to several hundred and thousands (1186.97 for ship derrick cranes in the Pskov Region). The lowest values are typical for goods that are widely distributed in the export baskets of regions not only in the Northwest of Russia, but also in the country as a whole; that is, they are traded by many constituent entities of the
Table 1. Number of goods in the export of which the regions of the Northwestern Federal District have the identified comparative advantages, units
|
NWFD constituent entity |
Number of goods |
|
Pskov Region |
16 |
|
Karelia Republic |
12 |
|
Vologda Region |
12 |
|
Arkhangelsk Region (with the Nenets Autonomous Area) |
11 |
|
Leningrad Region |
11 |
|
Murmansk region |
11 |
|
Komi Republic |
10 |
|
Novgorod Region |
6 |
|
Saint Petersburg |
6 |
|
Kaliningrad Region |
3 |
|
Source: own calculation based on Federal Customs Service data. |
|
Table 2. Export priorities of Northwestern Federal District regions in accordance with the index of identified comparative advantages, 2021
|
Specialization |
RCA |
Specialization |
RCA |
|
Karelia Republic |
|||
|
Ores and concentrates, iron |
33.91 |
Chipboard |
24.52 |
|
Sawn timber |
16.57 |
Frozen fish |
5.93 |
|
Kraft paper and kraft cardboard |
101.05 |
Unprocessed timber |
11.12 |
|
Newsprint |
66.99 |
Fillets of fish and other fish meat |
16.22 |
|
Wood pulp |
19.31 |
Nuclear reactors |
7.30 |
|
Fuelwood production |
41.26 |
Lumber in the form of profiled mouldings |
44.36 |
|
Komi Republic |
|||
|
Oil and petroleum products |
1.72 |
Newsprint paper |
50.50 |
|
Glued plywood |
44.34 |
Wood pulp |
12.36 |
|
Sawn timber |
10.51 |
Carbon |
366.28 |
|
Kraft paper and kraft cardboard |
72.30 |
Linoleum |
279.15 |
|
Uncoated paper and cardboard |
75.99 |
Lumber in the form of profiled mouldings |
39.94 |
|
Arkhangelsk Region (with the Nenets Autonomous Area) |
|||
|
Sawn timber |
26.30 |
Frozen fish |
7.38 |
|
Diamonds, processed or unprocessed |
234.76 |
Fuel wood |
35.38 |
|
Uncoated paper and cardboard |
84.87 |
Uncoated paper and cardboard |
34.14 |
|
Kraft paper and kraft cardboard |
55.79 |
Fillets of fish and other fish meat |
15.98 |
|
Pulp production |
31.49 |
Glued plywood |
26.30 |
|
Crustaceans |
7.80 |
||
|
Vologda Region |
|||
|
Hot rolled products made of iron and non-alloy steel |
25.26 |
Semi-finished products made of iron or non-alloy steel |
2.25 |
|
Complex chemical fertilizers |
23.40 |
Front and mirror cast iron |
5.15 |
|
Nitrogen fertilizers |
10.49 |
Glued plywood |
4.26 |
|
Clad rolled products made of iron and non-alloy steel |
34.31 |
Cold rolled products made of iron and non-alloy steel |
8.99 |
|
Iron ores and concentrates |
7.34 |
Unprocessed timber |
6.79 |
|
Sawn timber |
3.43 |
Pipes made of ferrous metals |
8.76 |
|
Kaliningrad Region |
|||
|
Wheat and meslin |
3.58 |
Light motor vehicles |
5.33 |
|
Ferrous metal waste and scrap |
9.12 |
||
|
Leningrad Region |
|||
|
Oil and petroleum products |
3.14 |
Industrial tobacco |
44.88 |
|
Complex chemical fertilizers |
8.87 |
Ferroalloys |
7.09 |
|
Tires and pneumatic rubber tires |
20.03 |
Ammonia, anhydrous or in aqueous solution |
54.96 |
|
Ferrous metal waste and scrap |
4.94 |
Uncoated paper and cardboard |
25.91 |
|
Petroleum gases and other gaseous hydrocarbons |
17.03 |
Phosphinates (hypophosphites), phosphonates (phosphites) and phosphates |
29.06 |
|
Sawn timber |
2.31 |
||
|
Murmansk Region |
|||
|
Nickel matte |
105.03 |
Fillets of fish and other fish meat |
32.45 |
|
Crustaceans, in shell or without shell |
35.89 |
Frozen fish, except for fish fillets |
11.45 |
|
Raw nickel |
103.40 |
Oil and petroleum products |
2.40 |
|
Iron ores and concentrates |
17.10 |
Cobalt matte |
2.89 |
|
Aluminum ores and concentrates |
104.97 |
Refined copper and raw copper alloys |
104.59 |
|
Calcium phosphates |
93.51 |
||
End of Table 2
|
Specialization |
RCA |
Specialization |
RCA |
|
Novgorod Region |
|||
|
Nitrogen fertilizers |
49.54 |
Sawn timber |
3.19 |
|
Complex chemical fertilizers |
35.65 |
Chipboard |
9.41 |
|
Glued plywood |
11.40 |
Fuel wood |
11.63 |
|
Pskov Region |
|||
|
Waste and scrap of ferrous metals |
61.11 |
Ship derrick cranes |
1186.97 |
|
Sawn timber |
13.30 |
Milk whey |
1727.55 |
|
Pork, fresh, chilled or frozen |
739.44 |
Ready-made or canned fish, caviar |
75.89 |
|
Tissue paper |
1643.65 |
Insulated wires |
14.13 |
|
Fillets of fish and other fish meat |
22.40 |
Petroleum gases and gaseous hydrocarbons |
6.25 |
|
Fuel wood |
26.35 |
Copper wire |
3.42 |
|
Food by-products of animal origin |
910.46 |
Lumber in the form of profiled mouldings |
52.04 |
|
Unprocessed timber |
10.38 |
Furniture and its parts |
23.85 |
|
Saint Petersburg |
|||
|
Oil and petroleum products |
2.40 |
Ferrous metal waste and scrap |
6.59 |
|
Crude oil and crude oil products |
1.49 |
Cruise ships, sightseeing, ferries, cargo ships |
9.37 |
|
Gold, unprocessed or semi-processed |
16.39 |
Light motor vehicles |
4.83 |
|
Source: own calculation based on Federal Customs Service data. |
|||
Russian Federation. Goods with the highest values, on the contrary, are exported to a lesser extent or are not exported by other regions, which indicates the uniqueness and high importance of exports of these goods for the economy of such regions.
The list of export priorities we have obtained has common features and differences as compared to similar lists presented in other studies. Thus, the work (Lukin, 2023) contains a list of market specializations of the economy of NWFD regions for 2021; it was formed on the basis of the size of the specialization coefficient for various types of activities for each region of the district. The list in Table 1 differs from it by the fact that the number of export specializations includes more wood products, fish and crustaceans, products of the chemical and extractive industries, while freight and passenger transport, livestock products are represented more narrowly. The study (Rumyantsev, 2023) also identifies the current and prospective market specializations of the Northwest regions. In the current specializations for most constituent entities of the district, in comparison with the list we obtained, there are fewer types of economic activities related to fishing and processing of fish, crustaceans and shellfish, manufacturing of chemical industry products, including fertilizers; however, as in the previous case, the specialization includes more industries for the production of vehicles and various equipment. Promising specializations are also focused more on the manufacture of machinery and equipment, ferrous metal products, wood, chemical products, etc.
We evaluated the commodity structure of the products in the compiled list. The commodity groups are defined in accordance with Form 2-TS of the statistical reporting of the federal customs administrations ( Tab. 3 ).
Based on the data presented in Table 3, we can say that the Leningrad and Pskov regions are characterized by the most diversified exports, goods with the identified advantage of which are combined into the maximum number of groups, namely five. The products of the four groups are represented in the Komi and Karelia republics, as well as in the Vologda Region. The Arkhangelsk and Novgorod regions are characterized by the least diversified exports (two commodity groups in each).
The most widely represented among the goods of export specialization of the Northwestern Federal
Table 3. Distribution of goods in the export of which NWFD regions have the identified comparative advantages by commodity groups, units
|
Commodity group |
S’ ОС .55 "aS го ^ |
S’ ОС Ё |
ОС CD ro JZ |
a? DC ro |
DC |
a? DC |
DC 00 ro E 1 |
DC Z |
a? DC |
00 CD О "ro co |
Total |
|
Food products and agricultural raw materials (except textiles) |
2 |
- |
3 |
- |
1 |
1 |
3 |
- |
5 |
- |
15 |
|
Mineral products |
1 |
- |
- |
1 |
- |
- |
3 |
- |
- |
- |
5 |
|
Fuel and energy products |
- |
1 |
- |
- |
- |
2 |
- |
- |
1 |
2 |
6 |
|
Chemical industry products, rubber |
- |
1 |
- |
2 |
- |
4 |
- |
2 |
- |
- |
9 |
|
Wood and pulp and paper products |
8 |
7 |
7 |
3 |
- |
2 |
- |
4 |
5 |
- |
36 |
|
Textiles, textiles and footwear |
- |
1 |
- |
- |
- |
- |
- |
- |
- |
- |
1 |
|
Metals and products made from them |
- |
- |
- |
6 |
1 |
2 |
5 |
- |
2 |
1 |
17 |
|
Machinery, equipment and vehicles |
1 |
- |
- |
- |
1 |
- |
- |
- |
2 |
2 |
6 |
|
Source: own compilation. |
District are those that belong to the timber industry complex (TIC), they account for 36.7% of the total number of goods. The second position is occupied by the group of metal products (17.3%), the third is food and agricultural products (15.3%). Exports of textiles and mineral products by NWFD regions are the lowest: 1 and 5.1%, respectively. In addition, such a group as “raw leather, furs and products made from them” is completely absent.
Commodity items excluded from the list of goods of export specialization due to the small volume of their sales are also an object of research interest. Despite their small contribution to the total volume of regions’ exports, they play an important role in the economy and have the potential for development. The most significant of them were identified as promising microspecializations. They were identified in two ways: by assessing all-Russian exports of goods, and by assessing the markets of developing countries friendly to Russia. In the framework of the first method we allocated those goods, in the export of which Russia occupies a leading position in the world. Using the information provided in the Trade Map database2, through a comparison of commodity nomenclature, we identified those items, in the volume of supplies of which the share of the Russian Federation in 2021 was at least 1%. Then the resulting list was correlated with the list of goods exported by NWFD regions, which are characterized by an RCA index value of at least one. By excluding items already included in the list of goods with identified comparative advantages, we obtained a list of microspecializations of NWFD regions (Tab. 4).
The presented list is concise, because the number of goods is large. The items in this list were also combined into commodity groups similar to those indicated in Table 2, which make it possible to assess the structure of the obtained microspecializations ( Tab. 5 ).
The most diversified structure is found in Saint Petersburg, where all ten commodity groups are represented. The second place is occupied by the Leningrad Region (seven groups), followed by the Vologda Region (six groups). The minimum is observed in the Pskov Region – only one commodity group. In general, in the Northwestern Federal District, the most widely represented goods are those related to TIC (29.2%), as well as to the group of food products (22.6%), the least represented goods are fuel and energy products (0.9%) and leather raw materials (2.8%).
Table 4. Goods of export microspecializations of NWFD regions obtained as a result of the assessment of all-Russian exports
|
Region |
Microspecializations |
|
Karelia Republic |
Tallow oil; explosives other than gunpowder; grain of cereals other than rice, grain germs of cereals; uncoated paper and cardboard |
|
Komi Republic |
Tallow oil; uncoated paper and cardboard; chipboard with oriented chips; fiberboard, fuelwood |
|
Arkhangelsk Region |
Tallow oil; lumber in the form of profiled mouldings |
|
Vologda Region |
Alloy steel wire; matches; iron wire; calcium and aluminum phosphates; carpentry and joinery; uncoated paper and cardboard; chipboard with oriented chips; lumber in the form of profiled mouldings; other rods; flat rolled; untreated lead; bread, flour and confectionery; bottles; fiberboard |
|
Kaliningrad Region |
Fur raw materials; fishing vessels and floating bases; fuel wood; leguminous vegetables |
|
Leningrad Region |
Wood pulp; extracts, essences and concentrates of coffee and tea; cotton wool and products made from it; bottles; wallpaper; linoleum; fuel wood; carbonates; untreated lead; uncoated paper and cardboard; harness of artificial threads; tall oil; parts of railway locomotives; lumber in the form of profiled mouldings; metal structures made of ferrous metals, etc. |
|
Murmansk Region |
Nickel powders and flakes; niobium, tantalum, vanadium or zirconium ores and concentrates; aluminum wire |
|
Novgorod Region |
Refractory ceramic building materials; sawn timber in the form of profiled mouldings; linoleum; cereals, coarse flour; uncoated paper and cardboard |
|
Pskov Region |
Ambergris, castoreum, civet and musk; rapeseed or colza seeds |
|
Saint Petersburg |
Hydraulic turbines, water wheels; fur and fur raw materials; matches; cotton wool and products made from it; tea; razors and blades for them; bodies for motor vehicles; sulfur; other industrially manufactured tobacco; carpentry and joinery; newsprint; shaving products, deodorants; copper wire; chipboard with oriented chips; steam turbines; glued plywood, etc. |
|
Source: own compilation. |
|
Table 5. The number of microspecializations of NWFD regions obtained as a result of the assessment of all-Russian exports, by commodity group, units
|
Commodity group |
ОС СП "о СП |
S’ ОС Ё |
а? ОС сл cd S -С |
S5 ОС СП |
ОС "ей |
ос |
ОС ел Е 1 |
а? ОС |
ОС |
CD ш 'ей СО |
Total |
|
Food products and agricultural raw materials (except textiles) |
2 |
- |
- |
1 |
1 |
3 |
- |
1 |
2 |
14 |
24 |
|
Mineral products |
- |
- |
- |
1 |
- |
- |
1 |
- |
- |
1 |
3 |
|
Fuel and energy products |
- |
- |
- |
- |
- |
- |
- |
- |
- |
1 |
1 |
|
Chemical industry products, rubber |
2 |
1 |
1 |
1 |
- |
3 |
- |
- |
- |
7 |
15 |
|
Raw leather, furs and products made from them |
- |
- |
- |
- |
1 |
- |
- |
- |
- |
1 |
2 |
|
Wood and pulp and paper products |
1 |
4 |
1 |
5 |
1 |
8 |
- |
2 |
- |
9 |
31 |
|
Textiles, textiles and footwear |
- |
- |
- |
- |
- |
3 |
- |
1 |
- |
2 |
6 |
|
Metals and products made from them |
- |
- |
- |
5 |
- |
1 |
2 |
- |
- |
5 |
13 |
|
Machinery, equipment and vehicles |
- |
- |
- |
- |
1 |
1 |
- |
- |
- |
3 |
5 |
|
Other products |
- |
- |
- |
1 |
- |
3 |
- |
1 |
- |
1 |
6 |
|
Total |
5 |
5 |
2 |
14 |
4 |
22 |
3 |
5 |
2 |
44 |
106 |
|
Source: own compilation. |
In the framework of the second method, we assessed the goods supplied to the markets of developing countries3. The choice of this category of trading partners is due to the high potential for the development of their economies, as well as the growing volume of their trade with Russia from year to year, including due to sanctions restrictions. NWFD regions are also increasing economic cooperation with developing countries, and the authorities express their intentions to maintain and strengthen established ties4. In this context, we studied trade with those countries that are among the developing countries based on the corresponding MSCI5 index, as well as among friendly countries6. For each region of the Northwestern Federal District we have identified the goods exported to these countries in the largest volume. The commodity items not included in the previous two lists were included in the list of promising microspecializations (Tab. 6, 7).
Table 6. Goods of export microspecializations of NWFD regions obtained as a result of assessing the markets of developing countries
|
Region |
Мicrospecializations |
|
Karelia Republic |
Frozen fruits and nuts; liquid dosing machines; processed slate; turpentine; veneer; rosin; aluminum products; low voltage protection equipment; air pumps; electric filament; audible alarm; rubber |
|
Komi Republic |
Cellulose; X-ray equipment |
|
Arkhangelsk Region |
Crude oil; profiled wood; scrap metal recycling vessels; electric transformers; valves; low pressure protection equipment; computers; steam turbines; motors; gearboxes; insulated wires; compasses; copper and iron products; raw bones |
|
Vologda Region |
Liquid crystal displays; computers; cellulose; veneer; refined copper; flour and pellets for animals; ice cream; various measuring instruments; accessories; vegetable parchment; fish oil; cars; tractors |
|
Kaliningrad Region |
Soybean oil; rapeseed oil; raw amber; frozen cattle meat; polymer containers; rapeseed seeds; copper alloys; pipes, tubes and hollow profiles; chains of ferrous metals; containers for compressed or liquefied gas; cutlery; soybean meal; sunflower meal; soy protein concentrate |
|
Leningrad Region |
Refined copper; flat rolled steel; iron products; veneer; sulfate chemical wood pulp; poultry meat; fittings; iron pipes; aluminum cans; kaolin cardboard; pumps for pumping liquids; engines; coal briquettes; binders for foundry; washing and filling machines; gas turbines, etc. |
|
Murmansk Region |
Scrap iron; semi-finished cast iron; fittings for iron pipes; passenger and cargo ships |
|
Novgorod Region |
Dental equipment; glass fibers; kraft paper; electric motors; aluminum products; cobalt; profiled wood; processed crustaceans; brooms; margarine; untreated plastic film |
|
Pskov Region |
Peat; electric soldering equipment; power supply equipment; semiconductor devices; brooms; plastic scrap; high-voltage protective equipment; milling stones; earthmoving equipment; iron chains; rubber pipes |
|
Saint Petersburg |
Refined copper; untreated aluminum; aluminum coating; wooden boxes; veneer; wooden kitchen utensils; uncoated paper; buckwheat; electric furnaces; electric soldering equipment; electric motors; bran; poultry meat; thermostats; synthetic rubber; liquid dosing machines; large construction machines; electric transformers; insulated wires, etc. |
|
Source: own compilation. |
|
Table 7. Number of microspecializations of NWFD regions obtained as a result of assessing the markets of developing countries, by commodity group, units
|
Commodity group |
S’ ОС .55 "aS 03 |
S’ ОС Ё |
DC CD JZ |
a? DC оз |
DC "оз |
a? DC |
DC CO 03 E 1 |
DC Z |
S’ DC "co |
CO CD CD co |
Total |
|
Food products and agricultural raw materials (except textiles) |
1 |
- |
1 |
4 |
7 |
1 |
- |
2 |
- |
5 |
21 |
|
Mineral products |
- |
- |
- |
- |
1 |
- |
- |
- |
1 |
- |
2 |
|
Fuel and energy products |
- |
- |
1 |
- |
- |
1 |
- |
1 |
- |
- |
3 |
|
Chemical industry products, rubber |
3 |
- |
- |
- |
1 |
3 |
- |
1 |
2 |
7 |
17 |
|
Wood and pulp and paper products |
1 |
1 |
1 |
2 |
- |
3 |
- |
2 |
- |
4 |
14 |
|
Metals and products made from them |
2 |
- |
1 |
1 |
3 |
5 |
3 |
1 |
1 |
4 |
21 |
|
Machinery, equipment and vehicles |
4 |
1 |
10 |
5 |
1 |
8 |
1 |
2 |
5 |
16 |
53 |
|
Other products |
1 |
- |
- |
1 |
1 |
1 |
- |
2 |
2 |
2 |
10 |
|
Total |
12 |
2 |
14 |
13 |
14 |
22 |
4 |
11 |
11 |
38 |
141 |
|
Source: own compilation. |
The list formed in this way is characterized by the predominance of groups of goods with greater technical and technological complexity of manufacture, a high degree of processing. Thus, a significant share (37.6%) is occupied by goods belonging to the category of machinery and equipment, which is the maximum among all three lists compiled in the course of the research. The second and third places with the same number of goods are shared by metal products and food products (14.9% each). TIC is losing its leading position here, taking only the fifth place (9.9% of the total number of goods). The smallest shares still fall on mineral products (1.4%) and fuel and energy products (2.1%). Also, the commodity structure of the list obtained with the help of this method is characterized by the largest number of commodity groups for each region; that is, export microspecializations are the most diversified. Thus, there is an average of 5.1 product groups per subject, while in the framework of the first method of searching for microspecializations, the value is 4.1, and in export specializations – 3.8.
Conclusion
Thus, within the framework of the concept of economic complexity, we have identified the goods that make up the export specializations of NWFD regions. Using the RCA index of identified comparative advantages and by assessing the contribution of commodity items to the total volume of exports, we have compiled a list that included 98 items. The Pskov and Vologda regions and the Karelia Republic are characterized by the largest number of goods; the Kaliningrad Region and Saint Petersburg – the smallest. At the same time, the Leningrad and Pskov regions are characterized by the most diversified exports, while the Arkhangelsk and Novgorod regions – the least diversified exports. The main export specializations of the Northwestern Federal District regions are TIC products, metal products, as well as food and agricultural products.
The study revealed microspecializations of NWFD regions. By evaluating the most significant goods in the all-Russian export and studying the products supplied to the markets of developing countries, we have compiled two lists. The largest number of commodity items in the lists is observed in Saint Petersburg and the Leningrad Region, the smallest – in the Murmansk Region and the Komi Republic. In the sectoral structure, in addition to the goods related to TIC and food products indicated in the main export specialization, the commodity positions of the group of machinery and equipment, chemical industry products and metal products are of great importance. High-value goods mainly belong to the group of machinery and equipment. Examples of specific products are transport and cargo ships, X-ray equipment, turbines, motors, protective equipment, air pumps, measuring instruments, household appliances, etc. Among the selected groups of goods in all the export specializations and microspecializations, mineral products, fuel and energy products, leather raw materials, furs and products made from them are the least common. This indicates the high potential for the supply of goods of deep processing by NWFD regions, the possibility of obtaining benefits from increasing their production volumes and supplies to the international market.
It is difficult to develop the export specializations we have identified, as well as to overcome the economic downturn in industries affected by the imposition of sanctions, if there is no proper support on the part of the state. It is advisable to take the following set of measures aimed at increasing export volumes:
-
– setting special tariffs for the export of goods, which we have designated, to friendly countries;
-
– preferential lending to organizations, as well as the issuance of state guarantees for regional exporters and foreign buyers of these goods;
-
– issuing licenses and granting organizations special export rights;
-
– development of international transport and logistics infrastructure;
-
– providing information and advisory assistance to entrepreneurs, especially small and medium-sized businesses, by special bodies such as business incubators;
-
– providing support in the promotion of regional producers, including through participation in international exhibitions and fairs;
-
– facilitating the integration of enterprises into interregional and global supply chains of export goods;
-
– forming a system of effective interaction between business representatives and public authorities, protecting the interests of entrepreneurship (Arkhipova, 2020; Uskova et al., 2020).
According to the data of the previously mentioned survey (Shirokova, Lukin, 2023), heads of industrial enterprises say that the most effective measures of state support are low-interest investment loans and reimbursement of part of the costs. In their opinion, the development of the manufacturing sector requires simplification of the taxation system, general reduction in the amount of taxes on producers, limiting the growth of prices for fuel, energy and transport services, reducing the level of bureaucratic burden, creating conditions for the growth of effective demand, etc.
The novelty of our research lies in fact that we determine goods of export specialization in NWFD regions with the help of the concept of economic complexity. Practical significance lies in the possibility of using its results by regional authorities in the development of strategic documents to substantiate economic policy in the search for promising economic specializations and market niches. The prospects for further research are related to the calculation of the indices of economic complexity for NWFD regions, and substantiation of directions for the transformation of export baskets.
References Characterizing export specialization of northwestern federal district regions within the framework of the economic complexity concept
- Afanasiev M.Yu., Kudrov A.V. (2021). Economic complexity and embedding of regional economies’ structures. Ekonomika i matematicheskie metody, 57(3), 67–78. DOI: 10.31857/S042473880016410-0 (in Russian).
- Arkhipova V.A. (2020). Implementation of state export support in the Russian Federation. Innovatsionnoe razvitie ekonomiki=Innovative Development of Economy, 4-5(58-59), 67–77 (in Russian).
- Balassa B. (1965). Trade liberalisation and “revealed” comparative advantage. The Manchester School, 33, 99–123. Available at: http://dx.doi.org/1-.1111/j.1467-9957.1965.tb---5-.x
- Baranov S.V., Skufina T.P. (2018). Opportunities to promote economic growth in Russia at a rate not lower than the world average. Ekonomicheskie i sotsial'nye peremeny: fakty, tendentsii, prognoz=Economic and Social Changes: Facts, Trends, Forecast,11(5), 49–60. DOI: 10.15838/esc.2018.5.59.3 (in Russian).
- Barsukov D.P., Karaeva F.E., Shogenova I.B. (2019). Organizational and economic aspects of region development in the clustering conditions. Peterburgskii ekonomicheskii zhurnal, 1, 57–71 (in Russian).
- Belov A.V. (2012). On spatial distribution of production factors in contemporary Russia. Prostranstvennaya ekonomika=Spatial Economics, 2, 9–28 (in Russian).
- Devereux M., Griffith R., Simpson H. (1999). The geographic distribution of production activity in the UK. IFS Working Paper 26/99. London: Institute for Fiscal Studies.
- Fracasso A., Marzetti G.V. (2018). Estimating dynamic localization economies: The inadvertent success of the specialization index and the location quotient. Regional Studies, 52, 119–132.
- Gulin K.A., Yakushev N.O., Mazilov E.A. (2018). Promoting economic growth in regions of the Russian Federation by boosting the development of non-resource-based exports. Ekonomicheskie i sotsial'nye peremeny: fakty, tendentsii, prognoz=Economic and Social Changes: Facts, Trends, Forecast, 11(3), 57–70. DOI: 10.15838/esc.2018.3.57.4 (in Russian).
- Hausmann R., Klinger B. (2006). Structural transformation and patterns of comparative advantage in the product space. Ricardo Hausmann and Bailey Klinger CID Working Paper, 128.
- Hidalgo C.A., Klinger B., Barabási A., Hausmann R. (2007). The product space conditions the development of nations. Science, 317, 482–487.
- Hoover E.M. (1936) The measurement of industrial localization. The Review of Economic Statistics, 18, 4, 162–171.
- Ketels C., Protsiv S. (2014). Methodology and Findings Report for a Cluster Mapping of Related Sectors. Stockholm: Stockholm School of Economics.
- Kolmakov V.V., Polyakova A.G., Karpova S.V., Golovina A.N. (2019). Cluster development based on competitive specialization of regions. Ekonomika regiona=Economy of Region, 15(1), 270–284. DOI: 10.17059/2019-1-21 (in Russian).
- Kopczewska K., Churski P., Ochojski A., Polko A. (2017). Measuring Regional Specialisation: A New Approach. Cham, Switzerland: Palgrave Macmillan. DOI: 10.1007/978-3-319-51505-2
- Koptseva E., Salimonenko E. (2020). Current trends in Russian exports and its focus on non-commodity goods. Economics. Law. Innovations, 4, 25–33.
- Kotov A.V., Grishina I.V., Polynev A.O. (2019). Umnaya spetsializatsiya regiona – variant resheniya dlya Rossii: nauchnyi ocherk [Smart Specialization of the Region – a Solution for Russia: Scientific Essay]. Moscow: Vserossiiskaya akademiya vneshnei torgovli Ministerstva ekonomicheskogo razvitiya Rossiiskoi Federatsii.
- Kudrov A.V. (2023). The impact of economic complexity and industry specialization on the gross regional product of Russian regions. Biznes-informatika=Business Informatics, 17(4), 25–40. DOI: 10.17323/2587-814X.2023.4.25.40 (in Russian).
- Kutsenko E., Eferin Y. (2019). “Whirlpools” and “safe harbors” in the dynamics of industrial specialization in Russian regions. Foresight and STI Governance, 13(3), 24–40. DOI: 10.17323/2500- 2597.2019.3.24.40
- Kutsenko E.S., Abashkin V.L., Islankina E.A. (2019). Focusing regional industrial policy via sectorial specialization. Voprosy ekonomiki, 5, 65–89. DOI: 10.32609/0042-8736-2019-5-65-89 (in Russian).
- Lukin E.V. (2023). The economy of Northwest Russia: In search of prospective specialization. EKO=ECO, 8(590), 8–34. DOI: 10.30680/ECO0131-7652-2023-8-8-34 (in Russian).
- Lukin E.V., Uskova T.V. (2018). Structural transformation issues in regional economy. Ekonomicheskie i sotsial'nye peremeny: fakty, tendentsii, prognoz-Economic and Social Changes: Facts, Trends, Forecast, 11(6), 26–40. DOI: 10.15838/ esc.2018.6.60.2 (in Russian).
- Lyubimov I.L., Gvozdeva M.A., Kazakova M.V., Nesterova K.V. (2017). Economic complexity of Russian regions and their potential to diversify. Zhurnal Novoi ekonomicheskoi assotsiatsii=Journal of the New Economic Association, 2(34), 94–123. DOI: 10.31737/2221-2264-2017-34-2-4 (In Russian).
- Prokopyev E.A. (2015). To the issue on data selection for regional specialization identification. Drukerovskij vestnik, 2, 236–245 (in Russian).
- Rumyantsev N.M. (2023). Promising economic specializations within a macroregion (the case of the Northwestern Federal District). Ekonomicheskie i sotsial'nye peremeny: fakty, tendentsii, prognoz=Economic and Social Changes: Facts, Trends, Forecast, 16(6), 74–90. DOI: 10.15838/esc.2023.6.90.4 (in Russian).
- Rumyantsev N.M., Leonidova E.G., Gubanova E.S. (2022). Defining sectoral priorities of the region’s structural transformation by searching for promising economic specializations. Ekonomicheskie i sotsial'nye peremeny: fakty, tendentsii, prognoz=Economic and Social Changes: Facts, Trends, Forecast, 15(6), 94–109. DOI: 10.15838/esc.2022.6.84.5 (in Russian).
- Shirokova E.Yu., Lukin E.V. (2023). Functioning of manufacturing sector of the north-west Russian economy in 2022–2023: Expectations and reality. Problemy razvitiya territorii=Problems of Territory's Development, 27(6), 44–63. DOI: 10.15838/ptd.2023.6.128.4 (in Russian).
- Simachev Yu., Kuzyk M., Kuznetsov B., Pogrebnyak E. (2014). Russia on the path towards a new technology industrial policy: Exciting prospects and fatal traps. Forsait=Foresight-Russia, 8(4), 6–23 (in Russian).
- Tacchella A., Cristelli M., Caldarelli G., Gabrielli A., Pietronero L. (2012). A new metrics for countries’ fitness and products’ complexity, Sci Rep, 2, 723.
- Uskova T.V., Lukin E.V., Leonidova E.G. et al. (2020). Strukturnaya transformatsiya regional'noi ekonomiki [Structural Transformation of the Regional Economy]. Vologda: Vologodskii nauchnyi tsentr Rossiiskoi akademii nauk.
