China's interests in the industrialization of the South Caucasus: comparative analysis of labor productivity in the manufacturing sector

Author: Niftiyev Ibrahim
Journal: Economic and Social Changes: Facts, Trends, Forecast @volnc-esc-en
Section: Global experience
Article in issue: 2 т.15, 2022.
Free access
Due to their strategic location and relatively developed economies, the three countries of the South Caucasus, namely Azerbaijan, Armenia, and Georgia, have cooperated with China since 2015 to leverage their economic growth. China has significantly invested in these countries to boost their productive capacity and integrate them into China-centered global value chains. However, are these countries ready to launch into cooperation with advanced economic powers such as China? To address this question, the current paper integrates overall trends in aggregate and sectoral productivity to evaluate the readiness of the South Caucasus for a new phase of industrialization using Chinese investments and projects as new and important developments in the region’s economic life. Overall, the results indicate a downward trend in manufacturing value added in the South Caucasian economies. While lagging trends raise concerns, Chinese foreign directed investment may resolve issues related to incomplete capacity utilization in the South Caucasus through infrastructure investments. In contrast to the existing literature on China’s economic presence in the South Caucasus, this paper examines Azerbaijan, Armenia, and Georgia in both intraregional and interregional terms by comparing them to the Visegrad and Baltic countries, respectively. This approach enables the South Caucasian countries to be situated in the context of Chinese foreign direct investments influx, as the South Caucasus shares a similar history and prospects with the Baltic countries and the Visegrad countries, respectively. The results of a one-sample t-test indicate that, on average, capital deepening and aggregate labor productivity are higher in the South Caucasus than in the Visegrad and Baltic regions. However, manufacturing labor productivity was significantly lower in the South Caucasus than in the benchmark regions. Moreover, the estimated effect sizes at the sectoral level - as measured through eta squared - illustrated the strength of the obtained differences. These findings document the need for improved economic reforms and policies to keep pace with the regions that are driven by foreign direct investments and that have successfully integrated into global value chains. Otherwise, China-led economic development may fail to industrialize the South Caucasus, misguiding the respective parties’ beliefs and expectations. Thus, further research is needed alongside specific sectoral policy strategies to document country- or region-specific challenges related to the increase in Chinese projects and foreign direct investments in the South Caucasus.
South caucasus, azerbaijani economy, armenian economy, georgian economy, manufacturing labor productivity, south caucasian industrialization, belt and road initiative
Short address: https://sciup.org/147238040
IDR: 147238040 | UDC: 338.4 | DOI: 10.15838/esc.2022.2.80.13
Text of the scientific article China's interests in the industrialization of the South Caucasus: comparative analysis of labor productivity in the manufacturing sector
China has successfully integrated into the global economy by implementing gradual market reforms that have enabled it to overcome the flaws of the socialist system and shock therapy since the late 1980s (Weber, 2021). In addition, like advanced industrial nations, China has shifted its exports from labor-intensive products to high-tech products, becoming a valuable part of global production networks (Athukorala, 2017). As one of the fastest-growing economies, China has spent its accumulated wealth on investments. One of the destinations for Chinese foreign direct investments (FDI) is the South Caucasus region, where projects such as the New Silk Road (NSR) and the Belt and Road Initiative (BRI) aim to increase trade and boost infrastructure. However, is the South Caucasus worth investing in?
The main reason why China is interested in the South Caucasus is the fact that the corridor between Central Asia and Western Asia passes across countries such as Azerbaijan and Georgia (Ismailov, Papava, 2018). China offers considerable investments to these countries in return for their cooperation; in turn, South Caucasus countries see China as a reliable economic partner. Indeed, Chinese investments can be very beneficial. Zhai documented these benefits both along and beyond BRI routes, which include USD 1.6 trillion global in welfare gains (accounting for 1.3% of worldwide Gross Domestic Product – GDP); however, nonBRI countries demonstrated fewer improvements in bilateral trade (Zhai, 2018). In addition, Jain argued that China’s increasing trade with countries that lie alongside BRI routes indicates that it seeks alternative trading partners due to the recent trade war between China and the United States (Jain, 2020). Such developments in the world economy because of Chinese economic projects urge regularly to study China-related projects at the country and regional levels. However, high-quality work remains scarce despite a steady increase in journal articles, conferences, and books about the BRI (Blanchard, 2021).
The intellectual realization of manufacturing’s comparative labor productivity in the South Caucasus is unclear among the internationally published literature examples. This aspect of the region’s economy becomes more significant when a foreign partner such as China makes export-oriented industrial production plans related to the South Caucasus. Accordingly, this paper’s main research questions are as follows. First, how might the South Caucasus countries—namely, Azerbaijan, Georgia, and Armenia—benefit from Chinese projects that aim to increase industrialization? Do the South Caucasus countries demonstrate a statistically significant difference with comparable regions (i.e., the Visegrad and Baltic countries) in terms of aggregate and manufacturing productivity? A research paper that focuses on manufacturing labor productivity in the South Caucasus to the author’s best knowledge does not yet exist in the literature. A comparative perspective to establish the region’s economic potential in the face of increasing Chinese investments and projects increase the actuality of the topic. Therefore, the present study aims to outline China’ s increasing economic initiatives in the South Caucasus to evaluate labor productivity trends and compare them with other post-Soviet and post-socialist regions to conceptualize the region’s prospects in the face of increasing Chinese involvement in the region.
To address the abovementioned research questions, this paper examines trends and patterns in industrial activity and aggregate and sectoral productivity in the manufacturing sector in the South Caucasus countries. Moreover, figures are analyzed to make intraregional and interregional comparisons. Lastly, for policy considerations, a one-sample t -test provides preliminary statistical evidence of differences between the South Caucus and the European regions such as Visegrad and Baltic countries.
It was found that Azerbaijan may benefit from Chinese investments to boost its fading non-oil manufacturing sector. Georgia focuses on the advancement of transportation and logistics to meet the Chinese demands in the collaboration between East and West. Meanwhile, Armenia may be indirectly involved in projects such as the BRI due to its challenging geographic location. Moreover, the aggregate productivity of the South
Caucasus is significantly lower than that of Visegrad countries, while it is higher than that of Baltic countries. However, the sectoral labor productivity of the manufacturing sector in the South Caucus is significantly lower than in either of the other regions. Therefore, the South Caucasus has much to learn from the FDI recipient countries of the Visegrad region and the service-led growth of the Baltic region.
Although several papers tried to analyze the South Caucasus economies both as a region and separately, still there was no comparative statistical analysis of the labor productivity in the South Caucasus. Such an analysis would be a vital contribution to the current understanding of the region, as the region always is a hot spot for geopolitical, political and economic developments. The growing involvement of China increases a necessity to examine the region’s economy further. Therefore, the study contributes to the limited literature on the subject, also pinpointing significant discrepancies in manufacturing of the South Caucasus in terms of their labor productivity via a well-known statistical examination instrument— one-sample t -test.
China’s interests in the South Caucasus
After the collapse of the Soviet Union in 1991, the South Caucasus consisted of three independent countries: Azerbaijan, Armenia, and Georgia. The region became politically unstable, economically and institutionally dysfunctional, and rife with inter-ethnic conflict during the first half of the 1990s (Nixey, 2010). In addition, throughout the early 1990s, a lack of economic and political integrity impeded solutions to chronic poverty, isolation, and majority-minority issues (Waal, 2012). However, the South Caucasus overcame extreme poverty in the beginning of the transition period until the end of the first decade of the 2000s (Aristei, Perugini, 2012).
Economic projects such as the Baku-Tbilisi-Ceyhan (BTC) oil pipeline and the Baku-Tbilisi-Erzurum (BTE) gas pipeline integrated Azerbaijan, Georgia, and Turkey, streamlining foreign exchange within a short period (Cornell, Ismailzade, 2005). Although all these intense developments rapidly took place, still the South Caucasus took a stand against economic challenges (e.g., low income and de-industrialization) after the transition period, and China-led growth promised attractive outcomes for the failed trials of economic catch-up of the regional countries. Along with economic prosperity, the South Caucasus presented an attractive set of economic opportunities due to its optimal position as a transit hub between the East, West, and the Middle East. Thus, China’s interest in the South Caucasus was based on the region’s exportenhancing infrastructure, optimal location, and the political propensity of domestic elites to diversify international trade partners.
From China’s perspective, one of the main tools of integration with the West was the BRI. The latter encompasses two sub-projects: the Silk Road Economic Belt (SREB) and the 21st-century Maritime Silk Road Initiative (MSRI) (Ge, 2016). As the BRI covered the regions of Asia Pacific, Europe, and Central Asia, the revival of ancient trade routes in the form of modern economic integration and deep multilateral partnerships promised new horizons for member countries, especially post-transition and post-Soviet emerging economies (Ge, 2016). The influx of Chinese FDI into the South Caucasus signaled infrastructure development among the developing post-Soviet countries, which would allow them decrease their dependency on Russia and other major global powers (e.g., the United States and the European Union). However, there were concerns that these countries would fall into a new dependency by becoming “satellite countries” for China to fulfill its demand for raw materials and transportation. On the one hand, China’s investments in natural resource extraction, agriculture, transportation, and communication filled gaps within the recipient countries; on the other hand, post-Soviet countries were incorporated into China-centered development plans through projects such as the BRI and the MSRI.
China significantly invested in infrastructure and trade facilitation to fuel domestic cohesion and development among the BRI’s participating countries. According to Schneider, the main reason for this was to emulate the early developmental stages of the large capitalist powers (Schneider, 2021). In the same way that telegraph lines, railroads, and canals transformed the modern global economy, China aimed to replicate this westernstyle expansion plan in a much more modern way. The South Caucasus countries have already developed their infrastructure capacity to support necessary domestic and international economic activities. Therefore, China’s first steps in the region were exploratory but forthcoming investments might have a bigger scale and more significant ambitions to boost the BRI.
To maximize the benefits of the BRI, partner countries must cooperate with both each other and China to overcome challenges such as a lack of infrastructure, institutional gaps, deficient human capital, and massive need for funding (Zhai, 2018). Moreover, each country’s current capacity may be a barrier to transforming the region into an integrated hub for FDI to become a valuable, functional, and trustworthy point of departure for Chinese exports. Thus, the following sections briefly examine contextual developments related to China’s increased involvement in the South Caucasus.
At the country level, China’s interests in Azerbaijan, Georgia, and Armenia differ. These differences can shed light on the present and future status of the partnership between China and the South Caucasus. Moreover, all three countries share similar challenges in terms of industrial activity and productivity.
Azerbaijan
There are multiple reasons why foreign countries, including China, seek to expand their cooperation with Azerbaijan. For instance, Azerbaijan’s infrastructure presents a rich set of logistical opportunities for East-West partnerships, as the country encompasses six international airports, Baku Cargo Terminal, Alyat Trade Port, Caspian Flotilla, and the Baku-Tbilisi-Kars railroad (Babayev, Ismailzade, 2020). In addition, according to Mammadova, Baku International Sea Port appears to be attractive to Chinese companies that wish to further increase China’s international trade1.
China has also developed deep interests in international projects initiated by Azerbaijan. For example, China’s Asian Infrastructure Investment Bank (AIIB) invested USD 600 million in the TransAnatolian Gas Pipeline (TANAP) and pledges tens of millions in USD to State Oil Company of the Azerbaijan Republic gas processing and petrochemical plants (SOCAR-GPC) (Rolland, 2018).
China’s increasing involvement in the South Caucasus as a main source of FDI, which provides the financial impetus to leverage industrial capacity, has also been widely discussed among local think tanks2. For instance, recent non-oil investments in Azerbaijan included an industrial port in Alyat (USD 1.5 billion), an integrated steel mill in Ganja (USD 1.17 billion), and a tire plant in Sumgait (USD 300 million). Meanwhile, Azerbaijan has also invested USD 1.7 billion in China since 2017. In fact, Azerbaijan’s interest in the Chinese markets led to the creation of the first trading house in 2017, which allowed the direct promotion of goods and the analysis of sales opportunities. The influx of Chinese FDI into Azerbaijan is being evaluated as a new opportunity to diversify the country’s oilbased industrial production3.
Although much has been achieved between Azerbaijan and China, BRI and NSR routes must also be integrated with the Trans-Caspian International Transport Route (TITR) to expand transportation between the East and the West. To achieve this, Azerbaijan must expand its partnership with China by forming intercountry working groups to increase the marginal economic benefits of future cooperation (Babayev, Ismailzade, 2020). In addition, excess unused capital (Hasanli et al., 2021), low productivity (Onder, 2013), and an undiversified economic structure (Ahmadova et al., 2021; Guliyev, 2020) are obstacles to economic well-being and sustainable economic development.
Georgia
Thanks to its favorable geographical position and reformed economy, Georgia is another South Caucasian country that is attractive to foreign investors. Georgia offers a friendly business environment with a low corruption rate, liberal foreign trade, economic freedom, and a strategic position between Asia and Europe (Gigauri, Damenia, 2019).
Georgian authors perceive Chinese involvement in the South Caucasus as a positive development and a new economic prospect. The BRI and the NSR are expected to bring new opportunities to poor regions by creating jobs, attracting investments, establishing new industrial bases, and improving transportation (Gigauri, Damenia, 2019). Gigauri and Damenia view Chinese investments as an opportunity to upgrade the current industrial capabilities of the South Caucasus region by importing advanced technologies to increase competitive advantage (Gigauri, Damenia, 2019).
However, Gambino is more pessimistic about how Chinese investments will alter the balance of power in Georgia (Gambino, 2019). The argument that Georgia is in the center of a geopolitical competition between Russia, Turkey, China, and the European Union because of its transportation capabilities is also supported by van Dijk and Martens (Van Dijk, Martens, 2016). In addition, Kharaishvili et al. highlighted the low technical capacity of Georgian transportation companies, weak legal frameworks, slow institutional regulations, and high shipment rates (Kharaishvili et al., 2021). Moreover, the lack of a government strategy in transportation hinders digitalization and innovation in shipment infrastructure.
Existing studies have voiced particular concerns about labor productivity in the Georgian economy. For instance, Gambino has mentioned the risks that Georgia took on by agreeing to participate in Chinese economic projects (Gambino, 2019). These risks include low labor productivity, the existence of an unskilled and unemployed labor force, undifferentiated exports, and lagging internal infrastructure; as a result, sustainability is endangered in favor of meeting great expectations from both China and other BRI partner countries. Moreover, industrial policies in Georgia have not been sufficiently altered to achieve desired reforms and outcomes (Diakonidze, 2016). Labor markets and new regulations have been reintroduced without major improvements since the collapse of the Soviet Union (Diakonidze, 2016).
Armenia
Due to Armenia’s landlocked position and closed borders with Azerbaijan and Turkey, China’s interests in the country are geopolitical rather than economic. Therefore, Armenia’s participation in the BRI may take place mainly through infrastructure and trade rather than production. Although this significantly limits Armenia’s contributions to Chinese projects such as the BRI and the MSR, it can still be involved via the fast-growing information and communications technology (ICT) sector, which was inherited from the Soviet years (Gigauri, Damenia, 2019). ICT is a crucial part of modern manufacturing production and the rapid transformation of Armenia into a vibrant ICT hub is promising for the integration of Chinese projects into global value chains (GVCs).
Armenia has developed free industrial zones (FIZ), such as the one in Meghri, that could benefit from BRI investments, along with the Meghri – Yerevan – Bavra highway and planned railroad, which will follow the same route. However, as Gambino noted, highway and railroad development are plagued by several logistical challenges (Gambino, 2019). Chinese companies such as Synohidro have already taken part in the finalization of Armenian infrastructure projects, which signals that Armenia’s domestic capacity to complete strategic projects is highly limited.
Like Azerbaijan and Georgia, Armenia’s economy suffers from low productivity levels, inefficiencies, and the suboptimal distribution of economic activities (Hakobjanyan, Yeghiazaryan, 2016). Low productivity limits the country’s major push for industrial activity and improvement of unemployment and poverty (Valerio et al., 2015). Thus, there is a solid expectation to suspect low contribution of the Chinese investments into the overall industrialization process in Armenia as there are natural limits from both the national economy and geographic location of the country.
Data and methodology
Assessing past trends to determine the readiness to China-led industrialization and upcoming dynamics in aggregate and sectoral productivity requires a systematic, critical, and comparative analysis of the South Caucasus countries. The analytical portion of the work includes an examination of explanatory trends through a systematic and comparative figure analysis of manufacturing dynamics – particularly with regard to labor productivity – in the South Caucasus.
The main data source for the current research consists of aggregated and sectoral labor productivity data (manufacturing) from the World Bank’s report on global productivity, which was edited by Dieppe et al. (Dieppe et al., 2020). The data set covers aggregated and sectoral labor productivity levels across a wide range of regions and countries.
However, the World Bank data set does not contain any data on Armenia’s labor productivity, either in real or purchasing power parity (PPP) terms. To obtain relevant time series data, data on the nominal value added of the manufacturing sector was first collected from statistical yearbooks published by the Statistical Committee of the Republic of Armenia4. Then, the nominal value added of the manufacturing sector was converted to current U.S. dollars (the exchange rate was 1 Armenian dram to USD 0.0020, based on data provided by Armenian Central Bank on July 16,
2021)5. To adjust nominal values to real values, the consumer price index (CPI; 2010 = 100%) provided by the World Bank6 was introduced into the calculations by using equation (1). Finally, real labor productivity between 2001 and 2017 was available for Armenia, which allowed for the construction of a regional average to compare each South Caucasus country against.
Real value added in manufacturing =
Nominal value added in manufaturing
= . (1)
CPI / 100
This paper also provides comparisons of productivity between the South Caucasus and the Visegrad and Baltic regions to illuminate possible differences between post-socialist and post-Soviet countries. The Visegrad region includes countries such as Hungary, Poland, the Czech Republic, and Slovakia; it mainly serves as a benchmark. The Visegrad region has promoted FDI inflow, which has made it one of the largest investment recipients (Elteto, Antaloczy, 2017) that the South Caucasus might experience because of Chinese investments. The Baltic region includes Latvia, Lithuania, and Estonia. The Baltic countries were also part of the Soviet Union and now follow a servicesled economic structure (Maksimtsev et al., 2017), which is similar to the South Caucasus. Lastly, the average of the South Caucasus region was also used in the figure analysis of labor productivity in terms of PPP; it is mainly based on data from Azerbaijan and Georgia due to the limited availability of data from Armenia.
The calculated moving averages (MAs) are the last three-year averages between 1997 and 2017. For example, the MA indicated in 2000 contains the average of 1997, 1998, and 1999, while 2001 comprised 1998, 1999, and 2000. The application of MAs enables the regions to be dynamically compared to each other rather than using a static approach. However, the part of the data set related to real labor productivity (RLP) and labor productivity (LP) in terms of PPP for 2001 and 2002 had missing values for Georgia. These were filled in using the Trend function in Google Sheets (an online spreadsheet tool), which predicted the missing values in a linear fashion based on the least squares method (i.e., linear interpolation).
A one sample t -test was used to analyze differences in aggregate and sectoral productivity between the South Caucasus and the Visegrad and Baltic regions. Table 1 reports the descriptive statistics and the results of the normality test
(Shapiro-Wilk) of the variables (the main sample or dependent variable) used in the one-sample t -test. The main sample in the statistical analysis was tested for the variables of interest. Then, the sample was tested against specific test values. The test values were obtained by averaging the variables of interest (e.g., capital deepening and labor productivity growth rate) for either the Visegrad region or the Baltic region. The one-sample t -test was performed using SPSS software, Version 23.0.0.0 for the Mac operation system (Mac OS).
However, it should be noted that only capital deepening, real labor productivity, and labor productivity in terms of PPP fulfilled the main assumptions for the one-sample t -test (Tab. 2) . Nevertheless, results for the other variables also were reported for the sake of comparison. Therefore, any final considerations regarding establishing final regional discrepancies based on the one-sample t -test must be carefully handled.
Table 1. Descriptive statistics for the variables of interest used in the one-sample t-test
|
Variable name |
Min. |
Max. |
Mean |
St. dev. |
Shapiro-Wilk normality test |
|
Capital deepening, % contribution |
-2.84 |
13.92 |
2.24 |
2.90 |
0.974 |
|
Labor productivity (LP), gross domestic product (GDP) per employment, in USD, 2010 prices and exchange rates |
1,799.41 |
12,796.77 |
6,468.28 |
3,435.91 |
0.806*** |
|
Labor productivity growth rate, in % |
-38.36 |
32.86 |
3.67 |
11.56 |
0.874*** |
|
Total factor productivity in log difference, in % |
-51.54 |
24.13 |
0.50 |
12.08 |
0.800*** |
|
Real labor productivity, 2010 constant prices, in thousands (local currency) |
5.17 |
29.36 |
12.89 |
7.06 |
0.958 |
|
Labor productivity, 2011 international purchasing power parity (PPP) exchange rate, in thousands USD |
10.12 |
45.81 |
28.81 |
9.74 |
0.968 |
|
Source: Own compilation. Notes: The numbers were rounded to the second decimal place for concision. The symbols *, **, and *** indicate statistical significance at the 10%, 5%, and 1% levels, respectively. The null hypothesis for the Shapiro-Wilk test covers the normal distribution of the variables. According to the box plot visualizations for the data (not reported here but available upon request), total factor productivity had six outlier values and the labor productivity growth rate had five outlier values. |
|||||
Table 2. Comparison of results against the main assumptions for the one-sample t -test
|
Variable name |
Interval or ratio level |
Independence |
Significant outliers |
Normal distribution |
|
Capital deepening, % contribution |
Yes |
Yes |
No |
Yes |
|
Labor productivity (LP), gross domestic product (GDP) per employment, in USD, 2010 prices and exchange rates |
Yes |
Yes |
No |
No |
|
Labor productivity growth rate, in % |
Yes |
Yes |
No |
No |
|
Total factor productivity in log difference, in % |
Yes |
Yes |
Yes |
No |
|
Real labor productivity, 2010 constant prices, in thousands (local currency) |
Yes |
Yes |
Yes |
Yes |
|
Labor productivity, 2011 international purchasing power parity (PPP) exchange rate, in thousands USD |
Yes |
Yes |
No |
Yes |
|
Source: own elaboration based on general IBM®SPSS® statistics guides. |
||||
Lastly, as argued by Pallant, the effect size of the computed differences must be identified to make more conclusive and meaningful interpretations (Pallant, 2010). Effect size is a standardized and objective measure of observed effect (Gerald, 2018). Although there are various techniques for estimating effect size (e.g., Cohen’s d , Pearson’s correlation coefficient r , and the odds ratio), a more practical one is eta squared (), which can be calculated according to the formula below (He, Lyles, 2008):
, П - 1 , + "72""
where n is the sample size and t is the calculated value of the dependent sample t -test (Gerald, 2018). The effect size can be small (0.01), moderate (0.06), or large (0.14). Overall, it ranges between 0 and 1.
Results
To understand the overall status of the manufacturing sector in the South Caucasus, it is useful to analyze the trend of manufacturing value added. Although Azerbaijan and Georgia demonstrated an increasing trend in manufacturing value added during the transition period (1991–2005), as measured in billions of USD (Fig. 1a), the overall share of manufacturing value added in GDP has weakened since independence (Fig. 1b). In Azerbaijan, the share of manufacturing value added fell from 21.88% in 1992 to 3.99% in 2011; in Georgia, it decreased from 16.9% in 1996 to 7.79% in 2016. Meanwhile, Armenian data shows that, since 2016, the manufacturing value added has increased in both current price levels and as a share of GDP; however, Armenia exhibited the same dynamics as Georgia and Azerbaijan until then.
Table 3 reports aggregate productivity indicators for the South Caucasus region between 1980 and 2018. In terms of capital deepening, the countries experienced noticeable improvements, mainly during the 2005–2009 period. However, Azerbaijan experienced higher capital deepening between 2000 and 2004. Nevertheless, the region’s overall average has decreased since 2010 (to 1.70% from highs of 3.70% and 2.99%), with slight improvements from 2015 to 2018 (1.97%).
Labor productivity in the South Caucasus, as measured in GDP per employment in 2010 constant dollars, reached USD 11,060.56 from 2015 to 2018,
Figure 1. Manufacturing value added in the South Caucasus, 1991–2019
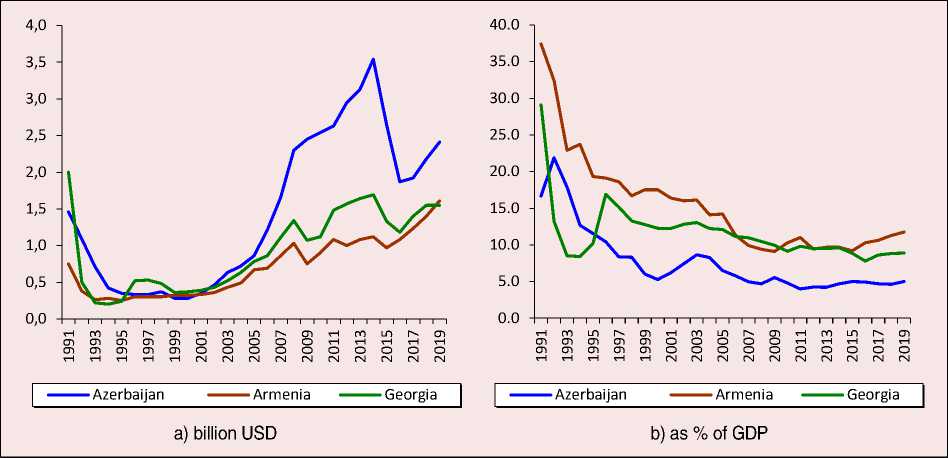
Sources: Economic structure , The Global Economy (2021); World Data Atlas , Knomea (2021).
Table 3. Aggregate productivity indicators for the South Caucasus, 1980–2018
|
1980– 1989 |
1990– 1999 |
2000– 2004 |
20052009 |
2010– 2014 |
2015– 2018 |
||
|
Capital deepening, % contributio n |
AZE |
1.72 |
0.63 |
8.70 |
2.36 |
3.18 |
1.83 |
|
ARM |
1.13 |
1.35 |
2.12 |
4.55 |
1.56 |
1.48 |
|
|
GEO |
2.07 |
1.87 |
0.27 |
2.07 |
0.63 |
2.59 |
|
|
Ave. |
1.64 |
1.28 |
3.70 |
2.99 |
1.79 |
1.97 |
|
|
Labor productivity (LP), gross domestic product (GDP) per employment, in USD, 2010 prices and exchange rates |
AZE |
n.a. |
3,618.45 |
4,117.16 |
7,764.34 |
12,226.62 |
12,004.67 |
|
ARM |
n.a. |
2,505.40 |
4,412.83 |
9,395.68 |
8,791.89 |
11,786.58 |
|
|
GEO |
7,610.30 |
3,750.48 |
4,140.45 |
6,529.44 |
8,135.39 |
9,390.43 |
|
|
Ave. |
n.a. |
3,291.44 |
4,223.48 |
7,896.49 |
9,717.97 |
11,060.56 |
|
|
Labor productivity growth rate, in % |
AZE |
n.a. |
-6.00a |
9.07 |
20.09 |
1.28 |
-1.46 |
|
ARM |
n.a. |
-0.94a |
14.95 |
6.43 |
4.85 |
6.88 |
|
|
GEO |
0.83 |
-5.49 |
5.30 |
7.77 |
4.52 |
3.92 |
|
|
Ave. |
n.a. |
-3.73a |
9.78 |
11.43 |
3.55 |
3.11 |
|
|
Total factor productivity in log difference, in % |
AZE |
n.a. |
-7.43a |
-0.61 |
13.21 |
3.09 |
-2.94 |
|
ARM |
n.a. |
-4.31a |
11.54 |
3.40 |
-2.27 |
4.74 |
|
|
GEO |
n.a. |
-7.30a |
4.21 |
4.40 |
3.38 |
1.14 |
|
|
Ave. |
n.a. |
-6.35a |
5.05 |
7.00 |
1.40 |
0.98 |
Notes: AZE – Azerbaijan, ARM – Armenia, GEO – Georgia. “n.a.” means “not available.” a means that the average for the period starts from 1991. The numbers were rounded to the second decimal place for concision. “ Ave .” denotes the average of the selected periodic indicators for the South Caucasus and was calculated only if data for all three countries was available.
Source: (Dieppe et al., 2020) .
which is 65.9% higher than the average for 1990– 1999 and 40.1% higher than the average from 2005 to 2009 (see Tab. 3). However, the countries demonstrated individual differences. For instance, Azerbaijan is the only country in which labor productivity fell from 2015 to 2018 compared to previous periods, while performance in Armenia and Georgia was more sustainable and gradual. The labor productivity growth rate was negative (-1.46) in Azerbaijan between 2015 and 2018. In addition, the labor productivity growth rate in Georgia slowed down during the same period but recovered in Armenia by 6.88%.
Lastly, although total factor productivity (TFP) in the South Caucasus recovered from the severe damage of the 1990s (-6.35%) and rose to 5.05% and 7% between 2000 and 2004, and 2005 and 2009 respectively, the lowest TFP since the 1990s (0.98%) was observed during the period from 2015 to 2018. At the country level, Azerbaijan and Georgia’s TFP decreased (from 3.09% to -2.94% in Azerbaijan’s case and from 3.38% to -1.13% in Georgia’s case), while Armenia’s TFP increased (from -2.27% to 4.74%) between 2015 and 2018.
World Bank data indicate that Georgia is a leading country in the South Caucasus in terms of manufacturing real labor productivity (RLP) (Fig. 2) . Georgia also exceeds the MAs of both the South Caucasus and Baltic regions between 2001 and 2017. However, this cannot be said for Azerbaijan and Armenia. Although RLP spiked in Azerbaijan in 2006 and reached 13.25 thousand Azerbaijani manat (AZN), it has not exceeded the MAs of the South Caucasus since then. Azerbaijan also performed significantly worse than the Visegrad and Baltic regions. Meanwhile, Armenia’s average per annum of 7.17 thousand Armenian drams (AMD) from 2001 to 2017 was the lowest in the South Caucasus Visegrad, and Baltic regions. Moreover, since 2010, the trend of RLP in the manufacturing sector has mainly been negative in Armenia.
Figure 2. Real labor productivity of the manufacturing sector in the South Caucasus, 2001–2017
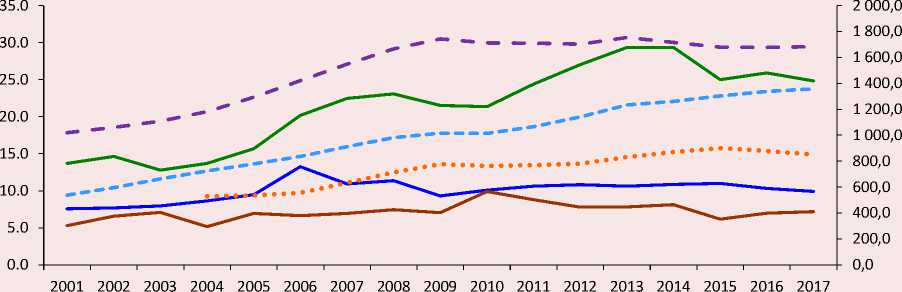
Azerbaijan’s RLP
Armenia’s RLP
Georgia’s RLP
Moving average of the Baltic region’s RLP
Moving average of the South Caucasus region’s RLP
Moving average of the Visegrad region’s RLP (right axis)
Source: (Dieppe et al., 2020).
In terms of purchasing power parity, Azerbaijan’s LP in the manufacturing sector is lower than that of Georgia and the MAs of the Visegrad and Baltic regions (Fig. 3) . Since 2015, Georgia’s LP in terms of PPP has exceeded that of the Baltic region and approached the average of the Visegrad region. It slightly deteriorated in 2016, which translated to a decrease from USD 45.52 thousand to USD 44.51 thousand (2015). Overall, the main trend of LP in manufacturing in terms of PPP was positive in both Azerbaijan and Georgia until 2014 and 2015, respectively. After 2014 to 2015, only Georgia showed recovery in LP that could potentially keep pace with the MAs of Visegrad and Baltic countries.
Surely, not only labor productivity determines the foreign interest to invest in a given country. The historical direction of the overall flow of FDI might provide information about the attractiveness of an economy. Table 4 reports the correlation coefficients based on Kendall’s tau-b methodology (due to the small sample size and non-normal distribution risks, Kendall’s tau-b provides more reliable results compared to Pearson’s r or Spearman’s rho). While there was not a statistically significant correlation in the South Caucasus in terms of their FDI, Armenia’s FDI and Armenia’s RLP, as well as Georgia’s FDI and Georgia’s RLP are statistically significant and positively correlated. Interestingly, Azerbaijan’s FDI and RLP were not statistically significant. These results show that in the South Caucasus besides labor productivity, also overall FDI is a key factor to determine the further FDI, including conceivable Chinese economic interest in the near future.
Figure 3. Labor productivity of the manufacturing sector in the South Caucasus in terms of purchasing power parity, 2001–2017
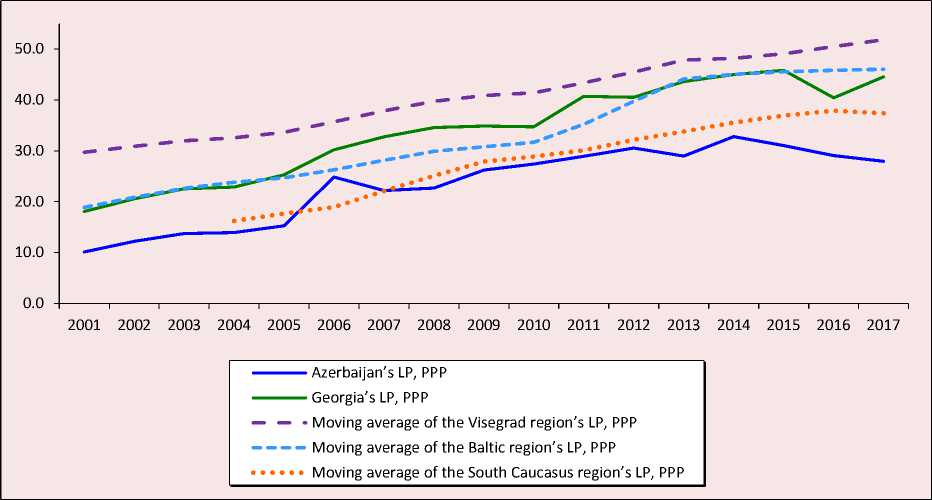
Source: (Dieppe et al., 2020).
Table 4. Kendall’s tau-b correlation coefficients for the South Caucasus countries between FDI and RLP, 2001–2017
|
Azerbaijan’s FDI |
Armenia’s FDI |
Georgia’s FDI |
Azerbaijan’s RLP |
Armenia’s RLP |
Georgia’s RLP |
|
|
Azerbaijan’s FDI |
1.00 |
0.25 |
0.25 |
0.31 |
-0.04 |
0.13 |
|
Armenia’s FDI |
0.25 |
1.00 |
0.29 |
0.50*** |
0.41** |
0.29 |
|
Georgia’s FDI |
0.25 |
0.29 |
1.00 |
0.59*** |
0.18 |
0.53*** |
|
Note: FDI – foreign direct investments; RLP – real labor productivity; symbols **, and *** indicate statistical significance at the 5%, and 1% levels, respectively. |
||||||
The results of the one-sample t-test revealed that the South Caucasus exhibits statistically significant differences in LP per employee, RLP, and LP in terms of PPP compared to the Visegrad and Baltic regions (Tab. 5). However, with regard to capital deepening, there was only a statistically significant difference between the South Caucasus and the Visegrad region (mean difference of 0.68%, p-value < 0.05). Moreover, the results for LP growth rate (the mean difference between the South Caucasus and the Visegrad and Baltic regions was 1.11% and 1.04%, respectively) and TFP (the mean
Table 5. Differences in results of the one-sample t -test between the South Caucasus and the Visegrad and Baltic regions
In the South Caucasus, RLP in the manufacturing sector was lower than in the Visegrad (mean difference of -1,462.49, p-value < 0.01) and Baltic regions (mean difference of -6.07, p-value < 0.01); these results were statistically significant7.
Regarding LP in terms of PPP, the results of the one-sample t -test were similar to RLP. In other words, the South Caucasus had a lower sectoral LP than the Visegrad (mean difference of USD -14.42, p-value < 0.01) and Baltic regions (mean difference of USD -7.28, p-value < 0.01).
Lastly, the effect size measured by eta squared () was small in the case of capital deepening in the South Caucasus compared to the Visegrad and Baltic regions (Baltic region: 0.02; Visegrad region: 0.01). However, RLP and LP in terms of PPP demonstrated large effect sizes (Baltic region: RLP – 0.43 and LP in PPP terms – 0.37; Visegrad region: RLP – 0.99 and LP in PPP terms – 0.70; Tab. 6) .
Concluding remarks and policy implications
The countries of the South Caucasus appear to be receptive to the Chinese investments that have found their way into the region since 2015 through various economic projects. Although Chinese projects promise new employment opportunities, increased international trade, and new income sources, investing in economies with a low productivity can be a risky endeavor for China. In addition, as the South Caucasus countries actively market their national economies, they may find themselves on a precarious position after a couple of years if actual economic outcomes do not meet their expectations. China continues to increase its partnerships with these countries due to their optimal geographical position, available infrastructure, and political propensity to cooperate. While the growing FDI may promise economic development in life of the South Caucasian countries, the reality is more complicated when their readiness for FDI-based industrialization is being tested.
The current research focuses on aggregate and sectoral productivity in the manufacturing sector of the South Caucasus. Also, the current paper provides a comprehensive and comparative examination of the labor productivity in manufacturing on the background of the increasing Chinese FDI in the South Caucasus. The novelty of the study lies in the use of the one-sample t -test to identify statistically significant differences between the
Table 6. Effect size of estimated one-sample mean differences
|
Baltic region |
Visegrad region |
|
|
Capital deepening, % contribution |
0.02 |
0.01 |
|
Real labor productivity (RLP), 2010 constant prices, in thousands (local currency) |
0.43 |
0.99 |
|
Labor productivity (LP), 2011 international purchasing power parity (PPP) exchange rate, in thousands |
0.37 |
0.70 |
|
Source: Own compilation. Note: Only the variables that fully fulfill the assumptions of the one-sample t -test have been reported. |
||
7 As the original data set expressed RLP in the local currencies+, the obtained mean difference lacks a final currency. Therefore, there is a limit about the outcome of the t-test regarded RLP; however, still, the t-test shows a difference in sectoral productivity of the South Caucasus countries calculated by their mean values.
South Caucasus region and Visegrad and Baltic countries. Such an approach allows us to reliably assess the interregional discrepancies, so the governments may adjust their economies to meet the increasing FDI and expectations. The novelty of this research is the ability to analyze and evaluate the South Caucasus as an entire region in comparison with other post-Soviet and post-Communist regions in terms of manufacturing productivity.
In monetary terms, manufacturing value added showed volatile behavior in the region. However, the trend analysis revealed that manufacturing value added, as a share of GDP, exhibited a downward trend between 1991 and 2019, with improvements between 2016 and 2019. Aggregate productivity has slowed down since the transition period and, in real and PPP terms, manufacturing labor productivity is lower in the South Caucasus than in the Visegrad and Baltic regions. In addition, in terms of country rankings, Armenia’s economy is the least productive, as measured by RLP in the manufacturing sector; Georgia is the leader, while Azerbaijan is second. In addition, an analysis of LP in terms of PPP shows that Georgia is more productive than Azerbaijan; it is on par with the average in the Baltic region and exceeds the average in the South Caucasus but is lower than the average in the Visegrad countries.
In addition, according to the results of the one-sample t -test, there are statistically significant differences in RLP and LP in terms of PPP between the South Caucasus countries and the Visegrad and Baltic countries. In other words, the South Caucasus has lower productivity levels that cannot be ignored and viewed as a coincidence. The effects of these differences are important and make it clear that, as China becomes a new economic partner, the South Caucasus countries should be concerned about their labor productivity to keep up with requests to meet competitive production in the manufacturing sector.
Meanwhile, the one-sample t -test also showed statistically significant and higher capital deepening in the South Caucasus, which can be seen as an opportunity to utilize particular financial resources to overcome the labor productivity issues via already accumulated capital.
Given these findings, the South Caucasus countries must consider certain policy implications to improve their productivity levels and cope with their new economic partner. The extent of economic success in the South Caucasus, which is an integral part of the BRI project, depends on the build-up of labor productivity and can be reflected in the manufacturing sector as China aims to integrate the region into GVCs. In fact, previous research established a positive relationship between the real GDP of the host countries and China’s expansion of outward FDI (He, Lyles, 2008; Cheng, Ma, 2010). Furthermore, the current low productive labor resources in the South Caucasus, in combination with the decreasing manufacturing value added, creates uncertainty and may severely impact future economic capacity. Thus, each country must design country- and sector-specific policies to address labor productivity challenges.
Specifically, Azerbaijan may enjoy upcoming transit fees and Chinese FDI in non-oil sectors, thus diversifying its economy. However, a risky aspect of this deal stems from the fact that the agreements are mainly made between Azerbaijani and Chinese state-owned companies rather than in the private sector, which limits free market mechanisms (Babayev, Ismailzade, 2020). As the largest Chinese FDI receiver and oil wealth holder, Azerbaijan should focus on innovationbased productive capacity in manufacturing to keep up with GVCs and compete in consumer markets. Stimulation policies must encompass a revival of the manufacturing sector led by market mechanisms and fueled by Chinese FDI, which will in turn decrease oil dependency – Azerbaijan’s main challenge in economic growth and development.
Furthermore, while Armenia’s participation in China-authored economic projects is limited by geographic and political challenges, Georgia should extensively improve its logistical capabilities to meet the future needs of its cooperation with China. However, Kharaishvili et al. highlighted the important role of policies in Georgia’s case
(Kharaishvili et al., 2021). Georgia must increase investments in shipment and logistics, in parallel to the standardization and harmonization of rules and standards with other countries to manage food shipments. Integration into the global systems and securing international and regional transport systems would also develop effective infrastructure for shipments (Schneider, 2021). In fact, China is closely collaborating with the Georgian government to fill these gaps.
References China's interests in the industrialization of the South Caucasus: comparative analysis of labor productivity in the manufacturing sector
- Ahmadova E., Hamidova L., Hajiyeva L. (2021). Diversification of the economy in the context of globalization (Case of Azerbaijan). Proceedings of Globalization and its Socio-Economic Consequences, 92(07002) 1–9. DOI: 10.1051/shsconf/20219207002
- Aristei D., Perugini C. (2012). Inequality and reforms in transition countries. Economic Systems, 36(1), 2–10. DOI: 10.1016/j.ecosys.2011.09.001
- Athukorala P. (2017). China’s evolving role in global production networks: Implications for Trump’s trade war. In: Song L., Garnaut R., Fang C., Johnston L. (Eds.). China’s New Sources of Economic Growth: Human Capital, Innovation and Technological Change. Volume 2. China Update Book Series, Australian National University Press. DOI: 10.22459/CNSEG.07.2017.16
- Babayev B., Ismailzade F. (2020). Azerbaijan’s contribution to the Chinese Belt & Road Initiative. In: Policy Outputs, University of Kent No. 100415 GCRF COMPASS Policy Brief. Available at: https://mpra.ub.uni-muenchen.de/100415/ (accessed: June 17, 2021).
- Blanchard J.M.F. (2021). Belt and Road Initiative (BRI) blues: Powering BRI research back on track to avoid choppy seas. Journal of Chinese Political Science, 26, 235–255. DOI: 10.1007/s11366-020-09717-0
- Cheng L.K., Ma Z. (2010). China’s outward foreign direct investment. In: Feenstra R.C., Wei S.J. (Eds.). China’s Growing Role in World Trade. Chicago: University of Chicago Press. DOI: 10.7208/9780226239729
- Cornell S.E., Ismailzade F. (2005). The Baku – Tbilisi – Ceyhan pipeline: Implications for Azerbaijan. In: Starr S.F., Cornell S.E. (Eds.). The Baku – Tbilisi – Ceyhan Pipeline: Oil Window to the West. Uppsala: The Silk Road Studies Program, Uppsala University.
- Diakonidze A. (2016). Superficial institutions and challenges of re-regulation in the republic of Georgia. Caucasus Survey, 4(2), 149–164. DOI: 10.1080/23761199.2016.1188489
- Dieppe A., Kilic Celik S., Kindberg-Hanlon G. (2020). Global productivity trends. In: Dieppe A. (Ed.). Global Productivity: Trends, Drivers, and Policies. Washington, DC: World Bank. DOI: 10.1596/978-1-4648-1608-6
- Éltető A., Antalóczy K. (2017). FDI promotion of the Visegrád countries in the era of Global Value Chains. Centre for Economic and Regional Studies, HAS Institute of World Economics. Working paper, 229, 1–37. Available at: http://real.mtak.hu/54728/1/WP_229_Elteto_Antaloczy_u.pdf (accessed: July 10, 2021)
- Field A. (2013). Discovering Statistics Using IBM SPSS Statistics. 4th edition. London: SAGE Publications Ltd.
- Gambino E. (2019). Georgia, the South Caucasus and the BRI: A situated view. China’s “Belt and Road” Initiative and the South Caucasus. Caucasus Analytical Digest, 111, 10–13. DOI: 10.3929/ethz-b-000368298
- Ge S. (2016). The Belt and Road Initiative in global perspectives. China Int’l Stud, 57(5), 5–27.
- Gerald B. (2018). A brief review of independent, dependent and one sample t-test. International Journal of Applied Mathematics and Theoretical Physics, 4(50), 50–54. DOI: 10.11648/j.ijamtp.20180402.13
- Gigauri I., Damenia N. (2019). Economic expectations of the Belt and Road Initiative for the South Caucasus, with emphasis on Georgia. Business and Economic Research, 9(1), 173–199. DOI: 10.5296/ber.v9i1.14438
- Guliyev M. (2020). Accelerating economic diversification in Azerbaijan: Challenges, shaping prospects. In: Ribeiro H.N.R., Costa M.A. da S., Cehok I. (Eds.) Proceedings of 56th International Scientific Conference on Economic and Social Development.
- Hakobjanyan A., Yeghiazaryan M. (2016). Interrelations between structural changes of economy and labor market developments in the republic of Armenia. In: Proceedings of aktualnie problemi obespecheniya ustoychivogo i socialnogo razvitiya regionov [Actual Problems of Ensuring Sustainable Development of the Regions].
- Hasanli Y., Musayev T., Rahimli G., Ismayilova S. (2021). Assessment of CES function parameters in oil-rich CIS countries. Universal Journal of Accounting and Finance, 9, 262–266. DOI: 10.13189/ujaf.2021.090216
- He W., Lyles M.A. (2008). China’s outward foreign direct investment. Business Horizons, 51(6), 485–491. DOI: 10.1016/j.bushor.2008.06.006
- Ismailov E., Papava V. (2018). Caucasian tandem and The Belt and Road Initiative. Central Asia and Caucasus, 19(11), 7–17.
- Jain R. (2020). Pitfalls or windfalls in China’s Belt and Road economic outreach? Asian Survey, 60, 685–709. DOI: 10.1525/as.2020.60.4.685
- Kharaishvili E., Gechbaia B., Erkomaishvili G. et al. (2021). Shipping policy of agri-food products and the formation of food markets in Georgia. In: Proceedings of International Conference on Sustainable Transport System and Maritime Logistics (ISTSML 2021), 339(01001), 1–14. DOI: 10.1051/matecconf/202133901001
- Maksimtsev I., Mezhevich N., Koroleva A. (2017). Economic development of the Baltic and Nordic countries: Characteristics of economic models. Baltic Region, 9(1), 41–54. DOI: 10.5922/2079-8555-2017-1-4
- Nixey J. (2010). The South Caucasus: Drama on three stages. In: Niblett R. (Ed.). America and a Changed World. Oxford: Wiley-Blackwell. DOI: 10.1002/9781444391565.ch7
- Onder H. (2013). Azerbaijan: Inclusive Growth in a Resource-Rich Economy. Washington D.C.: World Bank Publications. DOI: 10.1596/978-0-8213-9759-6
- Pallant J. (2010). SPSS Survival Manual: A Step by Step Guide to Data Analysis Using IBM SPSS. 4th edition. Maidenhead: Open University Press/McGraw-Hill. DOI: 10.4324/9781003117407
- Rolland N. (2018). China’s ambitions in Eastern Europe and the South Caucasus, Russie.Nei.Visions, 112, Ifri, 1–26.
- Schneider F. (2021). Actors and agency in china’s belt and road initiative: An introduction. In: Schneider F. (Ed.). Global Perspectives on China’s Belt and Road Initiative: Asserting Agency through Regional Connectivity. Amsterdam: Amsterdam University Press.
- Valerio A., Herrera-Sosa K., Monroy-Taborda S., Chen D. (2015). Armenia skills toward employment and productivity, Survey Findings (Urban Area), 1–22. DOI: 10.1596/25199
- Van Dijk M.P., Martens P. (2016). The silk road and Chinese interests in Central Asia and the Caucasus: the case of Georgia. Working Paper No. 12, Maastricht School of Management, 1–13.
- Waal T.D. (2012). A broken region: The persistent failure of integration projects in the South Caucasus. Europe-Asia Studies, 64(9), 1709–1723. DOI: 10.1080/09668136.2012.718416
- Weber I.M. (2021). How China Escaped Shock Therapy: The Market Reform Debate. London: Routledge. DOI: 10.4324/9780429490125
- Zhai F. (2018). China’s Belt and Road Initiative: A preliminary quantitative assessment. Journal of Asian Economics, 55, 84–92. DOI: 10.1016/j.asieco.2017.12.006
