Choice of the development strategy of economic entities on the basis of the use of the modern digital tooling (at the example of the agricultural branch)
")
Author: Grachev I.D., Larin S.N., Sokolov N.A.
Journal: Экономика и бизнес: теория и практика @economyandbusiness
Article in issue: 4-1 (62), 2020.
Free access
Starting from September 2014 all branches of the Russian economics implement import substitution strategies. Nowadays the successful solution of such processes requires the enhancement of the quality of economic managerial solutions. For this purpose in terms of the digitalization of the Russian economics it seems expedient to use the whole tooling of the digital processing of huge amount of data, tried and tested in the field of mathematics, physics, economics and other natural sciences. This work substantiates the possibility for the improvement of the quality of the selection by an economic entity of the import substitution strategy with use of the digital econophysical tooling and of the statistic regulation method. Was offered the new approach for the modernization of methods for the optimization of investments of economic entities on the basis of the theory of Markowitz investment portfolios in terms of the resignation from non-mandatory restrictions of the type of the linearity of trends and of other restrictions. Obtained results can be used for the detailing of evaluations and derivation of the additional information on the hidden interrelation of goods. On this basis can be adopted more effective managerial solutions within frames of the implementation of import substitution strategies not only in the agricultural, but also in other key branches of the Russian economics.
Economic entity, import substitution strategy, optimization, theory of markowitz investment protfolios, substantiation of the selection, econophysical tooling
Short address: https://sciup.org/170182563
IDR: 170182563 | DOI: 10.24411/2411-0450-2020-10265
Выбор стратегии развития хозяйствующих субъектов на основе использования современного цифрового инструментария (на примере сельскохозяйственной отрасли)
Начиная с сентября 2014 года во всех отраслях российской экономики осуществляется реализация стратегий импортозамещения. В настоящее время для успешного решения этих процессов требуется повышение качества экономических управленческих решений. Для этого в условиях цифровизации российской экономики представляется целесообразным использовать весь инструментарий цифровой обработки больших массивов данных, наработанный в области математики, физики, экономики и других естественных науках. В данной работе обоснована возможность улучшения качества выбора хозяйствующим субъектом стратегии импортозамещения при помощи цифрового эконофизического инструментария и метода статистической регуляции. Предложен новый подход к совершенствованию методов оптимизации инвестиций хозяйствующих субъектов на основе теории инвестиционных портфелей Марковица в плане отказа от необязательных ограничений типа линейности трендов и других ограничений. Полученные результаты могут быть использованы для уточнения оценок и извлечения дополнительной информации о скрытой взаимосвязи товаров. На этом основании можно принимать более эффективные управленческие решения в рамках реализации стратегий импортозамещения не только в сельскохозяйственной, но и в других ключевых отраслях российской экономики.
Text of the scientific article Choice of the development strategy of economic entities on the basis of the use of the modern digital tooling (at the example of the agricultural branch)
The successful implementation of import substitution strategies by branches and enterprises of the Russian economics in terms of its digitalization requires the processing of huge amounts of the various data. As a rule, such amounts content hidden material relations, not obvious for a decision making person, not equipped with modern digital methods. In order to enhance the quality of economic managerial solutions it seems expedient to use the whole tooling, tooling of the digital processing of huge amount of data, tried and tested in the field of mathematics, physics, economics and other natural sciences. This work shows the possibility for the improvement of the quality of the selection of the import substitution strategy with use of digital computer methods for the solution of incorrect problems of physics on the basis of the semi-structured information.
Research purpose. This research purpose is to substantiate the possibility for the improvement of the quality of the selection by an economic entity of the import substantiation strategy with the use of the digital econophysic tooling and of the statistic regulation method.
Маterials and methods. In some works are developed methods for the optimization of investments of economic entities on the basis of the theory of Markowitz investment portfolios [1, 2, 3]. Some of it are adapted to the level of linear approximations and visual images. It has been experimentally checked at the example of large scale agricultural enterprises, implementing import substitution strategies, and showed high reliability and efficiency [4]. Such circumstance allows to modernize such methods in terms of resignation from non-mandatory restrictions of the type of trends’ linearity etc., all the more so that every modern boss has not got any problems with intermediate mathematic calculations with use of the modern digital tooling.
This work will consider the development of methods with the application of simplest options [5] of the statistic regulation method, using the experimental data from the table of [6] as a method, where it is indexed by such rows as m – time, and by columns as n – agricultural cultures (branches, goods etc.). The crop yield of each culture changes every year.
Thus it can be argued that the crop yield (profitability) is a random value (see table), superimposed on trends, individual for each agricultural crop.
In comparison with [6], the assignment of tasks has got such a common point as the requirement for the linearity and profitability of agricultural crops over time.
In future let’s assume that the whole table data by rows is consolidated with a certain common trend of the arbitrary nature (growing, descending, quasiperiodic …) with observation of the smoothness requirement.
We can be almost sure that common country and branch trends should also have an effect on the dynamics of each of agricultural crops (branches, goods etc.), аnd in this juncture linear approximations can be considered as intergroup differences, which distinguish the efficiency of investments in more details also.
Таble. Crop yield of agricultural crops for years 2013-2018
|
Culture name |
2013 |
2014 |
2015 |
2016 |
2017 |
2018 |
|
Grain and pulse crops |
22 |
24,1 |
23,7 |
26,2 |
29,2 |
25,4 |
|
Pulse crops |
22,4 |
24,4 |
23,9 |
26,5 |
29,7 |
26,2 |
|
Wheat |
22,3 |
25 |
23,9 |
26,8 |
31,2 |
27,2 |
|
Winter wheat |
29,9 |
35,1 |
32 |
37,6 |
41,7 |
35,2 |
|
Spring wheat |
14,2 |
14,7 |
15,5 |
15,7 |
18,9 |
16,8 |
|
Rye |
18,9 |
17,7 |
16,7 |
20,3 |
21,7 |
20 |
|
Winter rye |
18,9 |
17,7 |
16,7 |
20,3 |
21,7 |
20,1 |
|
Winter and summer triticale |
24,1 |
26,4 |
23,1 |
27,8 |
29,1 |
27 |
|
Barley |
19,2 |
22,7 |
21,3 |
22,1 |
26,2 |
21,6 |
|
Winter barley |
40,3 |
35,9 |
40 |
39,5 |
41,9 |
38,8 |
|
Summer barley |
18,1 |
21,8 |
20 |
20,8 |
25,2 |
20,5 |
|
Оat |
16,4 |
17,1 |
16 |
17,3 |
19,6 |
17,3 |
|
Rice |
49,5 |
53,6 |
55,8 |
53 |
53,1 |
57,6 |
|
Buckwheat |
9,2 |
9,3 |
9,5 |
10,6 |
10,2 |
9,5 |
|
Panic grass |
11,8 |
12,3 |
12,9 |
15,4 |
13,4 |
11,6 |
|
Pulse crops |
12,1 |
14,6 |
15,9 |
17,5 |
20,1 |
13 |
|
Pea |
14 |
16,8 |
18,6 |
21,1 |
25,3 |
16,6 |
|
Oilseed crop |
13,3 |
12,4 |
12,9 |
13,9 |
14,1 |
14,7 |
|
Rape |
11,3 |
12,6 |
11,2 |
11 |
15,8 |
13,3 |
|
Winter rape |
16,6 |
16,8 |
19,3 |
18,2 |
22,7 |
19,8 |
|
Summer rape |
9,9 |
11,2 |
9,8 |
10,2 |
14,5 |
12,4 |
|
Sugar beet |
442 |
370 |
388 |
470 |
442 |
381 |
|
Vegetables |
214 |
219 |
226 |
229 |
241 |
243 |
|
Cucurbits |
105 |
104 |
109 |
119 |
126 |
147 |
|
Forage crops |
||||||
|
Root forage crops, including forage sugar beet |
273 |
253 |
267 |
255 |
252 |
262 |
|
Forage crops for silage (without corn) |
97 |
88 |
95 |
99 |
109 |
88 |
|
orage corn |
193 |
159 |
208 |
195 |
185 |
194 |
|
Annual grasses |
||||||
|
for hay |
16,7 |
16,8 |
16,8 |
20,2 |
19,6 |
18,1 |
|
for the green forage, grass meal |
71 |
71 |
73 |
76 |
84 |
76 |
|
Perennial grasses |
||||||
|
for hay |
16,4 |
16,3 |
16,7 |
18 |
18,2 |
17,5 |
|
for the green forage, grass meal |
1,3 |
100 |
104 |
109 |
110 |
102 |
|
Cultivated grassland and haymaking |
||||||
|
for hay |
16,1 |
16,3 |
19,1 |
16,9 |
17,4 |
17,7 |
|
for the green forage, grass meal |
55,8 |
61,1 |
61 |
55,7 |
50,6 |
47,2 |
|
Natural haymaking in agricultural organizations |
||||||
|
for hay |
9,1 1 |
9,3 1 |
9,3 1 |
10,1 |
10,3 |
10,7 |
Similarly to such kind of an agricultural branch tables can be generated on the basis of the statistic data as well as for other branches of the Russian economics. In such case the data by rows will represent a group of kinds of the manufactured production, for which in relevant columns will be reflected its economic evaluations over time (per year etc.) in monetary or natural indices. So, the approach, described in future, can be applied almost in all branches of the Russian economics. In other words, it has got a universal character.
wherе F – experimental data matrix, based on the table;
γ – discretization of the arbitrary continuously differentiable by the m function, common to all data;
а – vector of constant coefficients of deviatio n s from the general trend;
b – vector of coefficients of linear deviations from the general trend;
Results and discussion. Аpriori we can assume that such common, not the string manipulation of the whole amount (see table) can allow to evaluate more precisely both differences between agricultural crops, as well as to an even greater degree real pair intercul-tural correlations of the temporary dynamics of profitability of different agricultural crops.
Formally, such assignment of task is corresponded by the record (1):
F = a x I Z + b x X L + In x y t -c
(1),
I – single vector (m×1);
I – single vector (n×1);
X – linear vector (m×1);
^ - matrix of residual deviations, which we apriori assume as not correlated.
With the vector reformulation by [2] (1) is transformed in the system of linear overdetermined (m×n) – equations for 2n+m of unknowns, represented by the block vector
Suppressing transformations, non-mandatory for this article, the statustic regulated solution (1), taking (2) into account, looks like:
px=(KT x K +XxQ 2) " 1 x KT x f
(3),
where К is such a kind of a block matrix:
|
mxEn |
(X)xE n |
i n x i m |
|
|
«XT x X)) x E n |
I n x X T |
|
I m х 1 П |
Х х | Т |
nxE m |
= К (4)
f – such kind of a block matrix:
[fi; f2; fs] = f where f1 = FxIm f2 = FxXm f3 = FTxIn
Е – single diagonal matrix,
(X)=(Xm xlm)
Ω2 – block stabilizer of Tykhonov type [2] in the simplest case using the second-order smoothness by ϕ and the zero apriori information by a and b.
λ – stabilizing parameter calculated in the simplest option by 1 step according to the formula
X _ Sp(K×Ω2 1× кт × a) = ̅T×A× ̅)-Sp(Vξ×A)
(10),
where А is an optional matrix, which, in particular, can be E, Ω2 etc.;
V ξ – covariation matrix of accidental errors from ξ trends, which apriori are recognized independent and normal with given dispersion level.
Anyway, basing on the judgement, the common processing of the type 1 table by (110) should provide for more exact and stable evaluations of a and b elements, than the row-by-row processing of short temporal series by m-index, before recommending it for the practical use it is expedient to check it on model experiments.
Below are given selected results of a row of such cyclic experiments, where as a0 are selected I̅n , as b Q=0,05×Xn , as γ0 the quadratic curve of (0,01÷0,1)(Xm ⊗ X m ) kind, wherе ⊗ is the element by element multiplication, ξ – random mistakes with the average squared displacement of 0,01÷0,2.
By results of model experiments were compared deviations of restored A λ , Β λ , γ ̅ values from true ones with A0,B0 от AR,BR deviations, calculated row by row according to the standard multiple correlation method.
Results were compared by evaluations of average squared displacements:
SΑλ = (〈(A λ-А0)T ×(A λ-А0)〉)1/2; SΒλ = (〈(Bλ-В0)T ×(B λ-В0)〉)1/2 (11)
SA 0 = (〈(AR -А 0)T×(AR -А 0)〉)1/2 ; SB0 = (〈(BR -В 0)T×(BR -В 0)〉)1/2 (12)
First evaluations demonstrated the stability of regularized algorithms for all realistic error levels, as well as double-triple decrease of SΑ λ , SΒ λ discrepancy in comparison with SAQ, SBQ row by row processing, what allows to recommend the method for the processing of real multi-product (multi-branch) data tables.
Besides that, digital experiments demonstrate the possibility for the visualization of the selection of the most profitable culture, provided the possible risk in the simplest option of the linear target combined function of U kind
U = z×P(m+1)- (1- z)×δ(m+1) (13),
w herе z – parameter (0÷1);
P(m + 1) – resulting anticipated profitabilities in the (m + 1) year;
δ (m + 1) – estimated values of square deviations of profitabilities of cultures for (m + 1) year.
In the model example cultures are ranged by profitability from 0 tо 30, аnd risks are growing in opposition to profitability.
Тhe typical result, given at the figure 1, illustrates visual possibilities of the method, as well as the expedience of the modernization of the target function (13), provided modern perceptions of the asymmetry of profits and losses [7].
The figure 2 illustrates the implemented difference while calculating general branch trends by the ordinary averaging and smoothing by (3), provided errors, compared with the annual crop yield growth.
Generally, theoretic evaluations and model checks allow to the start the experimental test run of the statistic regularized evaluation of general trends of the profitability of the production of certain kinds of production in most effective branches of the Russian economics, while practically implementing import substitution strategies.
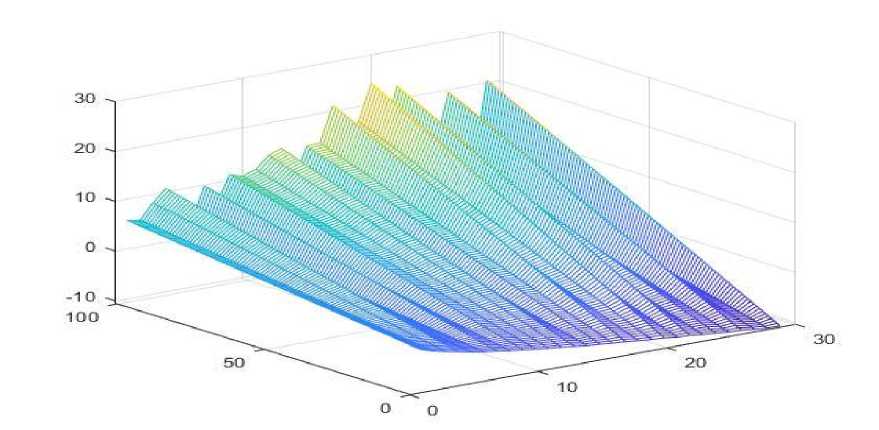
Fig. 1. Combined profitability of different cultures with the different risk level
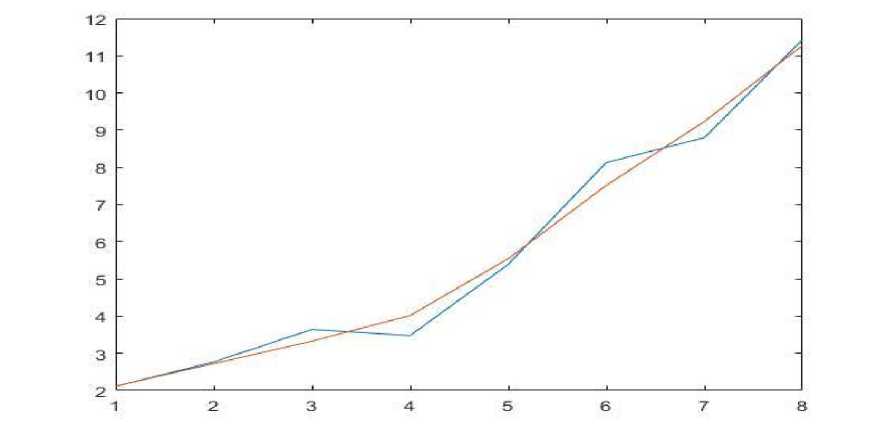
Fig. 2. Smoothed by (3) and the integral profitability, averaged by the ordinary method (by OLS) with the level of errors, commensurate with the profitableness growth
Conclusion. Let’s formulate following opinions on the basis of the research, generated in the course of the performed research.
-
1. While selecting the ranked list of import substantiating agricultural crops we showed on self-contained digital model experiments, close to practically registered ones, the possibility of the detailing of evaluations and of
-
2. Similarly to the agricultural branch the offered approach can be applied in almost all branches of the Russian economics, as it is universal.
the retrieval of the additional information on the hidden interrelation of goods for most effective managerial solutions.
References Choice of the development strategy of economic entities on the basis of the use of the modern digital tooling (at the example of the agricultural branch)
- Damodoran, А. 2007. Investment Evaluation: Instruments and Methods of Assessment of Any Assets / А. Damodoran. М.: Аlpinа. - 1340 p.
- Sharpe W., Аlexander G., Bailey J. 2016. Investments / W. Sharpe, G. Аlexander, J. Bailey. М.: INFRA-М. - 1040 p.
- Markovitz, H.M. 1952. Portfolio selection. J. of Finance. Vol. 7. № 1. P. 77-91.
- Gertsekovich, D.А. 2017. Formation of the Optional Investment Portfolio According to the Complex of Effective Portfolios // MSU Herald. Series: Economics. №5. P. 86-101.
- Grachev, I.D. 2011. Stochastic Market Model. Меthods and Econophysic Instruments for the Economic Progress Modeling. - Germany, Saarbrücken: Lambert Publishing House. - 340 p.
- Gertsekovich, D.A., Podlinyaev, O.L., Larin, S.N. 2020. Strategic development of the agro-industrial complex of Russian economics on the basis of involved investments. Journal of Economy and entrepreneurship. Vol. 14. №1 (114). P. 137-143.
- Каhneman, D., Тversky, А. 2003. Rational Choice, Values and Frames / D. Каhneman, А. Тversky // Psychological Magazine. Vol. 24. № 4. P. 31-42.
