Classification Model of Prediction for Placement of Students

Author: Ajay Kumar Pal, Saurabh Pal
Journal: International Journal of Modern Education and Computer Science (IJMECS) @ijmecs
Article in issue: 11 vol.5, 2013.
Free access
Data mining methodology can analyze relevant information results and produce different perspectives to understand more about the students’ activities. When designing an educational environment, applying data mining techniques discovers useful information that can be used in formative evaluation to assist educators establish a pedagogical basis for taking important decisions. Mining in education environment is called Educational Data Mining. Educational Data Mining is concerned with developing new methods to discover knowledge from educational database and can used for decision making in educational system. In this study, we collected the student’s data that have different information about their previous and current academics records and then apply different classification algorithm using Data Mining tools (WEKA) for analysis the student’s academics performance for Training and placement. This study presents a proposed model based on classification approach to find an enhanced evaluation method for predicting the placement for students. This model can determine the relations between academic achievement of students and their placement in campus selection.
Knowledge Discovery in Databases, Data Mining, Classification Model, Classification, WEKA
Short address: https://sciup.org/15014604
IDR: 15014604
Text of the scientific article Classification Model of Prediction for Placement of Students
Majority of students in higher education join a course for securing a good job. Therefore taking a wise career decision regarding the placement after completing a particular course is crucial in a student’s life. An educational institution contains a large number of student records. Therefore finding patterns and characteristics in this large amount of data is not a difficult task. Higher Education is categorized into professional and non-professional education. Professional education provides professional knowledge to students so that they can make their stand in corporate sector. Professional education may be technology oriented or it may be totally concentrating on improving managerial skills of candidate. Masters in Computer
Applications (MCA) course provides professional computer technological education to students. This course provides state of the art theoretical as well as practical knowledge related to information technology and make students eligible to stand in progressing information industry.
The prediction of MCA students where they can be placed after the completion of MCA course will help to improve efforts of students for proper progress. It will also help teachers to take proper attention towards the progress of the student during the course. It will help to build reputation of institute in existing similar category institutes in the field of IT education.
The present study concentrates on the prediction of placements of MCA students. We apply data mining techniques using Decision tree and Naïve Bayes classifier to interpret potential and useful knowledge [7].
The rest of this paper is organized as follows: Section II presents different type of data mining techniques for machine learning Section III describes background and history of educational data mining. Section IV describes the methodology used in our experiments about applying data mining techniques on the educational data for placement of students and the results obtained. Finally we conclude this paper with a summary and an outlook for future work in Section V.
-
II. DATA MINING
Data mining, also popularly known as Knowledge Discovery in Database, refers to extracting or ‘mining’ knowledge from large amounts of data. Data mining techniques are used to operate on large volumes of data to discover hidden patterns and relationships helpful in decision making. While data mining and knowledge discovery in database are frequently treated as synonyms, data mining is actually part of the knowledge discovery process.
Data mining is: Discovering the methods and patterns in large databases to guide decisions about future activities. It is expected that data mining tools to get the model with minimal input from the user to recognize. The model presented can be useful to understand the unexpected and provide an analysis of data followed by other tools to put decision-making are examined and it ultimately leads to strategic decisions and business intelligence. The simplest word for knowledge extraction and exploration of volume data is very high and the more appropriate name for this term is “Exploring the knowledge of database". A database is knowledge of discovery process. This process includes the preparation and interpretation of results.
Classification is the most commonly applied data mining technique, which employs a set of pre-classified attributes to develop a model that can classify the population of records at large. This approach frequently employs decision tree or neural network-based classification algorithms. The data classification process involves learning and classification. In learning the training data are analyzed by classification algorithm. In classification test data are used to estimate the accuracy of the classification rules. If the accuracy is acceptable the rules can be applied to the new data sets. The classifier-training algorithm uses these pre-classified attributes to determine the set of parameters required for proper discrimination. The algorithm then encodes these parameters into a model called a classifier. The widely used classification algorithms are
-
A. Naïve Bayesian Classification
The Naïve Bayes Classifier technique is particularly suited when the dimensionality of the inputs is high. Despite its simplicity, Naive Bayes can often outperform more sophisticated classification methods. Naïve Bayes model identifies the characteristics of dropout students. It shows the probability of each input attribute for the predictable state.
A Naive Bayesian classifier is a simple probabilistic classifier based on applying Bayesian theorem (from Bayesian statistics) with strong (naive) independence assumptions. By the use of Bayesian theorem we can write

We preferred Naive Bayes implementation because:
-
• Simple and trained on whole (weighted) training data
-
• Over-fitting (small subsets of training data) protection
-
• Claim that boosting “never over-fits” could not be maintained.
-
• Complex resulting classifier can be determined reliably from limited amount of data
-
B. Multilayer Perceptron
Multilayer Perceptron (MLP) algorithm is one of the most widely used and popular neural networks. The network consists of a set of sensory elements that make up the input layer, one or more hidden layers of processing elements, and the output layer of the processing elements (Witten and Frank, [1]). MLP is especially suitable for approximating a classification function (when we are not so much familiar with the relationship between input and output attributes) which sets the example determined by the vector attribute values into one or more classes.
-
C. C4.5 Tree
The most commonly, and nowadays probably the most widely used decision tree algorithm is C4.5. Professor Ross Quinlan [2] developed a decision tree algorithm known as C4.5 in 1993; it represents the result of research that traces back to the ID3 algorithm (which is also proposed by Ross Quinlan in 1986). C4.5 has additional features such as handling missing values, categorization of continuous attributes, pruning of decision trees, rule derivation, and others. Basic construction of C4.5 algorithms uses a method known as divide and conquer to construct a suitable tree from a training set S of cases (Wu and Kumar, [3]):
-
• If all the cases in S belong to the same class or S is small, the tree is a leaf labelled with the most frequent class in S.
-
• Otherwise, choose a test based on a single attribute with two or more outcomes. Make this test the root of the tree with one branch for each outcome of the test, partition S into corresponding subsets S 1 , S 2 , ……… according to the outcome for each case, and apply the same procedure recursively to each subset.
There are usually many tests that could be chosen in this last step. C4.5 uses two heuristic criteria to rank possible tests: information gain, which minimizes the total entropy of the subsets, and the default gain ratio that divides information gain by the information provided by the test outcomes.
J48 algorithm is an implementation of C4.5 decision tree algorithm in Weka software tool. Flowchart of decision trees is presented by the tree structure. In every internal node the condition of some attribute is being examined, and every branch of the tree represents an outcome of the study. The branching of the tree ends with leaves that define a class to which examples belong. Decision tree algorithm is a popular procedure today because of its ease of implementation and in particular because of the possibility for the results to be graphically displayed.
To evaluate the robustness of the classifier, the usual methodology is to perform cross validation on the classifier. In this study, a 3-fold cross validation was used: we split data set randomly into 3 subsets of equal size. Two subsets were used for training, one subset for cross validating, and one for measuring the predictive accuracy of the final constructed network. This procedure was performed 3 times so that each subset was tested once. Test results were averaged over 3-fold cross validation runs. Data splitting was done without sampling stratification. The Weka software toolkit can calculate all these performance metrics after running a specified k-fold cross-validation. The prediction accuracy of the models was compared.
III. BACKGROUND AND RELATED WORK
Data mining techniques has evolved its research very well in the field of education in a massive amount. This tremendous growth is mainly because it contributes much to the educational systems to analyze and improve the performance of students as well as the pattern of education. Various works had been done by a large number of scientists to explore the best mining technique for performance monitoring and placement. Few of the related works are listed down to have a better understanding of what should be carried on in the past for further growth.
Han and Kamber [4] describes data mining software that allow the users to analyze data from different dimensions, categorize it and summarize the relationships which are identified during the mining process.
Bhardwaj and Pal [5] conducted study on the student performance based by selecting 300 students from 5 different degree college conducting BCA (Bachelor of Computer Application) course of Dr. R. M. L. Awadh University, Faizabad, India. By means of Bayesian classification method on 17 attributes, it was found that the factors like students’ grade in senior secondary exam, living location, medium of teaching, mother’s qualification, students other habit, family annual income and student’s family status were highly correlated with the student academic performance.
Pandey and Pal [7] conducted study on the student performance based by selecting 600 students from different colleges of Dr. R. M. L. Awadh University, Faizabad, India. By means of Bayes Classification on category, language and background qualification, it was found that whether new comer students will performer or not.
Hijazi and Naqvi [8] conducted as study on the student performance by selecting a sample of 300 students (225 males, 75 females) from a group of colleges affiliated to Punjab university of Pakistan. The hypothesis that was stated as "Student's attitude towards attendance in class, hours spent in study on daily basis after college, students' family income, students' mother's age and mother's education are significantly related with student performance" was framed. By means of simple linear regression analysis, it was found that the factors like mother’s education and student’s family income were highly correlated with the student academic performance.
Khan [9] conducted a performance study on 400 students comprising 200 boys and 200 girls selected from the senior secondary school of Aligarh Muslim University, Aligarh, India with a main objective to establish the prognostic value of different measures of cognition, personality and demographic variables for success at higher secondary level in science stream. The selection was based on cluster sampling technique in which the entire population of interest was divided into groups, or clusters, and a random sample of these clusters was selected for further analyses. It was found that girls with high socio-economic status had relatively higher academic achievement in science stream and boys with low socioeconomic status had relatively higher academic achievement in general.
Z. J. Kovacic [10] presented a case study on educational data mining to identify up to what extent the enrolment data can be used to predict student’s success. The algorithms CHAID and CART were applied on student enrolment data of information system students of open polytechnic of New Zealand to get two decision trees classifying successful and unsuccessful students. The accuracy obtained with CHAID and CART was 59.4 and 60.5 respectively.
Galit [11] gave a case study that use students data to analyze their learning behavior to predict the results and to warn students at risk before their final exams.
Yadav, Bhardwaj and Pal [12] conducted study on the student retention based by selecting 398 students from MCA course of VBS Purvanchal University, Jaunpur, India. By means of classification they show that student’s graduation stream and grade in graduation play important role in retention.
Al-Radaideh, et al [13] applied a decision tree model to predict the final grade of students who studied the C++ course in Yarmouk University, Jordan in the year 2005. Three different classification methods namely ID3, C4.5, and the NaïveBayes were used. The outcome of their results indicated that Decision Tree model had better prediction than other models.
Baradwaj and Pal [15] obtained the university students data like attendance, class test, seminar and assignment marks from the students’ previous database, to predict the performance at the end of the semester.
Ayesha, Mustafa, Sattar and Khan [16] describe the use of k-means clustering algorithm to predict student’s learning activities. The information generated after the implementation of data mining technique may be helpful for instructor as well as for students.
Pal and Pal [17] conducted study on the student performance based by selecting 200 students from BCA course. By means of ID3, c4.5 and Bagging they find that SSG, HSG, Focc, Fqual and FAIn were highly correlated with the student academic performance.
Bray [18], in his study on private tutoring and its implications, observed that the percentage of students receiving private tutoring in India was relatively higher than in Malaysia, Singapore, Japan, China and Sri Lanka. It was also observed that there was an enhancement of academic performance with the intensity of private tutoring and this variation of intensity of private tutoring depends on the collective factor namely socioeconomic conditions.
Yadav, Bhardwaj and Pal [19] obtained the university students data like attendance, class test, seminar and assignment marks from the students’ database, to predict the performance at the end of the semester using three algorithms ID3, C4.5 and CART and shows that CART is the best algorithm for classification of data.
IV. DATA MINING PROCESS
Knowing the factors for placement of student can help the teachers and administrators to take necessary actions so that the success percentage of placement can be improved. Predicting the placement of a student needs a lot of parameters to be considered. Prediction models that include all personal, social, psychological and other environmental variables are necessitated for the effective prediction of the placement of the students.
-
A. Data Preparations
The data set used in this study was obtained from VBS Purvanchal University, Jaunpur (Uttar Pradesh) on the sampling method for Institute of Engineering and Technology for session 2008-2012. Initially size of the data is 65.
-
B. Data selection and Transformation
In this step only those fields were selected which were required for data mining. A few derived variables were selected. While some of the information for the variables was extracted from the database. All the predictor and response variables which were derived from the database are given in Table I for reference.
TABLE I: student related variables
|
Variables |
Description |
Possible Values |
|
Sex |
Students Sex |
{Male, Female} |
|
MR |
MCA Result |
{First ≥ 60%, Second ≥ 45 & <60% Third ≥ 36 & <45%} |
|
SEM |
Seminar Performance |
{Poor , Average, Good} |
|
LW |
Lab Work |
{ Yes, No } |
|
CS |
Communication Skill |
{Poor , Average, Good} |
|
GB |
Graduation Background |
{Art, Computer, Science} |
|
Placement |
Placement of Student |
{Yes, No} |
The domain values for some of the variables were defined for the present investigation as follows:
-
• MR - Marks obtained in MCA. It is split into three class values: First – ≥ 60%, Second – ≥ 45% and <60%, Third – ≥ 36% and < 45%.
-
• SEM – Seminar Performance obtained. In each semester seminar are organized to check the performance of students. Seminar performance is evaluated into three classes: Poor – Presentation and communication skill is low, Average – Either presentation is fine or Communication skill is fine, Good – Both presentation and Communication skill is fine.
-
• LW – Lab Work. Lab work is divided into two classes: Yes – student completed lab work, No – student not completed lab work .
-
• CS – Communication Skill. Communication skill is divided into three classes: Poor – Communication skill is low, Average – communication skill is up to mark, Goodcommunication skill is fine.
-
• GB – Graduation Background. This defines the background of student. Whether students have done graduation is Art, Science or Computer.
-
• Placement - Whether the student placed or not after completing his/her MCA. Possible values are Yes if student placed and No if student not placed.
-
C. Implementation of Mining Model
Weka is open source software that implements a large collection of machine leaning algorithms and is widely used in data mining applications. From the above data, placement.arff file was created. This file was loaded into WEKA explorer. The classify panel enables the user to apply classification and regression algorithms to the resulting dataset, to estimate the accuracy of the resulting predictive model, and to visualize erroneous predictions, or the model itself. The algorithm used for classification is Naive Bayes, Multilayer Perceptron (MLP) and J48. Under the "Test options", the 10-fold cross-validation is selected as our evaluation approach. Since there is no separate evaluation data set, this is necessary to get a reasonable idea of accuracy of the generated model. This predictive model provides way to predict whether a new student will place or not in an organization.
-
D. Results
To better understand the importance of the input variables, it is customary to analyse the impact of input variables during students' placement success, in which the impact of certain input variable of the model on the output variable has been analysed. Tests were conducted using four tests for the assessment of input variables: Chi-square test, Info Gain test and Gain Ratio test. Different algorithms provide very different results, i.e.
each of them accounts the relevance of variables in a different way. The average value of all the algorithms is taken as the final result of variables ranking, instead of selecting one algorithm and trusting it. The results obtained with these values are shown in Table II.
TABLE II: Result of tests and average rank
|
Variable |
Chi-squared |
Info Gain |
Gain Ratio |
Average Rank |
|
Sex |
2.0107 |
0.0225 |
0.0231 |
0.6854 |
|
MR |
16.3112 |
0.2053 |
0.1338 |
5.5501 |
|
SEM |
20.1697 |
0.261 |
0.1799 |
6.8702 |
|
LW |
9.6973 |
0.1106 |
0.1121 |
3.3067 |
|
CS |
15.1661 |
0.1828 |
0.1211 |
5.1567 |
|
GB |
3.4595 |
0.0389 |
0.0248 |
1.1744 |
The aim of this analysis is to determine the importance of each variable individually. Table II shows that attribute Sex impacts output the most, and that it showed the best performances in all of the three tests. Then these attributes follow: GB (Graduation Background), LW (Lab Work), and CS (Communication Skill).
Now, we have carried out some experiments in order to evaluate the performance and usefulness of different classification algorithms for predicting students’ placement. The results of the experiments are shown in table III.
TABLE IV: Training and Simulation Error
|
Evaluation Criteria |
Classifiers |
||
|
NB |
MLP |
J48 |
|
|
Kappa statistic |
0.7234 |
0.6001 |
0.5076 |
|
Mean absolute error (MAE) |
0.2338 |
0.2212 |
0.3156 |
|
Root mean squared error (RMSE) |
0.3427 |
0.4234 |
0.453 |
|
Relative absolute error (RAE) |
46.7085% |
44.2036% |
63.0499 % |
|
Root relative squared error (RRSE) |
68.4637% |
84.568% |
90.4895 % |
Once Predictive model is created, it is necessary to check how accurate it is, The Accuracy of the predictive model is calculated based on the precision, recall values of classification matrix.
PRECISION is the fraction of retrieved instances that are relevant. It is calculated as total number of true positives divided by total number of true positives + total number of false positives.
True positives
Precision = (1) True positives + False positives
RECALL is fraction of relevant instances that are retrieved. It is usually expressed as a percentage. It is calculated as total number of true positives divided by total number of true positives + total number of false negatives.
TABLE III: Performance of the classifiers
True positives
Recall =
True positives + False negatives
|
Evaluation Criteria |
Classifiers |
||
|
NB |
MLP |
J48 |
|
|
Timing to build model (in Sec) |
0 |
0.27 |
0 |
|
Correctly classified instances |
56 |
52 |
49 |
|
Incorrectly classified instances |
9 |
13 |
16 |
|
Accuracy (%) |
86.15% |
80.00% |
75.38% |
The percentage of correctly classified instances is often called accuracy or sample accuracy of a model. So Naïve Bayes classifier has more accuracy than other two classifiers.
Kappa statistic, mean absolute error and root mean squared error will be in numeric value only. We also show the relative absolute error and root relative squared error in percentage for references and evaluation. The results of the simulation are shown in Tables IV.
Comparison of evaluation measures by class are shown in table V.
TABLE V: Comparison of evaluation measures
|
Classifier |
TP |
FP |
Precision |
Recall |
Class |
|
NB |
0.818 |
0.094 |
0.9 |
0.818 |
Yes |
|
0.906 |
0.182 |
0.829 |
0.906 |
No |
|
|
MLP |
0.788 |
0.188 |
0.813 |
0.788 |
Yes |
|
0.813 |
0.212 |
0.788 |
0.813 |
No |
|
|
J48 |
0.758 |
0.25 |
0.758 |
0.758 |
Yes |
|
0.75 |
0.242 |
0.75 |
0.75 |
No |
The performance of the learning techniques is highly dependent on the nature of the training data. Confusion matrices are very useful for evaluating classifiers. The columns represent the predictions, and the rows represent the actual class. To evaluate the robustness of classifier, the usual methodology is to perform cross validation on the classifier.
TABLE VI: Confusion matrix
|
Classifier |
Yes |
No |
Class |
|
NB |
27 |
6 |
Yes |
|
3 |
29 |
No |
|
|
MLP |
26 |
7 |
Yes |
|
6 |
26 |
No |
|
|
J48 |
25 |
8 |
Yes |
|
8 |
24 |
No |
Fig 1 and 2 are the graphical representations of the simulation result.
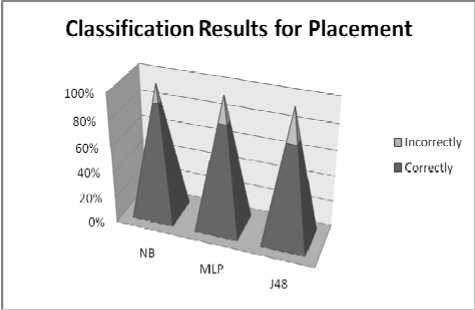
Figure 1: Results
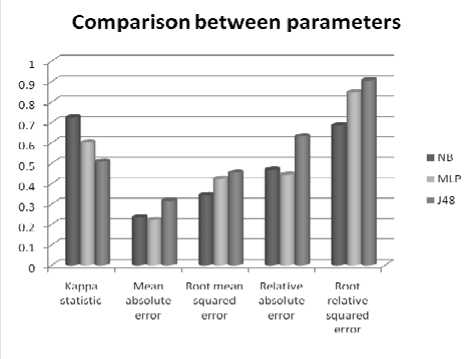
Figure 2: Comparison between Parameters
-
E. Discussion
Based on the above Fig 1, 2 and Table III, we can clearly see that the highest accuracy is 86.15% and the lowest is 75.38%. The other algorithm yields an average accuracy of 80%. In fact, the highest accuracy belongs to the Naïve Bayes Classifier followed by Multilayer Perceptron function with a percentage of 80.00% and subsequently J48 tree. An average of 52 instances out of total 65 instances is found to be correctly classified with highest score of 56 instances compared to 49 instances, which is the lowest score. The total time required to build the model is also a crucial parameter in comparing the classification algorithm.
In this simple experiment, from Table I, we can say that a single conjunctive rule learner requires the shortest time which is around 0 seconds compared to the others. MLP requires the longest model building time which is around 0.27 seconds. The Naïve Bayes Classifier and J48 takes 0 seconds.
Kappa statistic is used to assess the accuracy of any particular measuring cases, it is usual to distinguish between the reliability of the data collected and their validity [20].
The average Kappa score from the selected algorithm is around 0.5-0.7. Based on the Kappa Statistic criteria, the accuracy of this classification purposes is substantial [20]. From Fig 2, we can observe the differences of errors resultant from the training of the three selected algorithms. This experiment implies a very commonly used indicator which is mean of absolute errors and root mean squared errors. Alternatively, the relative errors are also used. Since, we have two readings on the errors, taking the average value will be wise. It is discovered that the highest error is found in j48with an average score of around 0.38 where the rest of the algorithm ranging averagely around 0.28-0.32. An algorithm which has a lower error rate will be preferred as it has more powerful classification capability and ability.
Decision trees are considered easily understood models because a reasoning process can be given for each conclusion. Knowledge models under this paradigm can be directly transformed into a set of IF-THEN rules that are one of the most popular forms of knowledge representation, due to their simplicity and comprehensibility which professor can easy understand and interpret Fig 3.
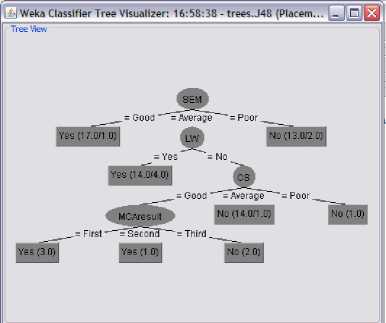
Figure 3: Decision Tree
After examining the classification tree, we can summarize the following results:
SEM = Good: Yes (17.0/1.0)
SEM = Average
| LW = Yes: Yes (14.0/4.0)
| LW = No
| | CS = Good
| | | MCAresult = First: Yes (3.0)
| | | MCAresult = Second: Yes (1.0)
| | | MCAresult = Third: No (2.0)
| | CS = Average: No (14.0/1.0)
| | CS = Poor: No (1.0)
SEM = Poor: No (13.0/2.0)
V. CONCLUSIONS
References Classification Model of Prediction for Placement of Students
- Witten, I.H. & Frank E., Data Mining– Practical Machine Learning Tools and Techniques, Second edition, Morgan Kaufmann, San Francisco, 2000.
- Quinlan, J.R., C4.5: Programs for machine learning, Morgan Kaufmann, San Francisco, 1993.
- Wu, X. & Kumar, V., The Top Ten Algorithms in Data Mining, Chapman and Hall, Boca Raton. 2009.
- J. Han and M. Kamber, Data Mining: Concepts and Techniques, Morgan Kaufmann, 2000.
- B.K. Bharadwaj and S. Pal., Data Mining: A prediction for performance improvement using classification”, International Journal of Computer Science and Information Security (IJCSIS), Vol. 9, No. 4, pp. 136-140, 2011.
- Tongshan Chang, Ed.D, Data Mining: A Magic Technology for College Recruitment‛s, Paper of Overseas Chinese Association for Institutional Research (www.ocair.org), 2008.
- U. K. Pandey, and S. Pal, A Data mining view on class room teaching language, (IJCSI) International Journal of Computer Science Issue, Vol. 8, Issue 2, pp. 277-282, ISSN:1694-0814, 2011.
- S. T. Hijazi, and R. S. M. M. Naqvi, “Factors affecting student’s performance: A Case of Private Colleges”, Bangladesh e-Journal of Sociology, Vol. 3, No. 1, 2006.
- Z. N. Khan, “Scholastic achievement of higher secondary students in science stream”, Journal of Social Sciences, Vol. 1, No. 2, pp. 84-87, 2005.
- Z. J. Kovacic, “Early prediction of student success: Mining student enrollment data”, Proceedings of Informing Science & IT Education Conference, 2010.
- Galit.et.al, “Examining online learning processes based on log files analysis: a case study”. Research, Reflection and Innovations in Integrating ICT in Education, 2007.
- S. K. Yadav, B.K. Bharadwaj and S. Pal, “Mining Educational Data to Predict Student’s Retention :A Comparative Study”, International Journal of Computer Science and Information Security (IJCSIS), Vol. 10, No. 2, 2012.
- Q. A. AI-Radaideh, E. W. AI-Shawakfa, and M. I. AI-Najjar, “Mining student data using decision trees”, International Arab Conference on Information Technology (ACIT'2006), Yarmouk University, Jordan, 2006.
- Sudheep Elayidom, Sumam Mary Idikkula & Joseph Alexander “A Generalized Data mining Framework for Placement Chance Prediction Problems” International Journal of Computer Applications (0975– 8887) Volume 31– No.3, October 2011.
- B.K. Bharadwaj and S. Pal. “Mining Educational Data to Analyze Students’ Performance”, International Journal of Advance Computer Science and Applications (IJACSA), Vol. 2, No. 6, pp. 63-69, 2011.
- Shaeela Ayesha, Tasleem Mustafa, Ahsan Raza Sattar, M. Inayat Khan, “Data mining model for higher education system”, Europen Journal of Scientific Research, Vol.43, No.1, pp.24-29, 2010.
- A. K. Pal, and S. Pal, “Analysis and Mining of Educational Data for Predicting the Performance of Students”, (IJECCE) International Journal of Electronics Communication and Computer Engineering, Vol. 4, Issue 5, pp. 1560-1565, ISSN: 2278-4209, 2013.
- M. Bray, The shadow education system: private tutoring and its implications for planners, (2nd ed.), UNESCO, PARIS, France, 2007.
- S. K. Yadav, B.K. Bharadwaj and S. Pal, “Data Mining Applications: A comparative study for Predicting Student’s Performance”, International Journal of Innovative Technology and Creative Engineering (IJITCE), Vol. 1, No. 12, pp. 13-19, 2011.
- Kappa at http://www.dmi.columbia.edu/homepages/chuangj/ kappa.
