Classification of Alzheimer Disease using Gabor Texture Feature of Hippocampus Region

Author: Prateek Keserwani, V. S. Chandrasekhar Pammi, Om Prakash, Ashish Khare, Moongu Jeon
Journal: International Journal of Image, Graphics and Signal Processing(IJIGSP) @ijigsp
Article in issue: 6 vol.8, 2016.
Free access
The aim of this research is to propose a methodology to classify the subjects into Alzheimer disease and normal control on the basis of visual features from hippocampus region. All three dimensional MRI images were spatially normalized to the MNI/ICBM atlas space. Then, hippocampus region was extracted from brain structural MRI images, followed by application of two dimensional Gabor filter in three scales and eight orientations for texture computation. Texture features were represented on slice by slice basis by mean and standard deviation of magnitude of Gabor response. Classification between Alzheimer disease and normal control was performed with linear support vector machine. This study analyzes the performance of Gabor texture feature along each projection (axial, coronal and sagittal) separately as well as combination of all projections. The experimental results from both single projection (axial) as well as combination of all projections (axial, coronal and sagittal), demonstrated better classification performance over other existing method. Hence, this methodology could be used as diagnostic measure for the detection of Alzheimer disease.
Alzheimer disease (AD), Support Vector Machine (SVM), Gabor filter, MRI images
Short address: https://sciup.org/15013983
IDR: 15013983
Text of the scientific article Classification of Alzheimer Disease using Gabor Texture Feature of Hippocampus Region
Published Online June 2016 in MECS DOI: 10.5815/ijigsp.2016.06.02
Due to the use of a number of medical imaging algorithmic techniques in disease diagnosis, repositories of medical images are increasing exponentially in last few years. This leads to the need of technique which is able to efficiently index the images on the basis of their visual content. For performing efficient indexing on large medical image repositories, primarily there is a need for good classification methodology. Classifier tries to bridge the semantic gap between the low level representation and high level concepts. It attempts to train the similarity measure on the basis of labeled data [1].
Alzheimer disease (AD) is an irreversible, progressive neurodegenerative disorder that slowly destroys memory, thinking skill and degradation of ability of performing daily tasks [2]. Some of the major symptoms of AD are memory loss, facing problem in planning and problem solving, confusion, trouble in understanding visual images, degrade in social behavior and depression [3]. AD is most common cause of dementia in elderly people. With aging of population, AD is one of the major problem of public health. Hallmark of AD is accumulation of protein fragment beta-amyloid and protein tau strands outside and inside the neurons respectively. This finally leads to death of neurons. [3].
Structural MRI is considered as a medical imaging technique for clinical assessment of AD patients [4]. Structural MRI is useful to estimate the structural changes of brain areas such as hippocampus and entorhinal cortex, which is considered as a biomarker for early detection of AD. Hippocampus volume reduction is key bio-marker for AD [5]. Several works have been done for automatic AD detection on the basis of volumetric analysis, voxel-based morphometry (VBM) and region of interest (ROI). Classification of AD on the basis of visual features is not yet been fully explored. The proposed work is about classification of AD subject from normal controls on basis of visual features of hippocampal region.
Texture feature is one of the important visual features in medical domain. Texture features have potential to consider fine details present in images [6]. Gabor filter is one of the widely used texture feature descriptor. One of the important property of Gabor filter is their ability to capture the details of on image at various frequency (scale) and orientation. Gabor filter provide optimal joint space and frequency resolution [7].
The objective of this paper is to evaluate the classification performance of Gabor texture feature on hippocampus region of structural 3d MRI images for Alzheimer disease. Rest of the paper is organized as follows: Section II presents the literature review. Section III presents the methodology adopted and Section IV describes experiments and results. Conclusions of the work have been given in Section V.
-
II. Related Works
In literature, some works have already been done which uses visual content of the structural MRI for Alzheimer disease classification and diagnosis. In [8] authors have applied 2D-Discrete Cosine Transform (DCT) on slice by slice basis on segmented gray matter, white matter and cerebrospinal fluid followed by classification using support vector machine (SVM) and probability of class belongings produced by classifier is combined with Euclidean distance for ranking purpose. In [9] authors used combination of textual information such as cognitive scores and biomarkers with visual feature and relevance feedback. DCT and discrete wavelet transform (DWT) were used for global texture representation, local binary pattern (LBP) was used for local visual feature and SVM was used for classification. In [10] authors used Laguerre Circular Harmonic Function coefficient as feature descriptor computed on hippocampus region. Pre-classification on the basis of cerebrospinal fluid (CSF) percentage in normalized hippocampus region was proposed to improve the result. In [11] authors computed visual feature from hippocampus and posterior cingulate cortex by using scale-invariant feature transform (SIFT) and circular harmonic function (CHF). In [12] authors used CHF visual feature descriptor and volume of CSF pixel of hippocampal region. Classification of CHF visual feature into classes: Normal Control, Mild Cognitive Impairment and Alzheimer disease was done by using SVM classifier. CSF volume has been classified using Bayesian classifier. These two classification results are further used to train a SVM classifier.
In [13] authors found that among four frequency used two highest frequency used in Gabor filter bank have better texture acceptance rate in MRI image of brain. In [14] Gabor filter has been implemented on 2d MR images at three scales and eight orientations and for classification of Alzheimer disease SVM has been used. This method has given good classification rate. In [15] a method for
Alzheimer disease detection in single photon emission computed tomography (SPECT) using 2d Gabor wavelet has been proposed. In this method the Gabor filter texture descriptor dimension is reduced by PCA and then classification is performed by using SVM.
-
III. Methodology
This section describes the details of the proposed method. The proposed method uses mean and standard deviation of magnitude of Gabor filter response to extract dominant features and a simple support vector machine (SVM) is used for classification between Alzheimer disease and normal control. The proposed methodology consists of following steps and these steps were described in subsections of this section:
-
1. All MRI images were spatially normalized to MNI/ICBM atlas space.
-
2. Hippocampus region images were extracted by masking the MRI images with hippocampus mask.
-
3. Applying Gabor filter bank, on three scales and eight orientations were applied to extract out Gabor texture feature.
-
4. Mean and standard deviation of magnitude of Gabor response were used for texture representation.
-
5. Linear support vector machine classifier has been used for classification between Alzheimer disease and normal control using Gabor texture representation.
For classification between Alzheimer disease and normal control, four feature vectors were tested separately. Each texture feature vector represents the Gabor texture feature along axial projection, coronal projection, sagittal projection and combination of all projections. The schematic diagram for proposed methodology is shown in Fig.1. Steps of the proposed method are further explained in following subsections.
-
A. Gabor filter
Gabor filter is a linear filter. Two dimensional Gabor filter [16] was extended by using the concept of onedimensional Gabor filter. Gabor filter is modulation of complex sinusoidal wave with Gaussian envelope. Two dimensional Gabor filter is defined as [16]:
2 - ( f 02 x '2 + f 0 2 y '2 )
-
g(x, y; f0,θ)= f0 e γ2 η2 ej2πf0x'
πγη x' =xcosθ+ysinθ(2)
y' = -xsinθ+ y cosθ(3)
where, f is the central frequency of the filter, θis the rotation angle between the direction of the sinusoidal wave and the x-axis of the spatial domain, y is the sharpness along major axis and n is sharpness along minor axis. Gabor filter bank for s frequencies and k orientations can be configured by varying f and 6 in equation (1), (2) and (3) as:
e = p n , p = {0,1,2...., k - 1} (4)
k f0 = q-1 fmax, q = {0,1,..., ^ -1} (5)
where, f is the central frequency of filter at highest frequency.
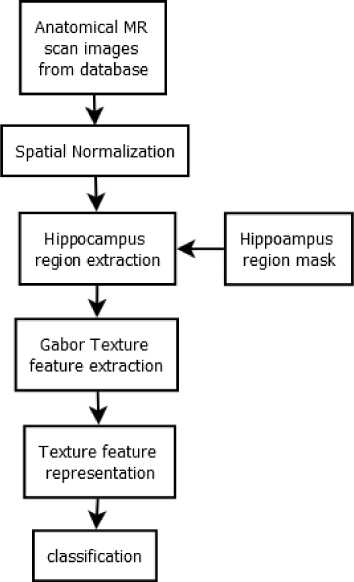
Fig.1. The proposed method
When applying Gabor filter several parameters must be set properly for good results. Influenced parameters are central frequency of the highest frequency ( f ), number of scale ( m ), number of orientation ( n ), values of Y and n ratio between the central frequency of adjacent filter ( k ). In this work, octave spacing was considered. As used in [14], the number of scales and number of orientations for this study were 3 and 8 respectively. Values of y and n were obtained from [16]. Their interdependence is represented [16] by the following equations:
Y =
The value of q [16] is calculated according to the equation:
1 V - ln P 2 n =-- п П
2 n
Where p1 = p2 = p = 0.5. This value of p has been experimentally verified and found that information loss is moderate even if important content falls between the filters. Thus in this work, p = 0.5 was adopted.
The maximum frequency [7] is calculated indirectly from у according to the following equation:
f max
Y
(Vln2
21 Y + ~ I
V
-
B. Spatial Normalization
Brain size varies from subject to subject. Thus, each individual brain image must be spatially normalized to reduce the variability between individual brain images. For normalization, SPM8/VBM8 toolbox was used which run on MATLAB. The voxel-based morphometry (VBM) toolbox utilizes DARTEL procedure to normalize MRI images into MNI/ICBM atlas space.
-
C. Hippocampus Region Extraction
For hippocampus region extraction, one has to make a mask. This mask is able to extract the hippocampus region information and skip all other details of the image. For creation of mask MarsBar tool has been used. Hippocampus region standard Automated Anatomical Labeling (AAL) ROI has been downloaded from url AAL ROI contains ROIs in MarsBar format that are defined on single brain in MNI template [17]. With the help of the standard ROI a box ROI is created from MarsBar tool for both hippocampus separately. Final mask is obtained by combining left hippocampus and right hippocampus masks.
-
D. Gabor Feature Extraction
Gabor filter at scale m and orientation n is represented by G . For an 2d input image, I ( x , y ) of dimension X and Y , convolving input image with Gabor filter in spatial domain, gives Gabor response GT ( x , y ) . GT is a complex coefficient contains two parts: real part Re( GT ) as well as imaginary part Im( GT ) . The magnitude and phase of Gabor response ( g ) is calculated for each slice as follows:
g (GT ) = JRe2(GT ) + Im2(GT )
mn mn mnmn
( Im( GT ) )
ф (GT ) = arctan —-—mn^
mn mn ( Re( GT ) )
mn
Gabor filter on different frequency behave as scaled version of each other. Higher frequency obtains finer detail. Thus, applying Gabor filter at different scale results in computation of finer-to-course details of MRI images. But the calculated Gabor features is of high dimension. Thus, there is a need for the method for reduction of dimension. For this the mean and standard deviation statistics has been used. Feature vector was created by using mean and standard deviation of magnitude of Gabor filter response.
-
E. Texture Feature Representation
To reduce dimension, the mean and standard deviation of magnitude of Gabor filter response at each slice for a particular scale and orientation of Gabor filter has been considered as feature. In this study, four feature vectors have been taken into account, corresponding to axial, coronal, sagittal and combination of all projections. If the numbers of slice along axial, coronal and sagittal projection are t , t and t respectively, then the corresponding feature vectors are:
-
V 1 = [ A )0 a (1) , $ 00 a (1) , M 01 a OX $ 01 a (1), • • • , M 27 a (1) , $ 27 a (1),111, M 27 a ( t 1 ), $ 27 a ( / 1 )](11)
-
V 2 = [ M 00 c (1) , $ 00 c (1) , M 01c (1) , $ 01 c (1), •'', M 27 c (1) , $ 27 c (1),1", M 27 c ( t 2 ), $ 27 c ( t 2 )] (12)
-
V 3 = [ A )0 5 (1) , $ 00 5 (1) , M 01 5 (1) , $ 01 5 (1), ’'', M 26 5 (1) , $ 26 5 (1),'' •’ M 27 5 ( t 3 ), $ 27 5 ( t 3 )](13)
Feature vector for the combination of all projections (i.e. axial, coronal and sagittal) is:
V 4 = [ M 00 a (1) , $ 00 a (1) , M 01 a (1) , $ 01 a (1),1'' , M 27 a (1) , $ 27 a (1),'11 , M 27 a (0, $ 27 a ( t 1 ),
M 00c (1) , $ 00 c (1) , M 01 c (1) , $ 01 c (1), •''’ M 27 c (1) , $ 27 c (1),111, M 27 c ( t 2 ), $ 27 c ( t 2 ), M 005 (1), $ 00 5 (1) , M 01 5 (1), $ 01 5 (1) ,-, M 26 5 ( 1), $ 26 5 ( 1) ,-, M 275 ( ^ 3 ), $ 27 5 ( ^ 3 )]
where, m (t) , M (t) and M (t) represent mean of mna mnc mns magnitude of Gabor response at scale m , orientation n along axial, coronal and sagittal projections respectively at slice t . $ (t) , $ (t) and $ (t) represent mna mnc mns standard deviation of magnitude of Gabor response at scale m , orientation n along axial, coronal and sagittal projections respectively at slice t .
-
F. Classification
Support vector machine (SVM) [21] has been used for classification. It is a supervised machine learning technique. Suppose set of training data is { V , V ,...... V } , V e Rd , with label of classes
-
12 m i
{Lx, L2,......L }, L. e {0,1}. SVM finds a hyper-plane to classify the data between two classes (Alzheimer disease and normal control). SVM optimizes the selection of hyper-plane in such a way that it maximizes the distance between the hyper-plane and data point of both classes which is nearest to hyper-plane. In this work, linear kernel function is used for SVM classification.
In this work, the SVM was trained with linear kernel using 5-fold cross validation technique. The dataset was randomly divided into 5 disjoint subsets of approximately of equal size. Among five subsets, four sets were used for training the SVM and the remaining one was used for validation. This procedure was repeated five times by considering each subset at a time for validation and remaining four for training. For each fold a confusion matrix was created. All confusion matrixes were summed up to create a final confusion matrix. For performance evaluation of classification results, used metrics were: accuracy, sensitivity and specificity. These matrices are defined as –
( TP + TN )
Accuracy =-----------------
( TP + TN + FP + FN )
TP
Sen5itivity =----------- ( TP + FN )
TN
Specificity =---------- ( TN + FP )
where, if AD is classified as AD it is known as true positive (TP) i.e. correct classification of Alzheimer disease. If Normal Control (NC) is classified as NC then it is known as true negative (TN) i.e. correct classification of normal control. If AD is classified as NC then it is known as false negative (FN). If NC is classified as AD then it is known as false positive (FP).
Accuracy is a measure of subjects correctly classify as positive and negative. Sensitivity refers to the proportion of subjects who have the target condition (Alzheimer disease) and give positive test result. Specificity refers to the proportion of subjects without the target condition give negative test result [18].
-
IV. Experiments and results
This section describes the details of the experimental setup and experiments along with their results. This section is comprised of three sub-sections: Experimental data, which describes the details of experimental data we have used; details of the experiments performed and their quantitative results.
-
A. Experimental Data
To perform experiments, we have used publicly available T1–weighted anatomical magnetic resonance image dataset from Open Access Series of Imaging Studies (OASIS) [19]. It contains cross-sectional data of MRI scans. It provides 416 brain scans of healthy control and Alzheimer disease subjects. Among them 198 scans of subject whose age is equal or above than 60 either has Clinical Dementia Rating (CDR) zero or non-zero. 100 MR scans whose CDR is greater than zero and age equal or above than 60, has been reported as diagnosed from very mild to moderate AD.
In this study, images in the dataset have been used which are averaged, co-registered image of the individual scan image in single session in the native acquisition space is resampled to 1 mm isotopic voxels. Among 198 scans, 52 scans were extracted for study. On the basis of CDR, subjects from OASIS dataset were taken for this study. Among 52, 26 were Alzheimer disease and 26 were normal control. The Alzheimer disease and normal control subjects were selected on the basis of CDR and were make sure that the mean age are same (statistically significance for 2-sample t-test test p>0.05). In selected dataset, 26 MR images have CDR = 0 (i.e. normal control) and 26 images have CDR > 1 (i.e. Alzheimer disease) as in [20]. The attribute of included subjects are summarized in table 1:
Table 1. Included subject attribute summary
|
Normal Control |
Alzheimer Disease |
|
|
Number of subject |
26 |
26 |
|
Average age |
78.19 ± 7.01 |
78.5 3 ± 7.24 |
|
CDR |
0 |
1 and 2 |
-
B. Experiments
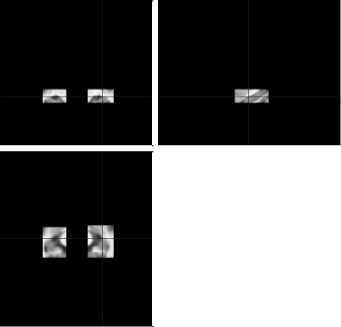
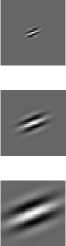
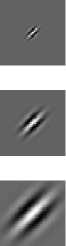
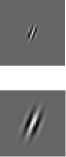
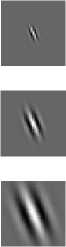
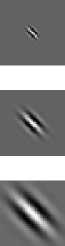
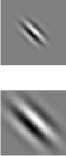
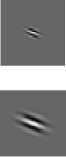
All MRI images were spatially normalized into MNI/ICBM atlas space using VBM/SPM8 toolbox in MATLAB. Then, hippocampus region extraction was done and the masked image is depicted in Fig 2. The real and imaginary components of Gabor filter bank is represented in Fig 3. In this study, classification performance of Gabor texture feature by using accuracy, sensitivity and specificity. Testing was done by using 5– fold cross validation.
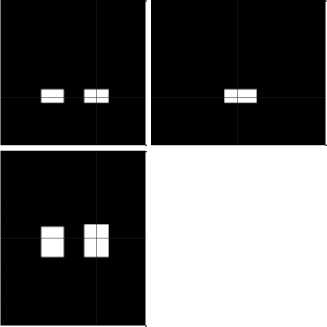
Fig.2. (a) Mask for hippocampus (b) Hippocampus region extracted image
(b)


(a)


II
(a)
I


(b)
Fig.3. (a) Real part of Gabor filter (b) Imaginary part of Gabor filter
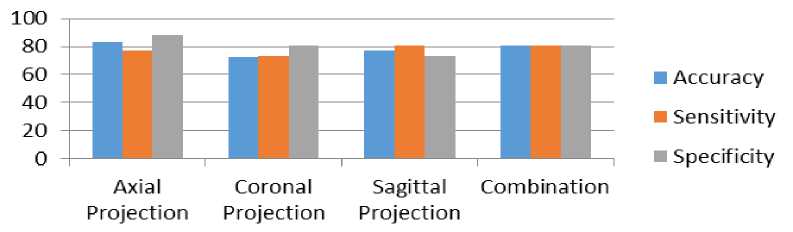
Fig.4. Comparison of performance of classifier along each projection and combination of it
Table 2. Confusion matrix
|
Fold 1 |
Fold 2 |
Fold 3 |
Fold 4 |
Fold 5 |
SUM |
|||||||
|
Axial |
Г 5 |
0 к |
Г 4 |
1 к |
Г 4 |
2 к |
Г 5 |
0 к |
Г 5 |
0 к |
Г 23 |
3 к |
|
projection |
к 1 |
4 ) |
к 1 |
4 ) |
к 3 |
2 ) |
к 1 |
4 ) |
к 0 |
6 ) |
к 6 |
20 ) |
|
Coronal projection |
Г 5 |
0 к |
Г 4 |
1 к |
Г 3 |
2 к |
Г 5 |
1 к |
Г 4 |
1 к |
Г 21 |
5 к |
|
к 0 |
5 ) |
к 1 |
4 ) |
к 3 |
3 ) |
к 1 |
4 ) |
к 2 |
3 ) |
к 7 |
19 ) |
|
|
Sagittal projection |
Г 2 |
3 к |
Г 3 |
2 к |
Г 4 |
1 к |
Г 5 |
0 к |
Г 5 |
1 к |
Г 19 |
7 к |
|
к 0 |
5 ) |
к 0 |
5 ) |
к 1 |
4 ) |
к 4 |
1 ) |
к 0 |
6 ) |
к 5 |
21 ) |
|
|
Combination |
Г 6 |
0 к |
Г 3 |
2 к |
Г 4 |
1 к |
Г 4 |
1 к |
Г 4 |
1 к |
Г 21 |
5 к |
|
к 2 |
3 ) |
к 0 |
5 ) |
к 1 |
4 ) |
к 1 |
4 ) |
к 1 |
5 ) |
к 5 |
21 ) |
|
-
C. Results
Table 2 shows the confusion matrix for 5-fold cross validation and the sum of all confusion matrices. This table shows the confusion matrix for each feature vector along axial, coronal, sagittal and the combination of all projections.
Table 3 shows the performance of classification along axial, coronal, sagittal and combination of all projections through accuracy, sensitivity and specificity. The corresponding comparison is also depicted through bar char in Fig. 4. Table 4 shows the performance comparison of the proposed method with other state of the art methods.
Table 3. Included subject attribute summary
|
Accuracy (%) |
Sensitivity (%) |
Specificity (%) |
|
|
Axial Projection |
82.69 |
76.92 |
88.46 |
|
Coronal Projection |
72.92 |
73.07 |
80.76 |
|
Sagittal Projection |
76.92 |
80.76 |
73.07 |
|
Combination |
80.76 |
80.76 |
80.76 |
Table 4. Performance comparison of the proposed method with other method
|
Accuracy (%) |
Sensitivity (%) |
Specificity (%) |
|
|
Ahmed et al. [12] |
85.05 |
65.72 |
94.45 |
|
Axial Projection |
82.69 |
76.92 |
88.46 |
|
Coronal Projection |
72.92 |
73.07 |
80.76 |
|
Sagittal Projection |
76.92 |
80.76 |
73.07 |
|
Combination |
80.76 |
80.76 |
80.76 |
-
V. Conclusion
In this research, we attempted to classify Alzheimer disease and normal control using Gabor filter texture feature for hippocampus region. The results show consistently significant findings from accuracy, sensitivity and specificity measures in contrast to earlier research [12]. Hence, proposed Gabor filter based classification would be a viable mechanism for the detection of Alzheimer disease
References Classification of Alzheimer Disease using Gabor Texture Feature of Hippocampus Region
- A. Kumar, J. Kim, W. Cai, M. Fulham and D. Feng, "Content-Based Medical Image Retrieval: A Survey of Applications to Multidimensional and Multimodality Data," Journal of Digital Imaging, vol. 26, pp. 1025-1039, 2013.
- Alzheimer disease fact sheet, Alzheimer disease education and retrieval center, National Institute of health, NIH publication number: 11-6423, 2012.
- Alzheimer's Disease Facts and Figure, Alzheimer's Association, vol. 10, 2014.
- G. B. Frisoni, N. C. Fox, C. R. Jack, P. Scheltens and P. M. Thompson, "The clinical use of structural MRI in Alzheimer disease," Nature Reviews Neural, vol. 6, pp. 67-77, 2010.
- N. Villain, B. Desgranges, F. Viader, V. De La Sayette, F. Mézenge, B. Landeau, J. C. Baron, F. Eustache and G. Chételat, "Relationships between Hippocampal Atrophy, White Matter Disruption, and Gray Matter Hypometabolism in Alzheimer's disease," The Journal of Neuroscience, vol. 28, pp. 6174-6181, 2008.
- C. B. Akgül, D. L. Rubin, S. Napel, C. F. Beaulieu, H. Greenspan and B. Acar, "Content-Based Image Retrieval in Radiology: Current Status and Future Directions," Journal of Digital Imaging, vol. 24, pp. 208-222, 2011.
- F. Bianconi and A. A. Fernández, "Evaluation of the effects of Gabor filter parameters on texture classification," Pattern Recognition, vol. 40, pp. 3325-3335, 2007.
- M. Agarwal and J. Mostafa, "Image Retrieval for Alzheimer's Disease Detection," Medical Content-Based Retrieval for Clinical Decision Support, vol. 5853, pp. 49-60, 2010.
- M. Agarwal and J. Mostafa, "Content-Based Image Retrieval for Alzheimer's Disease Detection," Content-Based Multimedia Indexing (CBMI), pp. 13-18, 2011.
- M. Mizotin, J. Benois-Pineau, M. Allard and G. Catheline, Feature-based brain MRI retrieval for Alzheimer disease diagnosis, ICIP, pp. 1241-1244, 2012.
- O. Ben Ahmed, J. Benois-Pineau, C. B. Amar, M. Allard and G. Catheline, "Early Alzheimer disease detection with bag-of-visual-words and hybrid fusion on structural brain MRI," Content-Based Multimedia Indexing (CBMI), pp. 79-83, 2013.
- O. Ben Ahmed, J. Benois-Pineau, M. Allard, C. B. Amar and G. Catheline, "Classification of Alzheimer's disease subjects from MRI using hippocampal visual features," Multimedia Tools and Applications, vol. 74, pp. 1249-1266, 2015.
- R. Roslan and N. Jamil, "Texture Feature Extraction using 2-D Gabor Filters," ISCAIE, pp. 173-178, 2012.
- U. Bagci and L. Bai, "Detecting Alzheimer Disease in Magnetic Resonance Brain images Using Gabor Wavelets," 15th IEEE conference on Signal Processing and Communication Applications, pp. 1-4, 2007.
- P. Padilla, J. M. Górriz, J. Ramirez, R. Chaves, F. Segovia, I. Alvarez, D. Salas-González, M. López and C. G. Putonet, "Alzheimer's disease detection in functional images using 2D Gabor wavelet analysis," Electronics letters, vol. 46, pp. 556-558, 2010.
- J. Llonen, J. K. Kamarainen and H. Kalviainen, "Efficient computation of Gabor features," Research Report 100, Lappeenranta University of Technology, Department of Information Technology, 2005.
- N. Tzourio-Mazoyer, B. Landeau, D. Papathanassiou, F. Crivello, O. Etard, N. Delcroix, E. Mazoyer and M. Joliot, "Automated Anatomical Labeling of Activations in SPM Using a Macroscopic Anatomical Parcellation of the MNI MRI Single Subject Brain," NeuroImage, vol. 15, pp. 273-289, 2002.
- C. M. Florkowski, "Sensitivity, Specificity, Receiver-Operating Characteristic (ROC) Curves and Likelihood Ratios: Communicating the Performance of Diagnostic Tests," The Clinical Biochemist Reviews, vol. 29, pp. 583-587, 2008.
- D. S. Marcus, T. H. Wang, J. Parker, J. G. Csernansky, J. C. Morris and R. L. Buckner, "Open Access Series of Imaging Studies (OASIS): Cross-sectional MRI Data in Young, Middle Aged, Nondemented and Demented Older Adults," Journal of Cognitive Neuroscience, 19, pp. 1498-1507, 2007.
- R. Manni, Y. H. Yang and S. Kalra, Voxel based texture analysis of the brain, PloS one, 2015, DOI: 10.1371.
- A. Khare, M. Khare and R. K. Srivastava, Dual tree complex wavelet transform based multiclass object classification, 12th International Conference on Machine Learning and Applications (ICMLA), pp. 5010-506, 2013.
