Classification of EEG signals in a seizure detection system using dual tree complex wavelet transform and least squares support vector machine

Author: Dattaprasad Torse, Veena Desai, Rajashri Khanai
Journal: International Journal of Image, Graphics and Signal Processing @ijigsp
Article in issue: 1 vol.10, 2018.
Free access
Epilepsy is a chronic brain disorder which affects normal neuronal activity of the brain. It results in sudden repeated episodes of higher electrical activity due to sensory disturbance. Electroencephalogram (EEG) plays an important role in the diagnosis of epilepsy. Currently, manual observation of EEG is done by experienced neurologist to diagnose epilepsy and related disorders. However, automated system is a promising method for seizure detection and diagnosis. The EEG signals recorded from the patient’s scalp are preprocessed, and classified as seizure and non-seizure based on the extracted signal features. The procedure significantly eliminates the error involved in manual observation. Due to non-linear nature of EEG, joint time-frequency methods are used to analyse the EEG signals. This paper proposes a EEG feature extraction technique using Dual Tree Complex Wavelet Transform (DTℂWT) to overcome the problem of shift variance in DWT. The estimation of improved multi-scale Permutation Entropy (IMPmEn) is done for the level-3 subband of DTℂWT. The performance of the Least Squares Support Vector Machine (LS-SVM) classifier is tested using these features and highest classification accuracy of 99.87 % is obtained on the real time EEG database.
Dual Tree Complex Wavelet Transform, improved multiscale Permutation Entropy, Least Squares Support Vector Machine
Short address: https://sciup.org/15015933
IDR: 15015933 | DOI: 10.5815/ijigsp.2018.01.07
Text of the scientific article Classification of EEG signals in a seizure detection system using dual tree complex wavelet transform and least squares support vector machine
Published Online January 2018 in MECS
The Epilepsy is a chronic disorder of the nervous system, affecting 1% of the population worldwide [1]. It is characterized by the anomalous harmonized firing of a large number of neurons. Currently, antiepileptic drugs is the main course of treatment of epilepsy. The efficacy of antiepileptic drugs in patients with refractory epilepsy is a challenging issue for neurologists as the appearance of seizures in this type of epilepsy keeps changing from one form to another. The situation worsens when the untreated epilepsy becomes a root cause for the repeated seizure occurrence. For the care takes of epilepsy affected children or adults the challenging task is to avoid head injuries due to the random nature of seizure.
A large number of patients with the need for continuous observation of seizure conditions, several automated methods for epileptic seizure recognition have been developed using signal processing and statistical techniques [2]. In seizure detection systems, the challenge is to identify and employ the most efficient signal processing algorithm through many comparisons for the specific application. The improvement in Information Transfer Rate (ITR) is also a challenging task. The ITR of the current Brain Computer Interface (BCI) systems is up to 25 b/min [3]. The use of computationally efficient signal processing algorithms can improve the current ITR.
The research on diagnosis of epilepsy and other brain disorders using EEG was started in the year 1970. In the huge volumes of EEG data recorded from the patient’s scalp, it is repetitious and time consuming task to manually observe these signals for diagnosis. With the advent of powerful signal processing tools the development of automated system for the analysis of the EEG signals became a demanding area of research. The algorithms help in eliminating errors in diagnosis using manual observation. The joint time-frequency techniques of EEG signal analysis are powerful due to the fact that the signals are non-linear, non stationary and nonGaussian [4]. A scheme based on approximate entropy of subbands of Discrete Wavelet Transform (DWT) to detect seizures with Artificial Neural Network (ANN) classifier is presented in [5]. Many authors have developed methods to decompose the EEG signal using time, frequency, forms joint time-frequency and nonlinear techniques and classified the seizure and non-seizure signals using machine learning techniques. This includes Short Time Fourier Transform [6], wavelet transform [7], Empirical Mode Decomposition [8], wavelet entropy features with time delay neural networks and probabilistic neural networks [9]. When compared the performance of all the joint-time frequency based techniques, the WT is found to be the most suitable as it derive useful information from the non-stationary EEG signal. These WT techniques are mostly based on either DWT or Wavelet Packet Decomposition (WPD) [10]. However, a careful study of the fundamental difference between these two transforms is to be done define applicability in signal decomposition. The first problem is associated with the oscillations of the wavelet coefficients to the right and left of singularities as wavelets are band-pass functions. The shift variance is the second issue in which the wavelet-domain processing is complicated due to shifted singularities. The substantial aliasing due to wide spacing of the wavelet coefficients and lack of dimensionality further complicated the processing of multichannel signals. In these problems complex wavelets can provide potentially significance performance improvement over DWT .
In this paper, a method is presented based on entropy feature extraction of sub bands obtained from Dual Tree Complex Wavelet Transform (DTℂWT) [11] and classification of the features using Least Squares Support Vector Machine (LS-SVM) [12]. The improved multiscale permutation entropy parameters of 2nd and 3rd level sub bands of DTℂWT are computed for seizure and normal EEG data described in the section II. The feature vector is used to train and test classification performance of LS-SVM with three different kernels function parameters namely linear, polynomial, and RBF. Fig. 1 shows the block diagram of the system. The system proposed works in the framework of BCI with primary task of recording EEG signals using 10-20 international standard system. The offline processing builds a decision support system to test the online recorded signals. The primary block are feature extraction and classification of EEG signals into seizure and normal signals. The database of features build after performing experiments on training signals helps in recognising seizure condition from test EEG signals.
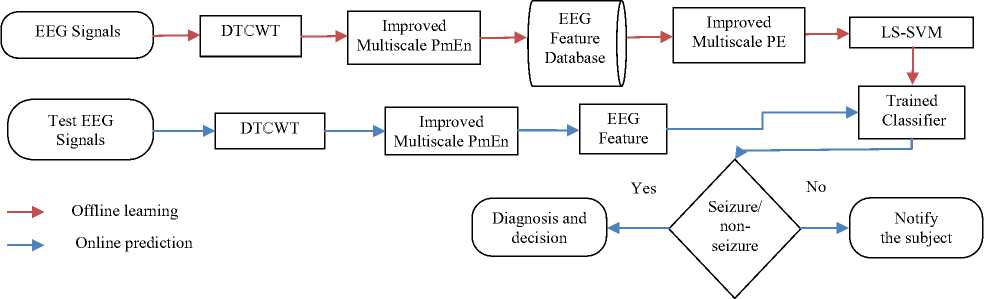
Fig. 1 Block diagram of the proposed method
The remaining content is organized as follows: the section II presents data set used for classification, the DTℂWT technique and entropy feature. Section III discusses classification techniques. The implementation and results are presented in section IV. The section V concludes the work.
-
II. Dataset and Analysis Technique
The seizure detection system requires two sets of data. One for training and second to test the system. The following section presents the use of real time EEG data from a total of twenty five epileptic patients. The data set includes EEG data from fifteen male and ten female patients. Another data set was collected from twenty five normal subjects. The subjects belonged to the age group of 12 to 24 years (mean age ± standard deviation: 18.15 ± 1.02 years). The neurologist and subjects had given written consent to participate in the experimentation.
A. Dataset
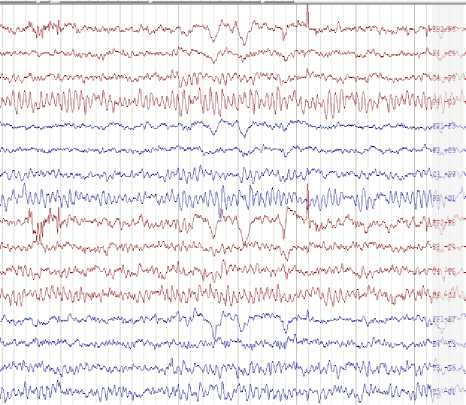
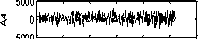
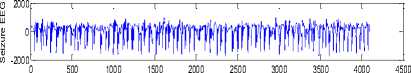
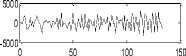
Fig.2. Sample 16-channel EEG Data acquired from RMS EEG machine
The recorded EEG signal from 16 electrodes is shown in Fig. 2. The acquisition is done using RMS (Recorders and Medicare Systems) EEG-32 machine [13]. The analysis of the single channel recorded signal is done for the maximum signal recording length of 23 seconds. The recordings are pre-processed to filter noise due to eye movement using adaptive filter [14]. The electrodes were placed on scalp of subjects as per the international 10–20 standard. The duration of EEG considered for the experiment is of 4 minute with sampling rate of 250/s.
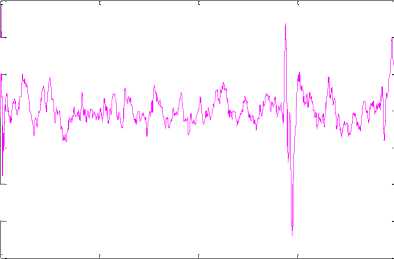
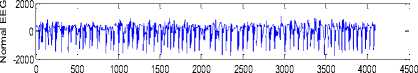
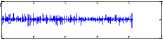
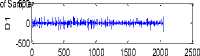
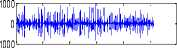
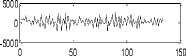
Fig. 3 shows typical 2000 samples epileptic and normal EEG signals from a single channel. The signals are divided into three epochs of 500, 1000, 2000 data samples to find the computational complexity of DTℂWT. The classifier has been separately tested for the varied signal length to assess the computational complexity in hardware implementation of the system.
H ( n ) = E h (2 n - m ) s ( m ) (1)
m
L ( n ) = E l (2 n - m ) s ( m ) (2)
m
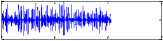
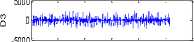
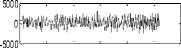
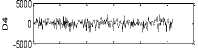
Fig. 4 shows the approximate (A1-A5) and detailed (D1-D5) coefficients from a normal EEG signal using DWT. The Five levels of similar coefficients for high and low pass filters for seizure EEG signals are shown in Fig. 5. The smoothing feature of the Daubechies wavelet of order 2 made it more suitable to detect changes of the EEG signals. Therefore, in this work the wavelet coefficients were computed using the Daubechies wavelet of order 2.
-800 0
Epileptic EEG Data
-200
-400
-600
Data Samples
(a)
mber of Sa5m0p0l
0 500 1000 1500 2000 2500
Number of Samples
-5000
-500
-5000
0 200 400 600 800 1000 1200
Number of Samples
5000 0
-5000
0 100 200 300 400 500 600
Number of Samples
-5000
0 50 100 150 200 250 300
Number of Samples
-5000
0 500 1000 1500 2000 2500
Number of Samples
-1000 0
Number of Samples
-5000
0 200 400 600
Number of Samples
-5000
Normal EEG Data 700
SA^I^'^p^S^^^^
0 100 200 300
Number of Samples
0 50 100 150
Number of Samples
-5000
0 50 100 150
Number of Samples
Data Samples
(b)
Fig.3. Sample EEG Data (a) epileptic (b) normal.
Fig.4. Approximate and detailed coefficients from DWT of Normal Signal.
5000 umb
-5000
0 500 1000 1500 2000 2500
Number of Samples
Number of Samples
-5000
0 200 400 600 800 1000 1200
Number of Samples
0 200 400 600 800 1000 1200
B. Dual Tree Complex Wavelet Transform (DTℂWT)
The DWT is a technique that represents a nonlinear EEG signal using multiscale properties. The conventional DWT has a disadvantages of wavelet oscillations, shift variance and aliasing effects. In DWT a signal x is represented by the n sampling points and h represents high-pass and l represent low-pass filters, H and L denote the DWT coefficients of these two sub bands (high-pass and low-pass). Then define: [15]
Number of Samples
0 100 200 300 400 500 600
Number of Samples
-5000
0 100 200 300 400 500 600
Number of Samples
0 50 100 150 200 250 300
Number of Samples
Number of Samples
0 50 100 150 200 250 300
Number of Samples
Number of Samples
Fig. 5 Approximate and detailed coefficients from DWT of Seizure Signal.
To improve advanced property of directional selectivity which is a potential disadvantage of DWT, a dual-tree ℂWT has been proposed, which is implemented by two distinct 2-channel filter banks. An arbitrary selection of the scaling and wavelet filters cannot be done in the dualtree [16]. In one tree, the wavelet and scaling filters should produce a wavelet and scaling function, which are approximate Hilbert transforms of those produced by a not her tree [17]. In this way, the wavelet generated from both trees and the complex- valued scaling function are approximately analytic, and are known DTℂWT.
Fig. 6 shows the flow diagram of the forward 1D DTℂWT for 2-decomposition scales. The real and imaginary parts of complex wavelet parameters are computed by using a dual tree of wavelet filters. The transform is directionally selective in two and higher dimensions and approximate shift invariant, which is of prime importance in the application of nonstationary and nonlinear signal analysis such as an EEG signal. A transform with a redundancy factor of 21 has been considered in this work for 1-D EEG signals. This redundancy is much lower than the under-decimated DWT. In addition, the use of entropy based feature to represent the oscillations in the signal is an optimum choice in EEG signal analysis. In this work, the DTℂWT algorithm is used to extract the sub bands from the input EEG signals. An improved multiscale permutation entropy is computed for 2nd and 3rd sub bands. The selection of features from 2nd and 3rd sub bands is made based on the highest oscillatory information content in the features. Thus a very constructive feature set is formed to classify the seizure and normal signal in the seizure detection system. The LS-SVM classifier is tested using the extracted entropy features from the signals. The computational complexity is considered for both decomposition and entropy calculation algorithms. The speed of the operation in this case is higher as compared to the computation of other entropy parameters such as permutation entropy, sample entropy, K-nearest neighbour entropy and fuzzy entropy. This is because of the fact that for 2nd and 3rd level sub bands the algorithm computes a single entropy feature. In the literature, it has been suggested to use a small number of middle scales of coefficients as the input to a classifier for seizure detection system. In this work we have selected only a few intermediate scales as the lowest scales have missed fine details in the signal whereas the many detailed scales have frequently the noise.
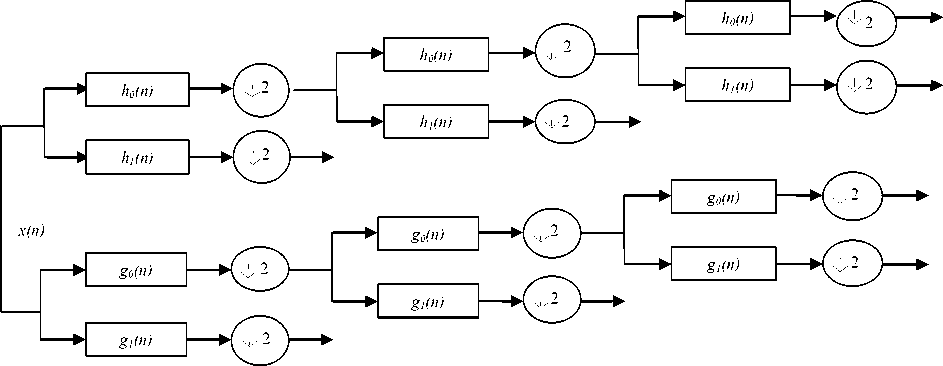
Fig. 6 Flow diagram of 1D DTℂWT.
The algorithm for EEG signal classification is represented below:
-
1. Obtain the input normal and seizure EEG signal x(n) where n e [1, N ].
-
2. Decompose the signal using forward 1D DTℂWT for number of scales J = 5. Let us define the output be y {2} and y {3}, for scales 2 and 3, respectively.
-
3. Obtain the improved multiscale permutation entropy (mPmEn) for the 2nd and 3rd sub bands of DTℂWT.
-
4. Use the features with p ≤0.05 to classify the signals using LS-SVM classifier.
-
C. Improved Multiscale Permutation Entropy
Permutation Entropy (PmEn) is a vastly used fast method to compute irregularity in nonlinear signals. Multiscale PmEn (MPmEn) is a technique of evaluating the PmEn for a number of coarse-grained sequences indicating temporal scales [18]. In MPmEn, first a coarse- graining process is applied to the EEG signals. We have considered an EEG sequence of length 4096 sample as {x , x , ..., x } . Within the non-overlapping window of increasing the length τ, known as scale factor, multiple successive coarse-grained versions of signal are obtained by averaging the signal points. The course-grained EEG signal element yT. is defined as [18]:
T 1 j T
-
У, =- ^ xi 1 ^ j ^
j T r-n-n,--!-!
N
T
where |_ a J indicates the largest integer not greater than a and
N
T
is length of coarse-grained EEG signal. In the second step the PE for each coarse-grained EEG signal is calculated so that the achieved values can be plotted as a function of the scale factor τ [18].
The conventional MPmEn has disadvantage of being non symmetric which results in unstable measure of entropy. Hence, to obtain more reliable and stable results, the use of improved MPmEn is suggested to decrease the variability of entropy measures over long temporal scales [18]. Based on Costa’s algorithm [19], the coarse-graining of MPmEn is defined in which the first step includes coarse-graining process to reduce the time series length. This is achieved because a sub-sampling like process is needed to inspect the deeper temporal scales. This results in an inaccurate estimation of entropy when the EEG signal samples of short period i.e. 500 samples. To solve the issue of short signals, an improved MPmEn (IMPmEn) is used which eliminates the effect of aliasing. The IMPmEn is calculated in two steps as explained below:
-
1. The first steps generates
-
2. PE of each of zz (i = 1,..., т ) is separately computed for defined scale factor τ and embedding dimension d. The average PE is then computed as:
т - 1
z, = {y ^ ),y( 2 ),...} where У т ) = f = 0 f + ' 'j 1) . In
,x , , T
( т )
IMPmEn, т different EEG signal series £ (i = 1,..., т ) are considered.
( т )
1 т
IMPmEn = - Z PE (z V )) (4)
т i = 1
-
d decides the number of accessible states d! .
-
III. Classification
The efficacy of the entropy parameters extracted from the sub bands of DTℂWT to separate the seizure and normal EEG signals is tested by using a LS-SVM. The Support Vector Machine (SVM) is a capable classifier in the field of nonlinear classification of biomedical signals.
-
A. Least Squares-Support vector Machine (LS-SVM)
The SVM was evolved from the use of the kernel trick linear margin classifiers in which the classification error is minimized and the margin is maximized by deciding a optimal separating hyperplane to recognize dissimilar classes of data points. A quadratic programming problem concerning inequality constraints are represented as LS-SVM. The LS-SVM as a reformulation of SVM was proposed in [12]. The LS-SVM which considers only equality constraints, for two-class problem, the following decision function can be considered:
T f (x) = Sign[ w g(x) + b]
where w is the d-dimensional weight vector and b is a bias, and to map x into d-dimensional space a function is used known as g(x). In order to obtain w and b, the optimization problem can be formulated as:
1T min J (to, £) = to to + C Z £(6)
to, b £ 2
Subject to
T
J y. [ to ф ( x. ) + b ]? - £ , i = 1,..., N
£ ? , i = 1,..., N
The variables £ are required in order to allow misclassification due to overlapping distributions. The positive real constant C is a tuning parameter.
The LS-SVM classifier is formulated from equation as:
1 T1
min J (to, e) = — to to + у — Z e,(8)
to,b,e 2
subject to the equality constraints
T yi [to ф(xi) + b] = 1 - ei, i = 1,..., N.(9)
This equation considers equality instead of inequality constraints and takes into account a squared error with regularization term like the regression. The
N
{ x, y} are N training pairs of input-output vectors, where yi = 1 or 0 if xi is considered to be in class 1 or
T class 2, respectively, and e = (e^, e2 ,..., e^ ) . The
Lagrangian multipliers a. for equation is defined as:
NT
L ( to , b , e ; a ) = J ( to , b , e ) - Z a^ { y -[ to g ( x ;) + b ] - 1 + e -}(10) i = 1
where a are Lagrange multipliers and
T a = («t, «2 ,..., a^) . After solving equation the LS-
SVM classifier is derived as:
N f (x) = sign[ Z aiyiK(x, xi) + b] (11)
i = 1
where K ( x , x ) is a kernel function. We have explored the capability of LS-SVM for following three kernels [12]:
T
-
1) Linear kernel : K ( x , x^ ) = x^ x
-
2) Polynomial kernel of degree d:
T d
K ( x , x^ ) = (1 + x^ x / c )
-
3) RBF kernel: K ( x , x^ ) = exp{ -|| x - x i ||2 / a }
The MATLAB LS-SVM classifier toolbox codes are available:
-
B. Classifier Performance Parameters
The performance of the LS-SVM classifier is evaluated using three parameters, namely sensitivity (SEN), specificity (SPC) and classification accuracy (CAC) defined as [20]:
NP
SEN (%) =--- x 100
TNP
where NP represents the number of correctly detected positive patterns and TNP represents the total number of actual positive patterns.
NN
SPC (%) =---- X 100
TNN
where NN represents the number of correctly negative patterns and TNN the total number of actual negative patterns.
_ _ NC
CAC (%) = N x 100
TNP
where NCC represents the number of correctly detected patterns and TNP represents the total number of patterns.
-
IV. Experiment Simulation and Result Analysis
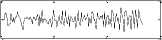
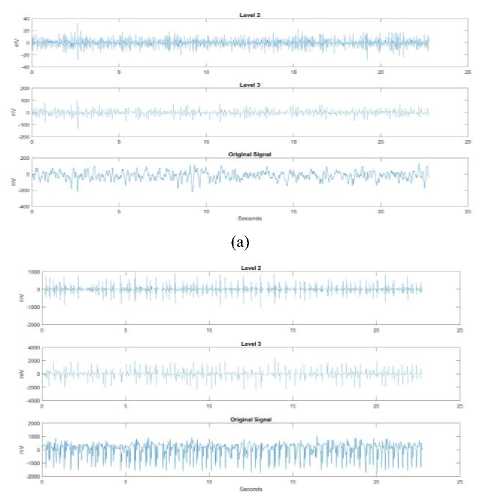
In this work, the computational time of the algorithms to decompose the EEG signal and extract IMPmEn has been considered as the main evaluation parameter. The computational time focuses on improving the ITR of the system by employing the computationally fast and lightweight algorithm suitable for the hardware implementation of the seizure detection system. The feature set for 4,096 samples of the normal and seizure EEG signals was considered with average computation time of 4.63 seconds. The algorithm was tested using MATLAB 9.0.1 tool on Intel® Core TM i5-7200 U CPU @ 2.5 GHz with 8 GB RAM. The computation time was computed for the entire 4,096 samples for ImPmEn entropy features. To verify the efficacy of classifier, both the data sets were divided into 500, 1000, 2000, and 4096 samples and decomposed using 3 different levels of DTℂWT. Fig. 7 a) and b) show the level 2 and level 3 decomposition using DTℂWT of normal and seizure
signals respectively. For each sub band ImPmEn is computed to generate a feature vector space of 2×50×4096 entropy features. In order to check the usefulness of the extracted features in the classification process, features with p ≤ 0.05 are selected.
(b)
Fig.7. 2nd and 3rd level decomposition using DTℂWT a) Normal, b) Seizure EEG signal.
Table 1 shows sample values of entropy features for normal and seizure EEG signals.
Table 1. Sample IMPmEn for normal and seizure signals
|
Signal type |
Normal |
Seizure |
|
Sub band level |
||
|
D1 |
0.6926 |
0.6929 |
|
D2 |
0.6931 |
0.6937 |
|
D3 |
0.6931 |
0.6935 |
|
D4 |
0.6952 |
0.6935 |
|
D5 |
0.6981 |
0.7231 |
|
D6 |
0.6983 |
0.7235 |
|
A1 |
0.6324 |
0.6351 |
The entropy feature (IMPmEn) of 2nd and 3rd level of sub bands obtained from DTℂWT of EEG signals were used as input features to the LS-SVM classifier with three kernel functions namely linear, polynomial, and RBF kernel. The purpose of selecting three kernels is to decide the optimal selection of classifier for the proposed application. The classifier performance of the LS-SVM classifier is computed using sensitivity, specificity, and accuracy. The highest classification accuracy among the obtained classification outputs for normal and seizure EEG signals by the proposed method is 99.87% for third level of sub band of DTℂWT with RBF wavelet kernel function of LS-SVM. Fig. 8 represents the classification plot of the entropy features of the second level DTℂWT of EEG signals used for testing the LS-SVM classifier with RBF function. From the figure it can be verified that the utilization of LS-SVM classifier presents ideal categorization of seizure and normal signals.
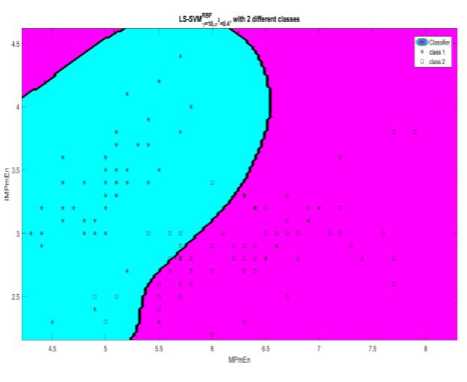
Fig.8. Classification of seizure and normal EEG signal groups for the LS-SVM classifier with RBF kernel (* and □ indicate the two classes for testing set)
The performance of classifier is shown with promising result when the sensitivity increases quickly and the specificity barely raises at all until sensitivity grows to be high. The area under Receiver Operating Characteristics (ROC) curve (AUC), shown in Fig. 9. In case RBF kernel the AUC is 99.861 which gives a measure of overall performance of the classifier. The higher value of ROC area indicates higher classification accuracy for certain range of values of thresholds. From the ROC curve it is clear that the for RBF is the most suited amongst all used kernel functions for EEG signal classification.
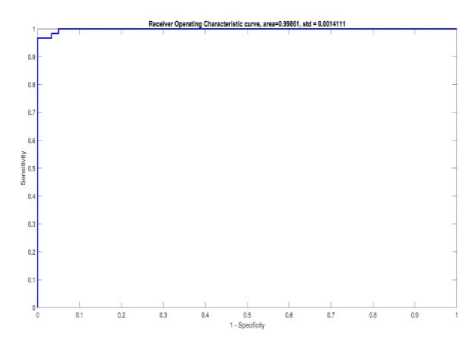
Fig.9. Receiver Operating Classifier (ROC) for RBF kernel of LS-SVM for IMPmEn features
Table 2 shows comparison of classification accuracies for five random experiments for 2nd and 3rd level sub bands of DTℂWT and results of the other author’s work reported in [17]. This method is apt for real-time applications due to automated and computationally less complex technique. The usage of fast and efficient algorithm to extract features and classify EEG signals is well suited for real-time implementation.
Table 2. Classification accuracies five random experiments using RBF kernel of LS-SVM compared to other work
|
Author |
Method used |
Accuracy (%) |
Sensitivity (%) |
Specificity (%) |
|
Peker and Sen [17] |
Real and complex valued features and ANN |
97.01 |
98.00 |
97.00 |
|
Peker and Sen [17] |
DT |
97.79 |
97.04 |
98.01 |
|
Guo et al. [17] |
DWT-Line Length Features (LLF) |
97.77 |
98.61 |
94.60 |
|
Kumar et al. [17] |
Fuzzy ApEn and SVM |
98.15 |
98.61 |
98.60 |
|
Xie and Krishnan [17] |
Wavelet variances and K nearest neighbors |
100 |
NA |
NA |
|
Ocak et al. [17] |
WT and ApEn |
96.00 |
NA |
NA |
|
This work (IMPmEn + LS-SVM RBF kernel) |
99.87 |
97.30 |
98.41 |
|
The DTℂWT, IMPmEn, and the LS-SVM classifier steps could be practically implemented on existing hardware/embedded platforms.
-
V. Conclusion
This study proposes a EEG based seizure detection system, an automated option for epileptic seizure detection. The method presented is using DTℂWT of EEG signals and extraction of entropy features for classification into seizure and normal class. An improved multiscale permutation entropy results in promising feature space which improves the classifier’s performance. The major parts of the study are as follows: - The combined use of DTℂWT and IMPmEn results in an effective method which shows improved result on classification accuracy of EEG signal data. It can be concluded that with classification accuracy of 99.87%, it may be possible to build an efficient hardware for seizure detection system for real time application. The study investigates the computational complexity of the proposed algorithm to improve current ITR of the system. The use of different levels of complex-valued wavelet transformation on varied size of signal samples is an important findings in terms of efficacy in real time implementation. The proposed features improve the time required for obtaining the experimental results due to the variability included in computing the entropy measure. To find efficacy of the method implemented is tested using the datasets of four different sizes. In future, we intend to extend our study using this method on continuous recording of EEG data.
Acknowledgment
The authors sincerely thank Dr. M. D. Mohire, D.M., neurologist, Mohire’s neurology research center, Kolhapur, India for the important suggestions on brain structure and EEG signals for the research. We also thank the authorities at K. L. E. Society’s Dr. Prabhakar Kore Hospital and Medical Research Center, Belagavi, India for providing real time EEG signal database for the conducted experiments.
References Classification of EEG signals in a seizure detection system using dual tree complex wavelet transform and least squares support vector machine
- Gooch, Clifton L., Etienne Pracht, and Amy R. Borenstein, “The Burden of Neurological Disease in the United States: A Summary Report and Call to Action”, Annals of Neurology, 2017.
- S. A. Hosseini, M-R. Akbarzadeh-T, M-B. Naghibi-Sistani, “Qualitative and Quantitative Evaluation of EEG Signals in Epileptic Seizure Recognition”, International Journal of Intelligent Systems and Applications (IJISA), vol.5,no.6,pp.41-46,2013.DOI: 10.5815/ijisa.2013.06.05
- Vaughan, T. M. , Heetderks, W. J. , Trejo, L. J. , Rymer, W.Z., Weinrich, M., Moore, M.M., Kubler, A., Dobkin, B. H., Birbaumer, N., Donchin, E., Wolpaw, E. W. and Wolpaw, J. R., “Brain-computer interface technology: a review the second international meeting”, in IEEE Transactions on Neural Systems and Rehabilitation Engineering, Vol.11, no. 2, pp. 94-109, 2003.
- Al-Fahoum, Amjed S., and Ausilah A. Al-Fraihat. “Methods of EEG signal features extraction using linear analysis in frequency and time-frequency domains”, ISRN neuroscience, pp. 1-7, 2014.
- Faust, Oliver, et al., “Wavelet-based EEG processing for computer-aided seizure detection and epilepsy diagnosis”, Seizure 26, 2015, pp. 56-64.
- Tzallas, Alexandros T., Markos G. Tsipouras, and Dimitrios I. Fotiadis, “Epileptic seizure detection in EEGs using time–frequency analysis”, IEEE transactions on information technology in biomedicine 13.5, 2009, pp. 703-710.
- Kumar, Yatindra, M. L. Dewal, and R. S. Anand., “Epileptic seizures detection in EEG using DWT-based ApEn and artificial neural network”, Signal, Image and Video Processing, 2014, pp.1-12.
- Torse, Dattaprasad A., Veena Desai, and Rajashri Khanai, “Application of Intrinsic Mode Function Based Features and Artificial Neural Network for the Classification of Normal and Epileptic EEG Signals”, International Journal of Engineering vol.10 no.1, 2017.
- Goshvarpour, Ateke, Hossein Ebrahimnezhad, and Atefeh Goshvarpour. “Classification of epileptic EEG signals using time-delay neural networks and probabilistic neural networks”, International Journal of Information Engineering and Electronic Business vol.5 no.1 (2013), pp. 59-67.
- Wang, Deng, Duoqian Miao, and Chen Xie, “Best basis-based wavelet packet entropy feature extraction and hierarchical EEG classification for epileptic detection”, Expert Systems with Applications 38.11, 2011, pp. 14314-14320.
- Selesnick, Ivan W., Richard G. Baraniuk, and Nick C. Kingsbury, “The dual-tree complex wavelet transform”, IEEE signal processing magazine 22.6, 2005, pp.123-151.
- Suykens, Johan AK, Tony Van Gestel, and Jos De Brabanter. Least squares support vector machines. World Scientific, 2002.
- Singla, Rajesh, and B. A. Haseena, “Comparison of ssvep signal classification techniques using svm and ann models for bci applications”, International Journal of Information and Electronics Engineering 4.1, 2014, pp 1-6.
- Torse, Dattaprasad A., and Veena V. Desai. “Design of adaptive EEG preprocessing algorithm for neurofeedback system”, Communication and Signal Processing (ICCSP), 2016 International Conference on. IEEE, pp. 0392-0395, 2016.
- Wang, Shuihua, et al., “Dual-tree complex wavelet transform and twin support vector machine for pathological brain detection”, Applied Sciences 6.6, 169, 2016, pp. 1-18.
- Chen, Guangyi, “Automatic EEG seizure detection using dual-tree complex wavelet-Fourier features”, Expert Systems with Applications 41.5, 2014, pp. 2391-2394.
- Peker, Musa, Baha Sen, and Dursun Delen, “A novel method for automated diagnosis of epilepsy using complex-valued classifiers”, IEEE journal of biomedical and health informatics 20.1, 2016, pp. 108-118.
- Azami, Hamed, and Javier Escudero, “Improved multiscale permutation entropy for biomedical signal analysis: Interpretation and application to electroencephalogram recordings”, Biomedical Signal Processing and Control 23, 2016, pp. 28-41.
- Costa, Madalena, Ary L. Goldberger, and C-K. Peng. “Multiscale entropy analysis of complex physiologic time series”, Physical review letters 89.6, 2002, pp. 068-102.
- Joshi, Varun, Ram Bilas Pachori, and Antony Vijesh, “Classification of ictal and seizure-free EEG signals using fractional linear prediction”, Biomedical Signal Processing and Control 9, 2014, pp. 1-5.
