Classification of High Blood Pressure Persons Vs Normal Blood Pressure Persons Using Voice Analysis

Author: Saloni, R. K. Sharma, Anil K. Gupta
Journal: International Journal of Image, Graphics and Signal Processing(IJIGSP) @ijigsp
Article in issue: 1 vol.6, 2013.
Free access
The human voice is remarkable, complex and delicate. All parts of the body play some role in voice production and may be responsible for voice dysfunction. The larynx contains muscles that are surrounded by blood vessels connected to circulatory system. The pressure of blood in these vessels should be related with dynamic variation of vocal cord parameters. These parameters are directly related with acoustic properties of speech. Acoustic voice analysis can be used to characterize the pathological voices. This paper presents the classification of high blood pressure and normal with the aid of voice signal recorded from the patients. Various features have been extracted from the voice signal of healthy persons and persons suffering from high blood pressure. Simulation results show differences in the parameter values of healthy and pathological persons. Then an optimum feature vector is prepared and kmean classification algorithm was implemented for data classification. The 79% classification efficiency was obtained.
Voice analysis, blood pressure, acoustic parameters, Kmean algorithm
Short address: https://sciup.org/15013195
IDR: 15013195
Text of the scientific article Classification of High Blood Pressure Persons Vs Normal Blood Pressure Persons Using Voice Analysis
The voice production is a complex interaction among a number of different body systems. Voice production is similar as a musical instrument. For any instrument to produce sound something have to stimulate the sound, somewhat must vibrate and resonate. The lungs contribute the role of the activator in human voice production. As one breathes in, negative pressure is produced that actually pulls air into the lungs. As we expire or exhale, that air serves as the source of power for setting up the vibration of the vocal folds. The vocal folds themselves serve as the vibrators, and it is the fine control of the movements of the vocal folds that allows for the flexibility of the speaking and singing voice. In the body, the face and sinuses and the chest serve as resonators, which give the voice its timbre or character. Voice disorders are caused by different factors, events, physical ailments and diseases. Disturbances in the status of respiratory, gasterointestinal, endocrine, neurological and psychological system creates disturbance in voice. In case of obstructive lung disease the lung volume decreases and tension in neck and tongue muscles increases. The endocrine problem causes the accumulation of fluid in superfacial layer of lamina propria, which alters the vibratory characteristics. Sometimes a small, callous like bump is present on the vocal fold known as nodules. This causes hoarseness, breathiness and vocal fatigue. Cysts and polyps also causes the voice disorders.cystst is a closed cavity contains a liquid material. Many other structural lesions may appear on the vocal folds called polyps.The neurological problems commonly causes voice abnormalities. These include myasthenia granis, Parkinson disease. Voice abnormalities are the first symptom of some of these diseases. The voice is also get effected by the blood pressure of a person. As the larynx consists of muscles that are covered by blood vessels. The blood in these vessels is controlled by human circulatory system. Hence the pressure in these blood vessels is dynamically related to the vocal cord parameters [1]. When the blood pressure of a human body get disturbed, the vibrations of the related organ also get affected and these disturbed vibrations influences the vibrations at glottal. So some paralinguistic features changed. Formant analysis can provide useful information about our important body organs like brain, heart, nervous system [2].Using 2D spectrum of vowel speech signal the heart beat rate is extracted [3].Behavioral risk for coronary disease is assessed by voice characteristics[4].
Blood pressure (BP ) is the pressure exerted by circulating blood upon the walls of blood vessels. During each heartbeat, BP varies between a maximum (systolic) and a minimum (diastolic) pressure. Encroaching glomerulosclerosis and peripheral vascular resistance to blood flow are two reasons for high blood pressure. As our arteries are exposed to less than ideal conditions, they begin to develop a thick build up of waste. This starts with some sort of damage to the vessel wall and progresses only as the body is exposed to or fed excess fat and cholesterol. The excess waste (fat and cholesterol) end up as plaques which are laid down on the vessel walls. This problem relates to high blood pressure and the plaques that build up causes the artery to be unflexible. This results in the heart having to push harder to get the blood through the stiff unhelpful arteries.
Voice analysis is a good tool for the classification of normal and pathological persons and for speaker identification/verification. Because voice has very unique characteristics which can be used for these purposes. These characteristics can be extracted from a wide range of feature extraction techniques. Jitter, shimmer, Noise to harmonic ratio (N/H), Autocorrelation (A/C), Linear predictive coefficients (LPC), Mel frequency cepstrum coefficients (MFCC) etc are the various features which can be used in the above mentioned application. After feature extraction, classification technique is applied which clearly classifies the category. For classification also a large number of techniques are available and fully developed. Dynamic time wrapping (DTW), Hidden markov model (HMM), artificial neural network (ANN), Kmeans classification etc is the names of some popular methods.
Vocal folds disorder is detected using six characteristics parameters i.e. Jitter, shimmer, N/H, Soft Phonation Index(SPI),Amplitude Perturbation Quotient(APQ),Relative Average Perturbation(RAP) and the Hidden Markov Model(HMM), Gaussian Mixture Model(GMM) and Support vector Machine(SVM) were used to distinguish the mixed data into the categories of normal and pathological voice[14].Maximum Likelihood Linear Regression (MLLR) transformation of GMM model represents the distribution of pathological patients and normal people in the high dimensional space[15].A measure called pitch period entropy, which is robust to many uncontrollable confounding effects discriminate the healthy people from people with Parkinson disease[16].The healthy voice signals are indeed less intricate and with a more regular periodicity as compare to pathological voice[17].Among the four independent classification models that is DMNeural, neural network, regression and decision tree for the classification of Parkinson data set , the neural network classifier yielded the best score[18].The reconstructed signal of first, second and third of DWT-db which corresponds to highest frequency component of the signal clearly distinguish normal voice and voices from patients with Reinke’s edema and nodule in vocal folds[19].
In this paper voice database of healthy and pathological persons and various standard characteristics that are used for classification are explained in section II. Section III includes the explanation of Kmeans algorithm. The characteristics are extracted from the voice database and their vectors are prepared and classified into normal and high blood pressure persons using Kmeans algorithm. Section IV describes the results and followed by a concluding section V.
-
II. MATERIALS AND METHODS
In this research, the recorded voice database is used. The voice database includes 72 voice recording from 24 male subjects. Each subject has 3 voice signal recordings.11 subjects suffer from high blood pressure and rest are healthy people. Subjects are about 45-65 years old. Speech record database consists of phonation of the vowel /I/. The voice signal has been recorded with a sampling frequency of 44.1 KHz and a resolution of 16 bits. Recording is done with Sony recorder ICD-UX512F/UX513F with a frequency response of 5020,000 Hz and have a noise cut feature. Recording is done in a silent room. Acoustic assessment was performed by analysis of vowels phonated in isolation and in a constant linguistic test starting with the word (“NIT”). The parameters considered for analysis: Standard deviation in pitch (Hz), Jitter (frequency perturbation – local, %), Shimmer (amplitude perturbation –local, %), Autocorrelation (AC), Noise to harmonic ratio (NHR-dB), Harmonic to noise ratio (HNR – dB) [8, 9, 10].The block diagram of purposed method is Figure 1.
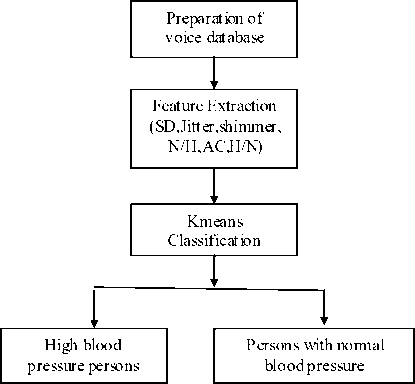
Figure 1. The proposed model
First of all the voice database of normal and high blood pressure persons is prepared. Then this database is analyzed and various features are extracted. The feature vector is prepared in which some relevant feature are included which represent the particular phonation of vowel of a particular person. Kmeans classifier is used for the classification. Feature that are extracted are explained below.
-
A. Jitter
This is also known as pitch perturbation and refers to the minute involuntary variations in the frequency of adjacent vibratory cycles of the vocal folds as shown in Figure 2. In essence, it is a measure of frequency variability in comparison to the client’s fundamental frequency. Pathological voices often exhibit a higher percentage of jitter.
B. Shimmer
Whereas jitter is a measure of the percentage irregularity in the pitch of the vocal note (pitch perturbation), shimmer is a measure of the percentage irregularity in the amplitude of the vocal note. It is often referred to as amplitude perturbation. Shimmer, therefore, measures the variability in the intensity of adjacent pathological voices will typically exhibit a higher percentage of jitter.
C. Harmonic to noise ratio
The vocal note produced by the vibrations of the vocal folds is complex and made up of periodic (regular and repetitive) and aperiodic (irregular and non-repetitive) sound waves. The aperiodic waves are random noise introduced into the vocal signal owing to irregular or asymmetric adduction (closing) of the vocal folds. Noise impairs the clarity of the vocal note and too much noise is perceived as hoarseness.
Laryngeal pathology may lead to poor adduction of the vocal folds and, therefore, increase the amount of random noise in the vocal note. The greater the proportion of noise, the greater the perceived hoarseness, and the lower the HNR figure will be, i.e. a low HNR indicates a high level of hoarseness, and a high HNR indicates a low level of hoarseness. Figure 2 represents jitter, shimmer and HNR diagrammatically.
D. Mean pitch
This is the Speaking Fundamental Frequency (SF 0 ), i.e. the average speaking pitch. For adult males this is around 128 Hz (cycles per second), for adult females it is about 225 Hz, and for children under the age of 10 years it can average 260 Hz.
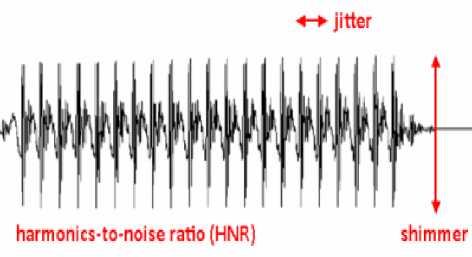
Figure 2. Jitter and Shimmer
E. Standard deviation
This is a statistical measure of how much the pitch varies from the mean pitch [5, 6, 7].
-
III. CLASSIFICATION USING KMEANS ALGORITHM
The K-means algorithm is proposed by MacQueen in 1967. It is a well known iterative procedure for solving the clustering problems. It is also known as the C-means algorithm or basic ISODATA clustering algorithm. It is an unsupervised learning procedure which classifies the objects automatically based on the criteria that minimum distance to the centroid. In the K-means algorithm, the initial centroids are selected randomly from the training vectors and the training vectors are added to the training procedure one at a time. The training procedure terminates when the last vector is incorporated. The algorithm flowchart is shown in Figure 3. The K-means algorithm is used to group data and the groups can change with time. The algorithm can be applied to VQ
codebook design. The K-means algorithm can be described as follows:
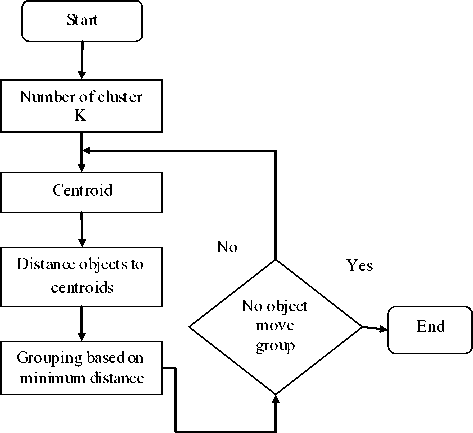
Figure 3. K -means clustering algorithmflowchart
Step 1 : Randomly select N training data vectors as the initial code vectors C i , i = 1,2,..., N from T training data vectors.
For each training data vector X j, j = 1, 2, T, assign X j to the partitioned set Si
If i= argminl (X j , Ci )
Step 2: Compute the centroid of the partitioned set that is code vector using c-=ili -■ (1)
Where | S i | denotes the number of training data vectors in the partitioned set Si. If there is no change in the clustering centroids, then terminate the program.
Step 3 : Then the distance between each cluster centroid to each object. A simple distance measure that is commonly used is Euclidean distance. This step leads to the generation of a distance matrix which represents the distance between each object and each cluster centroid.
Step 4 : Objects are assigned to a specific cluster based on a minimum distance measure. That is, for any given object ‘X’, if the distance between this object and the centroid of cluster 1 is minimum, then object ‘X’ will be assigned to cluster.
Step 5 : The whole process is carried out iteratively until the centroid values become constant i.e. do no change iteratively.
There are various limitations of K-means algorithm. Firstly, it requires large data to determine the cluster. Secondly, the number of cluster, K, must be determined beforehand. Thirdly, if the number of data is a small it difficult to find real cluster and lastly, as per assumption each attribute has the same weight and it quite difficult to knows which attribute contributes more to the grouping process. It is an algorithm to classify or to group objects based on attributes/features into K number of group. K is positive integer number. The grouping is done by minimizing the sum of squares of distances between data and the corresponding cluster centroid. The main aim of K-mean clustering is to classify the data. In practice, the number of iterations is generally much less than the number of points [11, 12].
-
IV. RESULTS AND DISCUSSION
30.00%
25.00%
20.00%
15.00%
10.00%
5.00%
0.00%
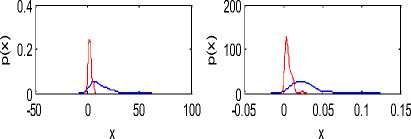
The voice parameter values depend on blood pressure of a person. There is a large variation in the values of parameters between the healthy and high blood pressure persons. The probability density functions of the parameters are shown in Figure 4.
The standard deviation is more for the unhealthy group. The values of jitter are also high for the unhealthy as compare to healthy group. For healthy shimmer is less as compare to unhealthy group. Autocorrelation for healthy group is more as compare to unhealthy group. As a result N\H is high for unhealthy and H/N is high for healthy group.
ф Е Е сл
♦ 系列 1 ■系列 2
Standard Deviation in pitch Jitter
0.00% 5.00% 10.00% 15.00%
Jitter(%)
(a)

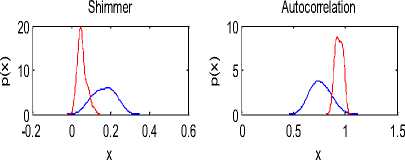
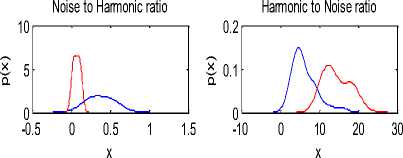
Figure 4. Probability densities of voice features. Blue lines represent probability density of voice features of high blood pressure persons and red lines for healthy persons.
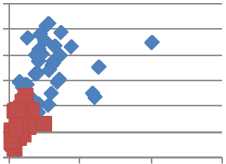
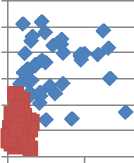
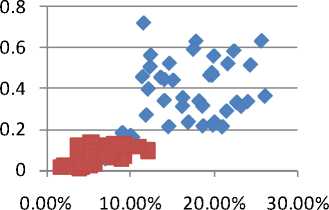
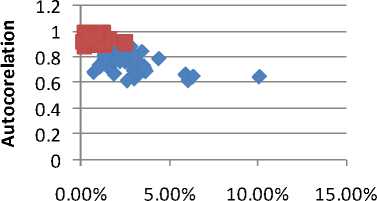
The value of the parameters in case of high blood pressure spread over a wide range while in case of healthy persons it is over a narrow region. Figure 5A shows Jitter versus shimmer, 5B shows Standard deviation versus Shimmer, 5C shows Shimmer versus N/H and 5D shows Jitter versus Autocorrelation .Series 1 represents features of high blood pressure persons and series 2 represents features of normal persons. As it is shown in figures, there is a correlation between data of healthy people and data of high blood pressure persons. The clustering behavior of pathological speech signal is evident. It should be noted that we are showing only the feature space for two dominant features that may not reveal clearly the boundaries.
30.00%
25.00%
20.00%
15.00%
10.00%
5.00%
0.00%
0 20 40 60
Standard deviation
(b)
♦ 系列 1 ■系列 2
Shimmer
(c)
♦ 系列 1 ■系列 2
Jitter
(d)
-
Figure 5. Plots of pairs of features
-
(a) Demonstration of Jitter-shimmer (b) Demonstration of standard deviation –shimmer (c) Demonstration of Shimmer-N/H (d) Demonstration of Autocorrelation-Jitter.
The aim of applying classification algorithm is to automatically distinguish normal signals from high blood pressure signals by using discriminatory features derived from speech signal. The best set of features was formed for two group classification. We have made a feature vector of following parameters [standard deviation, jitter, shimmer, autocorrelation, noise to harmonic ratio, harmonic to noise ratio].Kmeans clustering technique is used for classifying normal and high blood pressure subjects.
In order to test the classifier performance, several measures namely, sensitivity (SE), specificity (SP), and the overall accuracy (AUC) are considered. These measures are calculated from the measures true positive (TP), true negative (TN), false positive (FP), and false negative (FN) are presented [13].
Where
TP= True Positive, the classifier classified as pathology when pathological samples are present.
TN= True Negative, the classifier classified as normal when normal samples are present.
FN= False Negative, the classifier classified as normal when pathological samples are present.
FP= False Positive, the classifier classified as pathological when normal samples are present.
TP
Sensitivity= ∗ 100
Specificity = TN ∗ 100
(TP +TN)
Overall accuracy = ∗ 100
(TP +TN +FP+FN)
The result that we have obtained in our research work is tabled as below. It can be observed that out of 39
normal signals 33 were correctly classified as normal and 6 were misclassified as pathological. Similarly, out of 33 pathological signals, 24 were correctly classified as pathological and 9 were misclassified as normal. It was observed that misclassified pathological signals were perceptually similar to normal and that they could be hardly classified as pathological by an untrained listener.
TABLE I. Confusion matrix to show the classifier
PERFORMANCE
|
Eve nt |
|||
|
Present |
Absent |
Efficiency=79% |
|
|
Present |
TP=72.3% |
FP=27.15% |
Sensitivity=80% |
Absent FN=15.2% TN=84.6% Specificity=78.51%
V. CONCLUSION
Characterizing pathological voice using efficient acoustic analysis have been the focus of a number of research studies in past. Earlier research on acoustic analysis also used sustained vowel data. Sustained vowels are obtained in a controlled condition and they produce excellent normal/pathological classification. The research work presented in the paper successfully demonstrated the usefulness of some basic features in classifying normal and high blood pressure patients. Kmean classifier gives efficiency of 79% in classifying the two categories. High blood pressure persons have different values of acoustic parameters than the healthy one. These observations can be used further in various medical applications. Also, further research can be done to develop algorithm to diagnose B.P. using voice
References Classification of High Blood Pressure Persons Vs Normal Blood Pressure Persons Using Voice Analysis
- Abdelwadood Mesleh, Dmitriy Skopin, Sergey Baglikov, and Anas Quteishat. Heart rate feature extraction from vowel speech signal. Journal of Computer Science and Technology,pp 1243-1251 Nov. 2012.
- Nivedita Deshpande, Dr. KavitaThakur, Prof. A.S.Zadgaonkar. Assesment of systolic and diastolic cycle duration from speech analysis in the state of anger and fear. ITCS, SIP, JSE-2012, CS & IT 04, pp. 137–141, 2012.
- Dmitriy E. Skopin, Sergey U. Baglikov. Heartbeat feature extraction from vowel speech signal using 2d spectrum. 4th International Conference On Information Technology (ICIT 2009).
- Beth Schucker, MA, Davi R. Jacobs, JR., PHD .Assesment of Behavioural risk for coronary diseases by voic characteristics. Psychosomatic Medicine Vol. 39, No. 4 (July-August 1977).
- Murlikrishna Viswanathan,Zhen-Xing Zhan,Joon S. Lim. Emotional-Speech Recognition Using the Neuro-FuzzyNetwork. ICUIMC’12, February 20–22, 2012, Kuala Lumpur, Malaysia.
- R. J. Baken and R. F. Orlikoff, Clinical Measurement of Speech and Voice. 2nd ed. San Diego: Singular Thomson Learning, 2000.
- R. Arefi Shirvan, E. Tahami. Voice analysis for detecting Parkinson’s Disease using genetic algorithm and KNN Classification Method. 18th Iranian Conference on BioMedical Engineering, 14-16 December 2011, Tehran, Iran,pp 278-283.
- PRAAT. DOI= http://www.fon.hum.uva.nl/praat/.
- P. Boersma and D. Weenink. Praat, a system for doing phonetics by Computer. Glot Int, vol. 5, pp. 341-345, 2001.
- M. S. Ardakani, Z. Soleymani, F. Torabinejad, S. M. Khoddami, M. A. Heydari. Fundamental frequency, jitter, and shimmer of adult stutters and nonstutters voice. Audiology, Vol.16, No.2, 2008.
- Xin-guang Li ,Min-feng Yao, Wen-tao Huang. Speech Recognition Based on K-means Clustering and Neural Network Ensembles. 2011 Seventh International Conference on Natural Computation.
- Balwant A. Sonkamble1,D. D. Doye. Speech Recognition Using Vector Quantization through Modified K-means LBG Algorithm. Computer Engineering and Intelligent Systems Vol 3, No.7, 2012.
- Juan Ignacio Godino-Llorente, Pedro Gómez-Vilda,Nicolás Sáenz-Lechón,Manuel Blanco-Velasco,Fernando Cruz-Roldán and Miguel Angel Ferrer-Ballester. Discriminative methods for the detection of voice Disorders. ITRW on Nonlinear Speech Processing (NOLISP 05) Barcelona, Spain April 19-22, 2005.
- Jianglin Wang, Cheolwoo Jo. Vocal Folds Disorder Detection using Pattern Recognition Methods. Proceedings of the 29th Annual International Conference of the IEEE EMBS Cité Internationale, Lyon, France August 23-26, 2007.
- Xiang wang, jianping zhang, yonghong yan. Automatic Detection of Pathological Voices Using GMM-MLLR Approach.IEEE 2009.
- Max A. Little ,Patrick E.MacSharry,Eric J. Hunter,Jennifer,Spielman and Lorraine O.Raming. Suitability of Dysophonia measurement for Telemonitoring Parkinson Disease. IEEE Transaction On Biomedical Engineering,Vol 56,No.4,April 2009.
- Paulo R.Scalassara, Carlos D. Maciel and Jose C.Perreira. Predictability analysis of voice signals. IEEE Engineering in Medical and Biology magazine 2009.
- Resul Das. A comparison of multiple classification methods for diagnosis of Parkinson disease. Expert Systems with Applications 37 (2010) 1568–1572.
- Carlos Dias Maciel, Jose Carlos Pereira and David Stewart. Identifying Healthy and Pathologically affected Voice Signal. IEEE Signal Processing Magazine, January 2010.
