Classification of Mammogram Abnormalities Using Pseudo Zernike Moments and SVM

Author: S. Venkatalakshmi, J. Janet
Journal: International Journal of Image, Graphics and Signal Processing(IJIGSP) @ijigsp
Article in issue: 4 vol.9, 2017.
Free access
The most common malignancy observed among Indian women is the breast cancer. However, the cancer is detectable earlier by means of mammograms. Computer Aided Diagnostic (CAD) techniques are the boon to medical industry and these techniques intend to support the physicians in diagnosis. In this paper, a novel CAD system for the detection and classification of the abnormalities in the mammogram is presented. The proposed work is organized into four important phases and they are pre-processing, segmentation, feature extraction and classification. The pre-processing phase intends to remove unwanted noise and make the mammograms suitable for the next process. The segmentation phase aims to extract the areas of interest to proceed with further process. Feature extraction is the most important phase, which is meant for extracting the texture features from the area of interest. This work employs pseudo zernike moments for extracting features, owing to the noise resistance power and description ability. Finally, Support Vector Machine (SVM) is employed as the classifier, so as to distinguish between the malignant and normal mammograms. The performance of the proposed work is evaluated by several experimentations and the results are satisfactory in terms of accuracy, specificity and sensitivity.
Breast cancer, CAD, pseudo Zernike moments, SVM
Short address: https://sciup.org/15014179
IDR: 15014179
Text of the scientific article Classification of Mammogram Abnormalities Using Pseudo Zernike Moments and SVM
Published Online April 2017 in MECS DOI: 10.5815/ijigsp.2017.04.04
Breast cancer is one of the highly prevalent cancers among women [1] and it shows high mortality rates too. The human lives can be saved, when the cancer is detected at the early stage. Mammography is a boon to the medical science, which captures the image of the breast tissue. With this aid, the physician can detect the breast cancer earlier. Thus, a mammogram acts as a screening tool for breast cancer detection. The earliest symptom of breast cancer is the group of calcifications.
Generally, microcalcification is a tiny deposit of calcium which is present in the breast tissue. This calcium deposit can be of circular, lobular, specular or irregular shape. These microcalcifications can be observed in a mammogram as small granules and is very difficult for the physician to locate them accurately. A study claims that over ten to forty percent of microcalcifications are ignored by the physician [2,3]. However, computers can detect the abnormalities easily, provided the system is trained effectively. An efficient Computer Aided Diagnostic (CAD) system can assist the physician in detecting the cancer earlier, by imposing advanced image processing techniques [4].
Several CAD systems have already been reported in the literature. Most of the existing systems suffer from high false positive and negative rates. Thus, there is a constant need and demand for CAD system to detect breast cancer. The main intention of this paper is to present a CAD system which can classify between the malignant and the normal mammograms. This goal is achieved by incorporating four important phases, which are image pre-processing, segmentation, feature extraction and classification.
The image pre-processing phase aims to enhance the image quality by removing noise. Besides this, the size of the mammogram is also reduced. The next phase is the segmentation, which takes the region of interest alone into account. This saves time and computation power of the system. The feature extraction is the most important phase and this work exploits the pseudo-zernike moments. Finally, Support Vector Machine (SVM) is employed as the classifier to distinguish between the malignant and normal mammograms. The research contributions of this work are listed below.
-
• This work follows the principle of modularity, which results in simplicity and effectiveness.
-
• The segmentation procedure extracts the area of interest by means of a threshold and the features are extracted from the area of interest alone. This makes the system efficient and time conserving.
-
• The features are extracted by means of Pseudo zernike moments, whose description ability is greater.
-
• The lagrange multiplier is utilized to optimize the selection of hyperplane.
The remainder of this paper is organized as follows. Section II presents the review of literature with respect to the computer aided diagnostic systems for breast cancer.
The proposed approach is elaborated in section III, which presents all the phases involved in the proposed work. The performance of the proposed approach is analysed in section IV. Finally, the concluding remarks are presented in the section V.
-
II. Background
Recently, so many works have been proposed to detect the breast cancer at an early stage, by means of mammograms. This section presents the summary of the existing works, which are the driving force of this paper.
A technique to classify the mammogram abnormalities as normal and abnormal is presented in [5]. This work utilizes the statistical features such as mean, variance, standard deviation etc., and pixel intensity. Neural network is employed as the classifier. The experimental results are compared between the statistical features and pixel intensity. The results show that the accuracy rate of pixel intensity is more than the statistical features. In [6], the Gray Level Co-occurrence Matrix (GLCM) is utilized to extract features. For the purpose of classification, neural network is used. A system to detect the abnormalities in mammograms is presented in [7]. This work extracts features from non-subsampled contourlet. SVM is utilized to classify between the normal and abnormal regions of the mammograms.
In [8], a new technique is proposed to locate the abnormal masses in mammograms. The regions of interest are extracted from the mammograms before proceeding with feature extraction and classification. The regions of interest are extracted by k-means algorithm and template matching technique. While extracting features, simpson’s diversity index is utilized for different shapes. SVM is utilized as the classifier. The work proposed in [9] utilizes shape descriptors for abnormality detection in mammograms. A scheme to differentiate the mammograms with respect to mass is presented in [10]. This work extracts the region of interest and then the features are extracted. The process of feature extraction is done by Principal Component Analysis (PCA) and Gabor wavelet. SVM is exploited for classification purposes.
A methodology to differentiate the abnormalities of mammograms is proposed in [11]. This work extracts the regions of interest from the mammograms, followed by which features are extracted. The features being considered are mean, standard deviation, energy, entropy, asymmetry and smoothness in association with Local Binary Patterns (LBP). This work employs k Nearest Neighbour (k-NN) and SVM as classifiers and the performance of the classifier is evaluated. The mass and non-mass regions of mammograms are detected in [12]. The texture features are extracted from the areas of interest by an index, which is calculated by histogram, GLCM and Gray Level Run Length Matrix (GLRLM). This work is claimed to be more accurate.
In [13], a work is proposed to classify the mass and the normal regions of breast tissue. Initially, the ROIs are extracted from the mammogram image. The ROIs are then treated in multiple directions and scales by Gabor filter. The classifier being employed is SVM. In [14], a breast cancer classification system is developed, which is trained by Block Variance of Local Coefficients (BVLC). These texture features help the SVM to differentiate between the mass and non-mass regions of the mammograms.
A texture feature based breast cancer classification system is presented in [15], which consists of three important phases such as pre-processing, feature extraction and classification. The pre-processing step removes the unwanted portions of the mammogram. The texture features are extracted by means of contourlet and the features are enhanced by means of genetic algorithm. SVM classifier is utilized in this work. A CAD system is presented in [16], breast cancer diagnosis is presented. Initially, ROIs are extracted from the mammograms, followed by which feature extraction takes place by applying spherical wavelet transformation. Finally, SVM is employed for attaining the classification.
Motivated by the above works, this paper aims to present a breast cancer detection system by means of phases such as mammogram pre-processing, segmentation, texture feature extraction and SVM classification. The pre-processing phase aims at reducing the size of the image and to make the image suitable for the forthcoming operations. The main goal of the segmentation phase is to extract the specific area of interest. The texture features are extracted by pseudo-zernike moments and the abnormalities are detected by SVM. The following section elaborates the proposed approach.
-
III. Proposed Approach
This section elaborates the functionality of all the phases involved in the proposed work. Initially, the overall idea of the proposed work is presented, which is followed by the explanatory part of the phases involved.
-
A. Outline of the Work
The major goal of this work is to present a system, which can classify between the normal and the abnormal cells of breast tissue. The primary goal is attained by four sequential phases such as image pre-processing, segmentation, feature extraction and classification. The pre-processing step is to make the images suitable for the operations to be performed on the image. Besides this, the quality of the image is improved by removing noise. Thus, all the preliminary operations are carried out in this phase.
This phase is followed by the segmentation process, which divides the image into several parts, out of which the areas of interest are extracted. This improves the performance of the system by consuming lesser computation time, power and memory. The feature extraction phase intends to extract useful features from the areas of interest being extracted prior. This work exploits pseudo zernike moments for extracting texture features. The system is trained with the extracted set of features such that the classification between two categories can be done. The SVM distinguishes between the normal and abnormal cells in the mammogram. The overall architecture of the proposed approach is presented in fig.1.
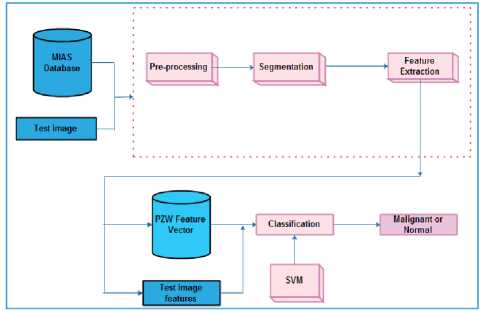
Fig.1. Overall architecture of the proposed approach
Basically, this system involves two categories of operations namely training and testing. In the training stage, the system is imparted knowledge by the beneficial features being extracted. The training phase makes the system to gain knowledge and differentiate between the normal and abnormal cells. The training phase is enclosed in red coloured dotted lines of figure 1. The testing stage involves all the phases as that of the training stage. However, this stage makes the system to decide the classification result of whether the cells are malignant or normal.
-
B. Mammogram Image Pre-Processing
The mammogram images contain several inappropriate details that are needed to be processed. These details must be eliminated such that the processing efficiency of the system can be improved. Additionally this step intends to eliminate noise, so as to enhance the quality of an image. In this phase, the image is eroded to distinguish between the background and the foreground. The original image and the pre-processed image are presented in fig. 2.
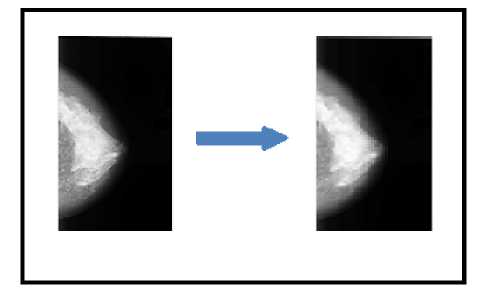
Fig.2. Image pre-processing
Basically, foreground of a mammogram image contains the minute details of the breast tissue which should not be eliminated. Thus, the pre-processing phase eliminates unwanted details from the mammogram and makes the image suitable for further processing.
-
C. Mammogram Image Segmentation
The image segmentation process aims at partitioning the mammogram image into several image segments. The segmentation procedure follows the principle of ‘divide and conquer’. The segmentation operation segments the mammogram into 128 X 128 pixels. The segments with more intensity are selected for further processing. Usually, the abnormal cells are denser by nature which shows varied intensity. After the completion of segmentation procedure, the segments with maximum intensity alone are picked and these segments are denoted as ‘area of interest’. These areas of interest are selected by fixing threshold, which is selected by trial and error method. The segmentation process is done in both training and testing phases. The features are extracted from the selected areas of interest alone. This idea results in the reduction of time, computational power and memory consumption.
-
D. Feature Extraction on Area of Interest
The proposed work exploits pseudo zernike moments for obtaining the texture properties of the area of interest. The pseudo zernike moments are known for its resistivity to noise and description ability [17,18]. The pseudo zernike moments are explained in the following subsection.
1) Pseudo Zernike Moments
The pseudo zernike moments are proven to be robust against noise and the moments are orthogonal. The 2D pseudo zernike moments of order к and I recurrence for a image intensity function f (a, b) is given by the following equation.
pzmk j (f(a,b)) =
^+1 Ka2 + b2<1 Pkl(a,b)f(a,b)da db (1)
Where the value of к ranges from 0,1,...^, the value of I can either be positive or negative but should be |Z| < к and the ' * ' over P indicates the complex conjugate. The polynomials of pseudo zernike moments are presented by
Pk-l(a,b) = RPk-l(s)el u) (2)
In eqn.2, ‘s’ is the vector’s distance between the pixel (a, b) as cited in eqn.3 and the angle 6. The ‘6’ is the angle between s and x axis (represented as and 6 = tan-1( ; ).
s = ^a 2 + b 2 (3)
The radial polynomial RPk l (s) is represented as
RPk,(s) = yk-|l|(—1)£------(2k+1 t)!------s(k-£) (4)
k'l t-0 t!(k-|l|-t)!(k+|l| + 1-t)!
In the above equation, RPk-l(s') = RPk l(s')
As far as images are concerned, the pseudo zernike moments are computed by taking the pixel coordinates into account. Initially, a linear mapping transformation is carried out, in order to normalize the pixel coordinates. In simple words, the centre point of the image is considered as the origin point and the pixels are connected to the circle. Generally, the linear mapping transformation connects Q X Q image, such that it encloses a unit circle within it. However, the pixels which are located outside the unit circle are not considered for computation of pseudo zernike moments. This leads to loss of useful information being possessed by the pixels. As the information possessed by each and every pixel is very important, this work encloses the entire Q X Q image in a unit circle. This results in the preservation of pixel information. The linear mapping transformation is carried out in the following way.
aP = -^ + -^v;v = 0,1,2,...(Q-1)
2Q — 1
bu=^--^u;u = 0,1,2,...(Q-1)
2Q — 1
As this work deals with images, the pseudo zernike moments are computed by the following equation.
PZMKl(f(av,bu)) =
“ v Z Q—1 P^ (a„ bu)f(av, bu)
't/l (Q )
A(Q) is defined as the total count of pixels in an image before the process of normalization and the total area of the normalized image. The normalization factor of this
Q2
work is fixed as A(Q) = —. The feature vector of the proposed work is formed by the following equations.
PZWk™-(f(ay,b u )) = [|PZMx , y(f(ay,b u ))|;
x = 0,1,2 ... kmaa, у = 0,1,2 ...x}
This section described the procedure to extract the texture features from the areas of interest by means of pseudo zernike moments and the feature vector is formed. This feature vector plays a significant role in both training and the testing phase. The following subsection presents the classification phase.
-
E. SVM Classification
The SVM classifier is trained with the feature vector being framed in the previous phase. SVM is the supervised algorithm which intends to partition the entities with respect to the degree of margin. Consider a group of training samples with W feature vectors, which are needed to be classified into two classes C i namely (+ve, -ve). This work considers +ve as malignant and – ve as normal. In order to classify between these two classes, a hyperplane is necessary. The hyperplane separates the entities into two different classes and is given below.
^.ji + b > +ve for ci = +ve (9)
^J i + b < -ve for ci = -ve (10)
The classification accuracy is determined by the distance between the hyperplanes. The distance between 2
two different hyperplanes is computed by . The classification results are better, when the ||^|| is minimized. The optimal hyperplane is obtained by applying lagrange’s function and is provided in the following equation.
f(x) = ^^«(^((ji.j) + m (11)
In the above equation, « is the lagrange multiplier which tends to separate the hyperplane ^ i (j i . j) and the threshold to separate hyperplane is denoted by m. This makes sense that when the value of f(x) is greater than 0, then the entity to be classified is +ve else –ve. The original image and the image after the detection of abnormality are presented in fig 3.
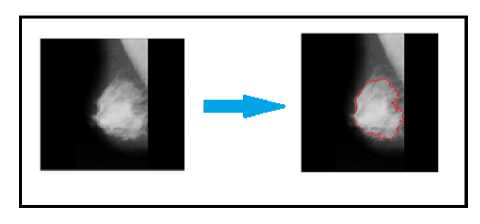
Fig.3. Abnormality classification
f if f(x) = 0; +ve
*• else - ve
Thus, the classification phase is explained. The next section evaluates the performance of the proposed approach.
-
IV. Performance Evaluation
The performance of the proposed approach is evaluated by utilizing the Mammograms Image Analysis Society (MIAS) dataset [19]. This dataset consists of 322 images of size 1024X 1024 pixels, out of which 209 are normal and the remaining images are considered as malignant. The proposed approach is tested by varying the classifier as SVM and k-NN classifier with respect to accuracy, sensitivity and specificity.
Accuracy is the most important performance metric, as the proposed work is related to breast cancer detection. The accuracy rate measures the correctness of the breast cancer detection system. A breast cancer detection system must ensure high accuracy rates, as it is associated with the human disease detection. The accuracy rate is the ratio of the summation of true positive and true negative rates to the total count of images being tested.
Sensitivity rate is computed by considering the count of correctly classified images to the summation of images which are correctly and wrongly classified. The sensitivity rate of a breast cancer detection system must be preferably higher.
Specificity rate is the rate of images which are classified as negative out of the images that are classified negative plus the images that are wrongly classified as positive. The specificity rates of a cancer detection system must be greater.
The accuracy, sensitivity and specificity rates are computed by the following equations.
Ч т
T p +T n Tp+Tn+Fp+Fn
х 100
S t
Т Р
T p +F n
х 100
Spr = -Tn- х 100
рт F p +T n
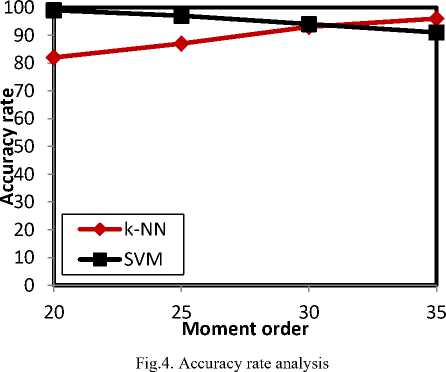
maximum accuracy rate of SVM is 99%, when the moment order is 20. The least accuracy rate that is shown by SVM is 91%, which is observed at 35th moment.
Though k-NN shows better accuracy rates, as the moment order improves, it is not optimal. This is because, when the moment order improves the computational complexity is more. Besides this, the maximal moment order consumes more time to operate, which is not feasible for any CAD system. Thus, the classifier must be able to prove better accuracy rates at the least moment order, which is achieved by SVM.
The following graph fig.5 presents the sensitivity analysis, which is carried out by varying the moment order and classifier.
In the above equations, ат is the accuracy rate, St and SpT are sensitivity and specificity rate respectively. True positive, true negative, false positive and false negative rates are denoted by Tp , Tn, Fp and Fu respectively.
The performance of the SVM is tested against k-NN. The k-NN classifier shows lesser sensitivity and specificity rates, when compared to the SVM classifier. Additionally, the moment order is varied to check the performance. The moment order of pseudo-zernike moments are varied from 20 to 35 for analyzing the performance of k-NN and SVM.
On analysis, it is observed that the k-NN shows better results when the moment order improves. However, SVM shows better results when the moment order is 20 and the performance starts to diminish beyond 20th moment order. The experimental results of the proposed work are presented from fig 4 through fig 7 below.
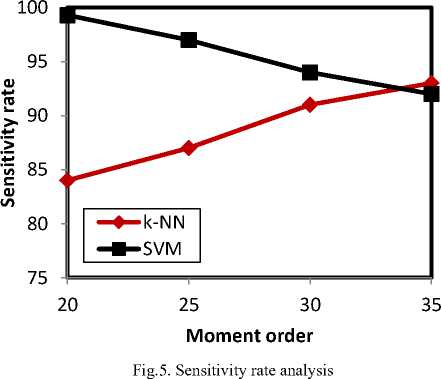
On evaluation, the k-NN classifier shows better sensitivity rates with respect to the moment order growth. The greatest and the least sensitivity rates shown by k-NN classifier are 93% and 84% respectively. The greatest and the least sensitivity rates are observed at 35th and 20th moment orders respectively. Similarly, the SVM classifier’s highest sensitivity rate is 99.3%, which is noticed at 20th moment order. The least sensitivity rate of SVM is detected when the moment order is 35 and is 92%. The following figure fig. 6 shows the specificity analysis.
The maximum accuracy rate being shown by the k-NN classifier is 96%, which happens at 35th moment. The least accuracy rate of k-NN classifier is 82%, which occurred at the 20th moment. On the contrary, the
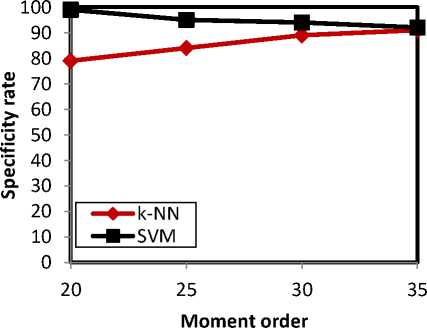
Fig.6. Specificity rate analysis
The specificity analysis revealed that the SVM outperforms k-NN. The highest and the least specificity rates being shown by SVM are 99% and 92%, which are detected at 20th and 35th moment order. k-NN shows the maximum rate of 91% and the least rate of 79%, exactly at 35th and 20th moment order respectively.
From the experimental analysis, it is proven that the accuracy, sensitivity and specificity rate of the proposed approach is comparatively high than the k-NN classifier. It is observed that k-NN performs well with increasing moment order. On the contrary, SVM performs well with the decreased moment order, which means SVM is optimal because of the reduced computational complexity.
The following results in fig.7 prove the potentiality of the pseudo zernike moments against GLCM and Discrete Wavelet Transform (DWT). This results intend to prove the efficacy of the pseudo Zernike moments and emphasizes the effectiveness of PZM features.
PZM shows maximum rates in all the three performance measures, which are accuracy, sensitivity and specificity. The highest accuracy, sensitivity and specificity rates shown by PZM are 98%, 99.12% and 99.31% respectively. The GLCM features serve better than DWT, in combination with SVM. The GLCM features show comparatively good results, whose accuracy, sensitivity and specificity rates are 91%, 90.37% and 92.43% respectively.
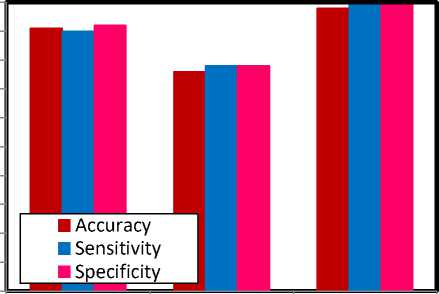
GLCM DWT PZM
Feature extraction techniques
Fig.7. Comparative analysis w.r.t. feature extraction techniques
The above figure shows that the PZM features perform well, when compared to GLCM and DWT. The PZM features show maximum accuracy, sensitivity and specificity rates. The PZM achieves better results owing to its description ability of the features.
-
V. Conclusion
This paper presents an approach to classify the abnormalities found in the mammogram. The entire work is decomposed into four important phases such as preprocessing, segmentation, feature extraction and classification. The pre-processing step removes the unnecessary information from the images. The segmentation process is to divide the image into several segments and the areas of interest are selected for further processing. The feature extraction phase aims to extract texture features from the areas of interest and is achieved by pseudo zernike moments.
Finally, the normal and abnormal regions are classified by means of SVM. The performance of the proposed approach is observed to be satisfactory in terms of accuracy, sensitivity and specificity rates. In future, it is planned to implement the multi-class classification of cancer and the threshold for segmentation process can be selected by optimal techniques.
References Classification of Mammogram Abnormalities Using Pseudo Zernike Moments and SVM
- W.H.Organization,World Health Organization Statistical Information System, URL: http://www.who.int/whosis/mort/en/index.html, 2006.
- R.G.Bird, T.W.Wallace, B.C.Yankaskas, “Analysis of cancers missed at screening mammography,” Radiology, vol. 184, pp. 613–617,1992
- H. Burhenne, L. Burhenne, F. Goldberg, T. Hislop, A.J.Worth, P.M.Rebbeck, and L.Kan, “Interval breast cancers in the screening mammography program of British Columbia: Analysis and classification,” Am. J Roentgenol., vol. 162, pp.1067–1071,1994
- Lee SK, Lo CS, Wang CM, Chung PC, Chang CI, Yang CW, Hsu PC: A computer-aided design mammography screening system for detection and classification of microcalcifications. Int J Med Inform 60(1):29–57, 2000
- R. Nithya, B.Santhi, Mammogram analysis based on pixel intensity mean features, J.Comput.Sci.8(3)(2012)329–332.
- R. Nithya, B.Santhi, Classification of normal and abnormal patterns in digital mammograms for diagnosis of breast cancer, Int.J.Comput.Appl.28(6)(2011) 21–25 (published by Foundation of Computer Science, NewYork, USA).
- J.S.L. Jasmine, S.Baskaran, A.Govardhan, Automated mass classification system in digital mammograms using contourlet transform and support vector machine, Int.J.Comput.Appl.31(9)(2011)54–61(published by Foundation of Computer Science,New York,USA).
- J. Suckling, J.Parker, D.Dance, S.Astley, I.Hutt, C.Boggis, etal., The mammographic images analysis society digital mammogram database, Exerpta Med.1069(1994)375–378.
- A.P.Nunes, A.C.Silva, A.C.D.Paiva, Detection of masses in mammographic images using geometry, Simpsons Diversity Index and SVM, Int.J.Signal Imaging Syst.Eng.3(1)(2010)43–51.
- D.Costa, L.Campos, A.Barros, Classification of breast tissue in mammograms using efficient coding, Bio Med.Eng.OnLine10(1)(2011)55.
- M.A.Berbar, Y.A.Reyad, M.Hussain, “Breast massclassification using statistical and local binary pattern features”, IEEE Computer Society, ISBN 978-1-4673-2260-7, pp.486–490, 2012.
- P.M.Sousa Carvalho, A.C.Paiva, A.C.Silva, “Classification of breast tissues in mammographic images in mass and non-mass using mcintosh diversity index and SVM”, in:P.Perner(Ed.), Machine Learning and Data Mining in Pattern Recognition, Lecture Notes in Computer Science, vol.7376, Springer, Berlin, Heidelberg, 2012, pp.482–494.
- M.Hussain, “False positive reduction using Gabor feature subset selection”,in: 2013International Conference on Information Science and Applications (ICISA), vol.10, 2013, pp.1–5.
- M.Nguyen, Q.Truong, D.Nguyen, T.Nguyen, V.Nguyen, “An alternative approach to reduce massive false positives in mammograms using block variance of local coefficients features and support vector machine”, Procedia Comput. Sci.20(0)(2013)399–405.
- F.Moayedi, Z.Azimifar, R.Boostani, S.Katebi, “Contourlet-based mammography mass classification using the {SVM} family”, Comput.Biol.Med.40(4) (2010)373–383.
- P.GöRgel,A.Sertbas,O.N.Ucan, “Mammographical mass detection and classification using local seed region growing-spherical wavelet transform (LSRG-SWT)hybrid scheme”, Comput.Biol.Med. 43(6)(2013)765–774.
- C.W. Chong, P. Raveendran and R. Mukundan, "The scale invariants of pseudo-Zernike moments", Pattern Anal Applic, vol.6, pp.176-184, 2003.
- Mukundan R and Ramakrishnan KR. "Moment functions in image analysis – theory and applications". World Scientific 1998.
- The new MIAS Database. Available: http://www.wiau.man.ac.uk/services/MIAS/MIASfaq.html.
