Classification of textures based on noise resistant fundamental units of complete texton matrix

Author: Y.Sowjanya Kumari, V. Vijaya Kumar, Ch. Satyanarayana
Journal: International Journal of Image, Graphics and Signal Processing @ijigsp
Article in issue: 2 vol.10, 2018.
Free access
One of the popular descriptor for texture classification is the local binary pattern (LBP). LBP and its variants derives local texture features effectively. This paper integrates the significant local features derived from uniform LBPs(ULBP) and threshold based conversion factor non-uniform (NULBP) with complete textons. This integrated approach represents the complete local structural features of the image. The ULBPs are proposed to overcome the wide histograms of LBP. The ULBP contains fundamental aspects of local features. The LBP is more prone to noise and this may transform ULBP into NULBP and this degrades the overall classification rate. To addresses this, this paper initially transforms back, the ULBPs that are converted in to NULBPs due to noise using a threshold based conversion factor and derives noise resistant fundamental texture (NRFT) image. In the literature texton co-occurrence matrix(TCM) and multi texton histogram (MTH) are derived on a 2x2 window. The main disadvantage of the above texton groups is they fail in representing complete textons. In this paper we have integrated our earlier approach “complete texton matrix (CTM)” [16] on NRFT images. This paper computes the gray level co-occurrence matrix (GLCM) features on the proposed NRFCTM (noise resistant fundamental complete texton matrix) and the features are given to machine learning classifiers for a precise classification. The proposed method is tested on the popular databases of texture classification and classification results are compared with existing methods.
Local binary pattern, textons, uniform local binary pattern, local features
Short address: https://sciup.org/15015939
IDR: 15015939 | DOI: 10.5815/ijigsp.2018.02.05
Text of the scientific article Classification of textures based on noise resistant fundamental units of complete texton matrix
Published Online February 2018 in MECS
Texture analysis has been studied extensively[1-8] from the past two decades due to its wide range of applications in industrial inspections [9], food science [10, 11], content-based image retrieval [12, 13, 14], texture classification [15, 16, 17], medicine [18, 19, 20], face recognition [21, 22, 23], and age classification [24, 25, 26] among others. The goal of texture classification is assigning a sample image to one of the texture classes that are available.
Texture provides a significant and impressive cue about the physical information of object surfaces, however there is no unique definition for texture. The texture classification methods can be categorized into: spectral, statistical, model-based, structural and learning based approaches [27]. The statistical, structural or spectral methods are the oldest texture measures that are used for texture classification [28, 29]. They have attained good results for simple classification tasks, however they are complex in nature and are unable to solve the general problems of natural material representation and recognition under varying lighting and viewing conditions. To overcome this present paper integrated structural features of textures in terms of ULBP and textons with GLCM and this has resulted in significant improvements in texture classification. The Model-based methods [30, 31] are not widely used for image classification. The learning based methods like texton dictionary [32-34] and Bag-of-Features (BoF) framework [35] require a representation and learning stage to derive the feature vector of the image. The Bag-of-Words (BoW) [32, 33, 35, 37, 38] approach has become very popular and successful in texture classification tasks. The BOW represents the texture image statistically as histograms over a discrete texton dictionary. The local descriptors play a vital role In BOW, and that is the reason they have received considerable attention [32, 33, 37, 38] in these years. The local approaches are generally grouped in to sparse and dense type approaches. The sparse approach uses appearance descriptors as a sparse set of interested points and the popular descriptors of this model include SPIN, SIFT and RIFT [38, 39]. The dense approaches use appearance descriptors i.e., pixel by pixel [32, 33, 37, 38]. The interested points of a sparse set of local or region detectors sometimes miss important texture primitives and thus may not result a robust classification. The popular dense descriptors are the filter bank of Leung and Malik [37], Gabor filters [1], the MR8 [32], the filter bank of Schmid [36, 37] and many others. The design of a filter bank is nontrivial and likely to be application dependent. The supremacy of filter bank-based descriptors has been challenged by several authors in the literature [33, 40]. A superior classification than filter banks are achieved by the authors [33, 40] by considering the local intensity differences or local patches. In this regard sparse modeling of local texture patches are proposed in the literature, however it is time consuming [40]. The simple, elegant and efficient local texture descriptor LBP [41] is particularly an important work in this direction. The LBP uses a pre-defined texton dictionary and does not need to use nearest neighbor to obtain the texton labels, a time consuming step.
The term texton on a neighborhood is defined by the adjacent elements, of a grid, with the same pixel value and it was proposed by Julesz [42]. With the help of textons, one can define complex structures with simple primitives. Texture is also described in terms of microprimitives (textons) and their statistical placement rules. The texton co-occurrence matrices (TCM) [43] and MTH [14] describe the spatial correlation of textons for image retrieval. The TCM and MTH describe the partial correlation because they define only few textons with similar intensities on a 2 x 2 grid. To addresses this, in our earlier work [16], we have proposed complete texton matrix (CTM) [16] that defines all possible, eleven textons of a 2 x 2 grid. The CTM approach achieved a better classification than TCM and MTH. The present paper integrates the color, fundamental units of texture, noisy patens (NULBP) that are closer to ULBP, and shape features. And this paper, derives noise resistant fundamental complete texton matrix (NRFCTM) to describe image features for a precise texture classification.
The rest of this paper is organized as follows. In Section 2, the proposed NRFCTM is presented, with a brief discussion on LBP, ULBP, TCM, MTH and CTM concepts. In Section 3, results, discussions and performance comparisons with other methods is carried out under various natural databases. Section 4 concludes the paper.
-
II. Proposed Method
-
A. Local binary pattern (LBP)
The popularly used local texture descriptor by many researchers in different applications of image and video processing is the local binary pattern (LBP) introduced by Ojala [2]. The LBP achieved its popularity because it is simple, effectual and grey scale invariant texture primitive. The LBP measures effectively and precisely the local attributes of the neighborhood thus derives a local structure. The LBP operator is initially defined on a 3×3 neighborhood or second order neighborhood around the centre pixel Z c (Fig.1). The LBP estimates the neighboring pixels using bilinear interpretation on the circle of radius of R around Zc (Fig.1). Later it is also extended to the third order neighborhood. Thus the local gray level structure is summarized more precisely by LBP around the centre pixel Zc. The LBP code on a 3x3 neighborhood with 8 neighboring pixels i.e. N= 8 and over a radius R=1 around Z c is computed by equation 1.
LBPn,r= Z"i/(z) . 2/-1 (1)
/(z) = {
1,if S(z1-zc) > 0
0 , otherwise
Where zc is the centre pixel, zi is the neighboring pixel and N is the total number of neighboring pixels. The LBPN,R derives the unique codes or histogram of 2N bins.
|
z 1 |
z 2 |
z 3 |
|
z 8 |
Z c |
z 4 |
|
z 7 |
z 6 |
z 5 |
(a) 3x3 sample window
|
58 |
47 |
33 |
|
82 |
58 |
68 |
|
70 |
97 |
65 |
(b) sub window
|
1 |
0 |
0 |
|
1 |
1 |
|
|
1 |
1 |
1 |
(c)LBP pattern
(d) LBP Code
Fig.1. LBP code generation process.
The major factors for considering LBPs in many applications is, invariant to monotonic intensity changes. Hence it is robust to illumination and contrast variations. LBP is sensitive to noise and small pixel fluctuations.
-
B. Uniform LBP
The basic LBP produces an eight bit patterns i.e. LBP code ranges from 0 to 2N-1 i.e. directly proportional to number of neighborhood pixels ‘N’ considered, but not on R. Considering such a huge number of patterns especially when combing these structural representative codes with statistical measures such as GLCM and textons may become a complex and monotonous task. Later it is found that most of the LBPs are not playing a significant role in image classification and analysis and this has made to derive the significant patterns among LBPs. The significant and fundamental patterns of LBP are identified based on the number of transitions from 0 to 1 or 1 to 0 and they are named as Uniform LBP (ULBP). This will reduce the width of the LBP histogram and thus reduces the overall complexity. The ULBP represents the basic fundamental structural information such as borders, corners, lines and edges. If the LBP results 0 or 2 circular transitions from 1 to 0 or 0 to 1, then such patterns are named as ULBPs and rest of the patterns are NULBP’s. The NULBP are treated as noisy patterns. There will be either 0 or 2 or 4 or 6 or 8 circular transitions from 0 to 1 or 1 to 0 on 3 x 3 LBP. The following are noted from a 3 x 3 LBP neighborhood:
There will be 58 (N * (N-1) +2) different ULBPs. The ULBPs are assigned a unique index code since they represent most significant information. Interestingly the representations of ULBPs are only 22.66% of total LBP codes. However ULBP accounts more than 85% of windows in texture [44] and in facial images [45] and the remaining are NULBPs. That’s why ULBPs are statistically more significant and NULBPs are not.
The numbers of NULBP are 198 (256-58) on a window with 8-neighboring pixels i.e. they constitutes 77.34% of total LBP codes; However their appearance in the textures is very poor (less than 10% of the windows generate NULBS). That is the reason researchers considered NULBP’s as miscellaneous;
-
C. Conversions of noisy ULBPs in to ULBPS (NULBPS that are closer to ULBPs)
Some researchers [46, 47, 48] argued and proved that by considering a subset of NULBPS along with ULBPs increased the overall performance. The authors concatenated the derived subset of NULBPs with ULBPs for classification purpose and achieved a little improvement when compared to ULBP. The main disadvantage of the above methods is they have not considered the noise factor in deriving the sub sets of NULBPs. The basic disadvantage is, a small fluctuation of noise may convert a ULBP in to a NULBP (Fig. 2 and 3) and this degrades the overall performance of the above methods. The main reason for this is the LBP and other neighborhood approaches make use of the sign of pixel differences to compute its code and that’s why they are more vulnerable to noise when they are small (Fig. 2 and 3). Further more than 90 % of the texture image windows are uniform patterns, which indicate there are more number of chances for ULBPS to be converted in to NULBPS due to small fluctuation of noise. If more than 4 % ULBPs are transformed in to NULBPs (fundamental information is transformed in to miscellaneous) by random or any other noise then overall classification rate will be degraded, even though if one considers a sub set of NULBPs.
|
126 |
127 |
100 |
|
100 |
128 |
30 |
|
170 |
90 |
20 |
(a) 3x3 window
|
0 |
0 |
0 |
|
0 |
0 |
|
|
1 |
0 |
0 |
01000000 ULBP
LBP pattern
Fig.2. Original 3x3 grid without noise and formation of ULBP.
|
128 |
129 |
100 |
|
100 |
128 |
34 |
|
170 |
92 |
20 |
(a) 3x3 window
|
1 |
1 |
0 |
|
0 |
0 |
|
|
1 |
0 |
0 |
LBP pattern
NULBP
Fig.3. Noisy window of Fig.2 and transformation of ULBP into NULBP.
To overcome this present paper derived a threshold ‘t’ and conversion factor ‘c’ for a NULBP window. By this the NULBP which is very closer to ULBP are transformed in to ULBP. The proposed NRFT image, initially identifies the floating pixels of a NULBP window. A neighboring pixel of a NULBP is treated as a floating pixel if the absolute grey level intensity of the centre pixel Z c and neighboring pixel Z i falls within the range of threshold ‘t’ and such windows are treated as floating windows. A floating window may be transformed into ULBP, by complementing one or ‘c’ number of floating pixels starting from least significant bit (LSB) position.
The neighboring pixels that differs with centre pixel widely (in terms of grey levels) will have no effect by random noise in the formation of binary patterns i.e. formation of ULBP’s (Fig. 3(b)) the neighboring pixels with green color); however if the difference (d) of grey levels is minimum i.e.( d <= t ), the noise may transform a ULBP into NULBP (Fig. 3(b), the neighboring pixels with red color). The proposed NRFT scheme, applies threshold only to NULBP windows and determines the floating bits and try to transom it into ULBP if possible. A floating window may be transformed into uniform window (ULBP) by complementing one or more floating bits, given by ‘c’, from least significant bit (LSB), thus the code variation is least. The Fig. 3 will be converted into ULBP for a threshold value t=2 and for a maximum conversion factor c=2. In Fig. 3(b) the floating bits /pixels are shown in red color. The intensity values of the pixels with green color are also changed due to noise; however they have no effect in the transformation process of NULBP.
-
D. Complete Texton Matrix (CTM) Approach
The pixel based methods are not popular in image processing applications because they could not define neither local nor regional properties of a texture. The term texture defines a neighboring property: the value of a pixel at location (x,y) not only depends upon the value of the pixel at that location but also depends upon the neighboring pixel values surrounded by that pixel. Pattern based methods are also popular in the image processing. A pattern is generally formed based on some similarities with the neighboring pixels. The definition of a texton is based on the similarities with the neighboring pixels of a grid or region. Thus the textons have close relationship between the image attributes.
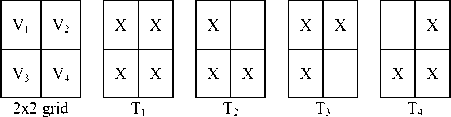
In literature TCM [43] and MTH [14] are popular methods based on textons. They have not defined complete set of textons. In our earlier work[16], we have listed out all possible number of textons on a 2 x 2 grid and based on this we have derived complete texton matrix [43]. All the three methods defined textons on a 2 x 2 grid. The CTM defined the total number of available textons on a 2 x 2 grid i.e. the textons with two, three and four pixels of exactly the similar grey level values. The CTM [16] has defined the following 11 textons i.e. complete range of textons on 2 x 2 grid with four pixels {v 1 , v 2 , v 3 , v 4 } as shown in Fig.4. The texton T 1 will be formed if all four pixels in the 2 x 2 grid exhibit exactly the similar values. The textons T 2 , T 3 , T 4 and T 5 will be resulted if any of the three pixels of the 2x 2 grid shows the same intensity value. The textons T6, T7, T8, T9, T10 and T11 will be formed if and only if any two pixels of 2 x 2 grid exhibits the same intensity values. The TCM defined only six types of texton of CTM i.e... T 1 , T 2 , T 3 , T 4 , T 5 and MTH approach only defined four types of texton types T 6 , T 7 , T 8 and T 9 .
|
X |
|
|
X |
T 10
|
X |
X |
T 11
-
Fig.4. The complete range of textons derived by CTM.
The following process is used by CTM in detecting textons on a 2 x 2 grid:
Step 1: If the (texton type == T 1 ) (the four pixels with similar values) then go to step 4.
Step 2: if ( texton type == ( T 2 or T 3 or T 4 or T 5 ) then assign zero value to the pixel that is not part of the texton type . And go to step 4.
Step 3: if ( texton type == ( T6 or T7 or T8 or T9 or T10 or T11) then assign zero value to the pixels that are not part of the texton type. And go to step 4.
Step 4: Consider the next 2 x 2 grid with a step length of 2. And repeat the process from step one on entire image.
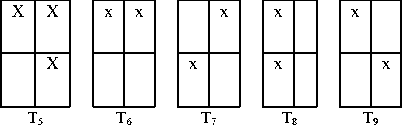
In the above process the step 1, 2, 3 verifies for the texton on a 2 x 2 grid with four, three and two similar values of pixels respectively. This process overcomes the ambiguity. That is for example CTM identifies texton type 1 if all four pixels have similar intensities, instead of other texton types. The advantage of CTM over TCM is, TCM only detects the texton types of three or four pixels of similar values and computes the textons with a step length of 1. This process is time consuming and fails in representing textons when two pixel values are of similar values. The MTH recognizes only few texton types with two similar values on a 2 x 2 grid (T6, T7, T8, T9) and this creates an ambiguity especially when one wants to represent the 2 x 2 grid with texton indexes, as shown in Fig.5. In Fig.5 the MTH completely fails in identifying texton types with two identical values i.e. T10 and T11 and assigns entire grid a value zero. The reason for this is the MTH is not defined the texton type T10 and T11. Further if one wants represent the 2 x 2 grid with texton indexes the MTH creates an ambiguity either to represent with T6 or T9 as shown in Fig.6. The CTM [16] and TCM [43] will have unique index on this as shown in Fig.6.
The working mechanisms of MTH[14], TCM[43] and CTM [16] for the image neighborhood of 8x8 of Fig.7 are given in Fig.8, 9 and 10 respectively.
v 1 v 2
v 3 v 4
2x2 grid
(a)
|
7 |
8 |
|
16 |
16 |
|
8 |
20 |
|
10 |
20 |
T 10 T 11
(b) (c )
Fig.5. The texton types with two identical pixels that are not part of MTH.
Fig.6. Ambiguity in identifying texton types in MTH.
|
24 |
20 |
30 |
42 |
22 |
22 |
|
45 |
45 |
20 |
42 |
60 |
60 |
|
17 |
28 |
58 |
58 |
75 |
75 |
|
40 |
52 |
58 |
10 |
75 |
75 |
|
0 |
28 |
22 |
22 |
16 |
21 |
|
28 |
28 |
12 |
14 |
14 |
16 |
Fig.7. Sub window of original image.
|
0 |
0 |
0 |
0 |
0 |
0 |
|
0 |
0 |
0 |
0 |
0 |
0 |
|
0 |
0 |
58 |
58 |
75 |
75 |
|
0 |
0 |
58 |
0 |
75 |
75 |
|
0 |
28 |
0 |
0 |
0 |
0 |
|
28 |
28 |
0 |
0 |
0 |
0 |
Fig.8. Final Texton image in TCM.
|
T 6 |
||
|
T 6 /T 7 /T 8 |
T 1 /T 6 / T 7 /T 8 /T 9 |
|
|
T 7 |
T 6 |
T 9 |
|
0 |
0 |
0 |
0 |
22 |
22 |
|
0 |
0 |
0 |
0 |
60 |
60 |
|
0 |
0 |
58 |
58 |
75 |
75 |
|
0 |
0 |
58 |
10 |
75 |
75 |
|
0 |
28 |
22 |
22 |
16 |
21 |
|
28 |
28 |
12 |
14 |
14 |
16 |
(a) MTH texton (b) Final Texton image in MTH identification
Fig.9. Working mechanism of MTH.
|
T 11 |
T 10 |
T 6/ T11 |
|
T 3 |
T 1 |
|
|
T 4 |
T 6 |
T 9 |
|
0 |
0 |
0 |
42 |
22 |
22 |
|
45 |
45 |
0 |
42 |
60 |
60 |
|
0 |
0 |
58 |
58 |
75 |
75 |
|
0 |
0 |
58 |
0 |
75 |
75 |
|
0 |
28 |
22 |
22 |
16 |
0 |
|
28 |
28 |
0 |
0 |
0 |
16 |
-
(a) CTM texton (b) Final Texton image in CTM
identification
Fig.10. The working mechanism of the CTM.
This paper initially converts the given image in to NRFT indexed image. On NRFT indexed image the CTM [16] is derived. This results NRFCTM and GLCM features are applied with three distance factors d=2, 3, 4. The GLCM features i.e., Homogeneity, Energy, Contrast and Correlation (Eqns. 2-5) are derived under four rotation angles i.e., 00, 450, 900 and1350, for each d value. The average feature value on 00, 450, 900 and1350 for each ‘d’ value is computed and considered for the classification purpose on machine learning classifiers like Liblinear, LibSVM and Naivebayes.
Homogeniety or Angular Second Moment (ASM):
ASM= ∑ iG=-01 ∑ jG=-01 {P(i, j)} 2 (2)
ASM is a measure of homogeneity of an image. A homogeneous scene will contain only a few grey levels, giving a GLCM with only a few but relatively high values of P (i, j ). Thus, the sum of squares will be high.
Energy :
У P ( i , j ) 2
Energy = i , j (3)
Contrast :
Contrast = ∑ n G = - 0 1 n 2 {∑ i G =1 ∑ j G =1 P(i, j)}, |i -j| = n (4)
This measure of contrast or local intensity variation will favor contributions from P (i, j) away from the diagonal, i.e. i ! = j.
Correlation:
Correlation = ∑iG=-01 ∑jG=-01 {iXj}XP(i,j)-{µ x Xµ y }
σxXσy
Correlation is a measure of grey level linear dependence between the pixels at the specified positions relative to each other.
The proposed NRFCTM is different from CTM of our earlier approach. In CTM the grey level range of image is quantized or partitioned in to ‘n’ groups, without any significance or without any predefined criteria. In NRFCTM the image grey levels are is quantized based on significant attributes of textures, i.e. the image is indexed with fundamental units without any noise (0 to, 58, where 0 is assigned to all NULBPS). The noise part is taken care by the threshold ‘t’ on NULBP. Further this paper derived GLCM on NRFCTM. The size of NRFCTM is 59 x 59. The NRFCTM can express the spatial correlation of textons and has the discrimination power of texture, color, and shape features. Color and texture have close relationship via fundamental micro-structures in natural images.
-
III. Experimental Results and Discussions
The proposed NRFCTM is tested on four popular data bases Brodtaz [49], Outex -TC-10, Outex-TC-12 [50] and UIUC[51]. The classification results of this paper i.e., NRFCTM is compared with LBP (ULBP)[52], the LTP [6] descriptors, CLBP-SMC [53], TCM [43] and MTH[14].
The Brodtaz database consists of gray level images and the other databases contain color images (mostly in RGB). The images of these databases are captured under varying lighting, illumination and other conditions with varying sizes. Each database consists of various classes and each class consists of various images. We selected 30 different texture images with a 512x512 pixels size from the Brodtaz database. The sample images are show in Fig.11. We divided each image into 16 non-overlapped texture images of size 128x128 and this results a dataset of 480 images (30x16). The present study used 60 images for training purpose (two images from each class). The remaining 420 texture images (14 texture images per class) are used for testing purpose.
Fig.11. Samples of 30 classes randomly selected from the Brodatz database.
The Outex database contains two test suits: Outex-TC-
10(TC12-000) and Outex-TC-12(TC12-001). There are 24 classes of texture images in both TC10 and TC12. These images are captured under three illumination conditions namely 1. “inca’ 2. t184 3. Horizon with nine rotation angles i.e. 0o, 5o, 10o, 15o, 30o, 45o, 60o, 75o, 90o. The resolution of each image in TC10 and TC12 are 128x128. There are 20 images under each illumination condition and in each rotation angle. The present paper considered the Outex images under illumination condition “inca” with 0o of rotation, for training purpose. The images with non-zero rotation angles with three illumination conditions are used for testing purpose. The sample images from Outex database are shown in Fig.12.
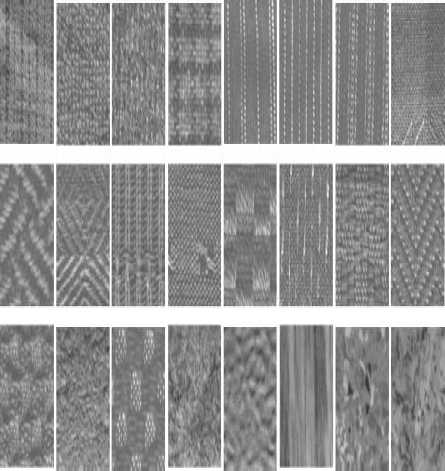
Fig.12. The sample images of 24 classes from Outex database.
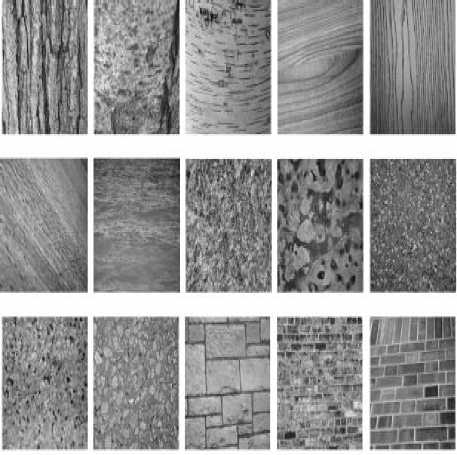
Fig.13. Samples of 25 classes from the UIUC database.
The sample images of UIUC database are shown in Fig.13. This database includes 25 classes and each class consists of 40 images resulting a total of 1000(25x40) texture images. The size of each image is 640x480. The present paper considered one texture image from each class and partitioned it into 15 non-overlapped images of size 128x128. This results a total of 375 (25x15) images and out of this 50 images (2 images from each class) are used for training purpose and reaming 325 images (25x13) are used for test purpose.
The average classification rate of each texture dataset on the proposed NRFCTM descriptor using Liblinear, LibSVM classifiers and Naivebayes classifiers with different d values are given in Table 1(a) and 1(b) respectively. The last row of Table 1(a) and 1(b) gives the average classification rate. All the classifiers exhibited a slightly high classification rate for d value 2 followed by 3 and 4. The liblinear and lib SVM classifiers on the proposed method exhibited more or less the similar average classification rate on all considered databases and there is hardly 1 % of difference. In the rest of the paper, the classification rate of SVM classifier for‘d’ value =2 is considered on the proposed NRFCTM descriptor.
Table 1 (a). Average classification rate of NRFCTM with different d values using Liblinear and LibSVM classifiers on different databases.
|
Database s |
Liblinear |
LibSVM |
||||
|
d=2 |
d=3 |
d=4 |
d=2 |
d=3 |
d=4 |
|
|
Brodtaz [49] |
96.28 |
96.01 |
95.78 |
93.12 |
93.20 |
92.15 |
|
Outex _TC10 [50] |
97.32 |
97.12 |
96.89 |
95.88 |
94.68 |
93.65 |
|
Outex_T C12[50] |
96.12 |
96.02 |
95.56 |
93.11 |
92.86 |
91.54 |
|
UIUC [51] |
95.68 |
95.21 |
94.88 |
92.14 |
91.47 |
90.45 |
|
Average |
96.35 |
96.09 |
95.78 |
93.56 |
93.05 |
91.95 |
Table 1 (b). Average classification rate of NRFCTM with different d values using Naivebayes classifiers on different databases.
|
Databases |
Naivebayes |
|||
|
d=2 |
d=3 |
d=4 |
||
|
Brodtaz [49] |
89.89 |
88.69 |
87.65 |
|
|
Outex _TC10[50] |
91.25 |
90.15 |
89.88 |
|
|
Outex_TC12[50] |
88.69 |
87.68 |
86.48 |
|
|
UIUC[51] |
87.98 |
86.14 |
85.63 |
|
|
Average |
89.45 |
88.17 |
87.41 |
|
Table 2 presents the classification rates of different methods on the considered data bases. The NRFCTM descriptor outperforms all the other techniques and shows large improvement than ULBP and LTP descriptors. The CLBP-SMC, TCM, MTH descriptors have shown improved classification rate on Brodtaz textures. The CTM has shown high classification rate than TCM and
MTH. The performances of ULBP and LTP descriptors have shown improvement on Outex database when compared to Brodtaz texture database. The classification accuracy for TC_10 is significantly higher than that for TC-12, because the training and testing images are under the same illumination. The classification rate on UIUC database is very poor for ULBP [52] and LTP [6] descriptors and moderate for CLBP-SMC [53], TCM [43] and MTH [14] this may be due to lot of orientation and scale changes in UIUC database. The proposed descriptor achieved high classification rate. This clearly indicates the NRFCTM outperformed other methods because it integrated the merits of ULBP, noisy ULBP and CTM to capture more spatial information to increase the classification accuracy.
Table 2. The classification accuracy on the considered databases using different descriptors.
|
Methods |
Classification rate on databases |
||||
|
Brodtaz |
TC-10 |
TC-12 |
UIUC |
||
|
“t” |
“h” |
||||
|
ULBP[52] |
40.28 |
84.87 |
65.19 |
64.03 |
54.65 |
|
LTP[6] |
57.50 |
94.14 |
75.88 |
73.96 |
67.16 |
|
CLBP_SMC[53] |
85.23 |
96.56 |
90.30 |
92.29 |
87.64 |
|
TCM [43] |
86.57 |
94.22 |
90.68 |
92.65 |
85.70 |
|
MTH[14] |
87.25 |
93.56 |
89.8 |
91.87 |
87.83 |
|
CTM[16] |
91.56 |
96.1 |
90.10 |
91.42 |
91.18 |
|
NRFCTM |
96.28 |
97.32 |
95.98 |
96.12 |
95.68 |
Proposed and existing methods
-
• Brodtaz ^*—TC-10 • TC-12 "t"
-
• Tc-12 "h" • UIUC
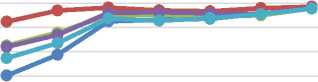
Fig.14. Performance comparison of proposed method and existing methods on considered databases.
The classification rate on all four databases using the proposed and other descriptors is plotted in Fig.14 and following are noted.
-
1. The performance of ULBP and LTP are too low on Brodtaz textures when compared to other three texture databases. Out of these two, ULBP has shown low performance.
-
2. The classification rate of all descriptors is little low on Brodtaz textures around 85% to 90%, however the NRFCTM have achieved a classification rate around 95%.
-
3. The performance of all descriptors is high on Outex database when compared to Brodtaz and UIUC databases.
-
4. The performance of NRFCTM is very high on all databases followed by other descriptors MTH, CLBP-SMC, TCM, LTP and ULBP.
-
IV. Conclusion
In this paper we have integrated ULBP, noisy ULBP with CTM and derived NRFCTM descriptor. GLCM features are derived on NRFCTM to describe image features that represent both the spatial correlation of texture orientation and texture color based on textons for efficient texture classification. The present paper derived NRFCTM with different values of d and with different rotations. The dimension of NRFCTM is 59 X 59. The present method exhibited high classification rate because i) due to the consideration of ULBP ii) by transforming back the ULBPS that are effected by noise i.e., a subset of NULBPs that are closer to ULBPs iii) by considering the complete set of textons on a 2 x 2 grid instead of partial and ambiguous texton sets iv) by deriving GLCM features. The experimental results on all considered databases validated that our methods has strong discrimination power of color, texture and shape features, and outperforms other LBP based methods.
References Classification of textures based on noise resistant fundamental units of complete texton matrix
- Manjunath, B.S., Ma, W.Y., 1996. Texture features for browsing and retrieval of image data. IEEE Trans. on Pattern Anal. and Machine Intelligence 18, 837–6842.
- Ojala, T., Pietikainen, M., Maenpaa, T., 2002. Multiresolution gray-scale and rotation invariant texture classification with local binary patterns. IEEE Trans. on Pattern Anal. and Machine Intelligence 24, 971–987.
- Han, J., Ma, K.K., 2007. Rotation-invariant and scale-invariant gabor features for texture image retrieval. Image and Vision Computing 25, 1474–1481.
- Liao, S., Law, M., Chung, A., 2009. Dominant local binary patterns for texture classification. IEEE Trans. Image Process. 18, 1107–1118.
- Ren, J., Jiang, X., Yuan, J., 2013. Noise-resistant local binary pattern with an embedded error-correction mechanism. IEEE Trans. Image Process. 22, 4049–4060.
- Tan, X., Triggs, B., 2010. Enhanced local texture feature sets for face recognition under difficult lighting conditions. IEEE Trans. Image Process. 19, 1635–1650
- Guo, Z., Zhang, L., Zhang, D., 2010. A completed modeling of local binary pattern operator for texture classification. IEEE Trans. Image Process. 19, 1657–1663.
- Khellah, F., 2011. Texture classification using dominant neighborhood structure. IEEE Trans. Image Process. 20, 3270–3279.
- H.Y.T.Ngan, G.K.H.P and, N.H.C.Yung, Automated fabric defect detection—a review, Image Vis. Comput. 29 (2011)442–458.
- C. Zheng,D.-W.Sun,L.Zheng, Recent applications of image texture for eva- luation of food qualities—a review, Trends Food Sci.Technol.17 (2006) 113–128.
- E. Cernadas, P.Carrión, P.G.Rodríguez, E.Muriel, T.Antequera, Analyzing magnetic resonance images of Iberian pork loin to predict its sensorial characteristics, Comput. Vis. Image Underst.98 (2005)345–361.
- V.Vijaya Kumar, A. Srinivasa Rao, YK Sundara Krishna, “Dual Transition Uniform LBP Matrix for Efficient Image Retrieval”, I.J. Image, Graphics and Signal Processing (IJIGSP), Vol. 8, 2015, pp: 50-57.
- A Obulesu, JS Kiran, V. Vijay Kumar, “Facial image retrieval based on local and regional features” , IEEE- 2015 International Conference on Applied and Theoretical Computing and Communication Technology (iCATccT), 29-31 Oct. 2015, pp:841 – 846.
- Guang-Hai Liu a, LeiZhang b, Ying-KunHou d, Zuo-YongLi c, Jing-YuYang, Image retrieval based on multi-texton histogram, Pattern Recognition, 43(2010),2380–2389
- B. Sujatha, V. VijayaKumar, M. Chandra Mohan, “Rotationally invariant texture classification using LRTM based on fuzzy approach”, International Journal of Computer Applications (IJCA), Vol.33, Iss.4, 2011, pp.1-5, ISSN: 0975 – 8887.
- Y.Sowjanya Kumari, V. Vijaya Kumar, Ch. Satyanarayana, Texture Classification Using Complete Texton Matrix, I.J. Image, Graphics and Signal Processing, 2017, 10, 60-68
- G. Martens, C. Poppe, P. Lambert, R. Van De Walle, 2010, “Noise- and compression-robust biological features for texture classification”, Visual Comput. pp: 1–8.
- Neeraj Sharma, Amit K. Ray, Shiru Sharma, K. K. Shukla, Satyajit Pradhan, and Lalit M. Aggarwal2, Segmentation and classification of medical images using texture-primitive features: Application of BAM-type artificial neural network, J Med Phys. 2008 Jul-Sep; 33(3): 119–126.
- V. VijayaKumar,N. GnaneswaraRao, A.L.Narsimha Rao“RTL: Reduced texture spectrum with lag value based image retrieval for medical images” , International Journal of Future Generation Communication And Networking (IJFGCN), Vol. 2, Iss. 4, 2009, pp.39-48, ISSN: 2233-7857.
- Saima Anwar Lashari* , Rosziati Ibrahim, A Framework for Medical Images Classification Using Soft Set, The 4th International Conference on Electrical Engineering and Informatics (ICEEI 2013), Procedia Technology 11 ( 2013 ) 548 – 556
- V. Vijaya Kumar, K. Srinivasa Reddy, V. Venkata Krishna , “Face Recognition Using Prominent LBP Model”, International Journal of Applied Engineering Research , Vol. 10, Iss. 2, 2015, pp. 4373-4384, ISSN: 0973-4562
- K. Srinivasa Reddy, V.Vijaya Kumar, B.Eshwarareddy, “Face Recognition based on Texture Features using Local Ternary Patterns”, I.J. Image, Graphics and Signal Processing (IJIGSP), Vol.10, 2015, pp: 37-46, ISSN: 2074-9082.
- Mohd.Abdul Muqeet, Enhancing Face Recognition Performance using Triplet Half Band Wavelet Filter Bank, I.J. Image, Graphics and Signal Processing, 2016, 12, 62-70
- Pullela R Kumar, V. Vijaya Kumar, Rampay.Venkatarao, “Age classification based on integrated approach”. International Journal Of Image, Graphics And Signal Processing (IJIGSP), Vol. 6, Iss.7, 2014, pp. 50-57, ISSN: 2074-9082.
- Mohammad Saber Iraji , Mohammad Bagher Iraji , Alireza Iraji, Razieh Iraji , Age Estimation Based on CLM, Tree Mixture With Adaptive Neuro Fuzzy, Fuzzy Svm, I.J. Image, Graphics and Signal Processing, 2014, 3, 51-57
- Olufade F. W. Onifade, Damilola J. Akinyemi, GWAgeER – A GroupWise Age Ranking Framework for Human Age Estimation, I.J. Image, Graphics and Signal Processing, 2015, 5, 1-12
- M. Petrou,P.García-Sevilla, Image Processing: Dealing With Texture, Wiley, England, 2006.
- R. M. Haralick, K. Shanmugam, I. Dinstein, Textural features for image classification, IEEE Trans. Syst., Man, and Cyber. 3 (1973) 610–621.
- G. M. Haley, B. S. Manjunath, Rotation-invariant texture classification using a complete space-frequency model, IEEE Trans. Image Processing, 8, (1999) 255–269.
- H. Deng,D. A.Clausi, Gaussian MRF rotation-invariant features for image classification, IEEE Trans. Pattern Anal. Mach. Intell. 26(7) (2004)951–955.
- P.Campisi, A.Neri, G.Panci, G.Scarano, Robust rotation-texture classification using a model based approach, IEEE Trans. Image Process.13(6)(2004) 782–791.
- M. Varma, A. Zisserman, A statistical approach to texture classification from single images, Int. J. Comput. Vis. 62 (1–2) (2005) 61–81.
- M. Varma, A. Zisserman, A statistical approach to material classification using image patches, IEEE Trans. Pattern Anal. Mach. Intell. 31 (11) (2009) 2032–2047.
- J.Z.H. Zhao,J.Liang, Continuous rotation invariant local descriptors for texton Dictionary based texture classification, Comput. Vis. Image Underst. 117 (2013) 56–75.
- S. Alvarez,M.Vanrell, Texton theory revisited: abag-of-words approach to combine texton,PatternRecognit.45(2012)4312–4325.
- Y.Huang,Z.Wu,L.Wang,T.Tan, Feature coding in image classification: acomprehensive study, IEEE Trans.Pattern Anal. Mach. Intell.36(3)(2014)493–506.
- T. Leung, J. Malik, Representing and recognizing the visual appearance of materials using three-dimensional textons, Int. J. Comput. Vis. 43 (1) (2001) 29–44.
- J. Zhang, M. Marszalek, S. Lazebnik, C. Schmid, Local features and kernels for classification of texture and object categories: a comprehensive study, Int. J. Comput. Vis. 73 (2) (2007) 213–238.
- S. Lazebnik, C. Schmid, J. Ponce, A sparse texture representation using local affine regions, IEEE Trans. Pattern Anal. Mach. Intell. 27 (8) (2005) 1265–1278.
- J. Xie, L. Zhang, J. You, D. Zhang, Texture classification via patch-based sparse texton learning, IEEE International Conference on Image Processing (ICIP), 2010, pp. 2737–2740.
- T. Ojala, M. Pietikäinen, D. Harwood, A comparative study of texture measures with classification based on feature distributions, Pattern Recognit. 29 (1) (1996) 51–59.
- Julesz B , Textons, the elements of texture perception, and their interactions. Nature 290, 1981, 91-97.
- Guang-Hai Liu, Jing-Yu Yang, Image retrieval based on the texton co-occurrence matrix, Pattern Recognition 41 (2008) 3521 – 3527.
- M. Inen, M. Pietikäinen, A. Hadid, G. Zhao, and T. Ahonen, “Computer Vision Using Local Binary Patterns”, vol. 40. New York, NY, USA: Springer- Verlag, 2011
- G. Zhao, M. Pietikaeinen, “Dynamic texture recognition using local binary patterns with an application to facial expressions”, IEEE Transactions on Pattern Analysis and Machine Intelligence, Vol. 29, No. 6, 2007
- K. Srinivasa Reddy, V.Vijaya Kumar, B.Eshwarareddy, “Face Recognition based on Texture Features using Local Ternary Patterns”, I.J. Image, Graphics and Signal Processing (IJIGSP), Vol.10, 2015, pp: 37-46, ISSN: 2074-9082.
- K.Srinivasa Reddy, V. Venkata Krishna, V.Vijaya Kumar, “A Method for Facial Recognition Based On Local Features“, International Journal of Mathematics and Computation, Vol. 27, Iss. 3, 2016, pp: 98-109, ISSN 0974--570X
- M. Srinivasa rao, V.Vijaya Kumar, MHM Krishna Prasad, texture classification based on statistical properties of local units, Journal of Theoretical and Applied Information Technology, 30th November 2016. Vol.93. No.2
- http://www.ux.uis.no/tranden/brodatz.htmlS.
- http://www.outex.oulu.fi/index.php?page=image_databaseS.
- Svetlana Lazebnik, CordeliaSchmid and Jean Ponce. A Sparse Texture Representation Using Local Affine regions. IEEE Transactions on Pattern Analysis and Machine Intellignece, Vol.27, No.8, pp:1265-1278, August, 2005.
- R. L. Kashyap and A. Khotanzad, 1986, “A model-based method for rotation invariant texture classification,” IEEE Trans. Pattern Anal. Mach. Intell., vol. 8, no. 4, pp. 472–481
- Z. Guo, L. Zhang, and D. Zhang, “A completed modeling of local binary pattern operator for texture classification,” IEEE Trans. Image Process., vol. 9, no. 16, pp. 1657–1663, Jun. 2010
