Classifying IoT Device’s Traffic Traces Using Network Traffic Characteristics

Author: Rajarshi Roy Chowdhury, Debashish Roy, Emeroylariffion Abas
Journal: International Journal of Information Engineering and Electronic Business @ijieeb
Article in issue: 3 vol.17, 2025.
Free access
The escalating proliferation of devices, including both Internet of Things (IoT) and non-IoT devices, has triggered a suite of emergent security challenges in cyberspace, such as accurate device identification and authentication. The wide array of device types, protocols, and usability exacerbates these challenges. While conventional addressing schemes such as the logical Internet Protocol addressing and physical Media Access Control addressing schemes are integral for communication, they are susceptible to spoofing attacks. Device fingerprinting can be used to address the issue of identifying devices and traffic types using only implicit identifiers such as network traffic characteristics. In this paper, supervised machine learning based a device fingerprinting model has been proposed for the classification of both IoT and non-IoT devices on three levels based on their communication traffic characteristics. A meticulous feature selection process, employing two attribute evaluators, identified a subset of twenty features crucial for generating unique fingerprints from a large set of features pool. Three publicly available datasets and two supervised classifiers were utilized for evaluation purposes. Experimental results illustrated that the proposed model attained a classification accuracy exceeding 99% in discerning between known and unknown traffic traces (Level-1) on both the UNSW IoT and D-Link IoT datasets using the Random Forest (RF) classifier, and 99.74% accuracy in classifying network traffic types (Level-2) on the UNSW dataset. Individual device identification (Level-3) proves equally robust, with the RF and J48 classifiers achieving 99.03% and 98.14% accuracies on the UNSW non-IoT and IoT datasets, respectively. These findings underscore the potential of the device fingerprinting model in enhancing network security. The model’s robust classification capabilities across various datasets and identification levels make it a valuable asset in tackling modern security challenges in networked environments.
Internet of Things, Device Classification, Machine Learning, Network Traffic Traces, Traffic Features Analysis
Short address: https://sciup.org/15019743
IDR: 15019743 | DOI: 10.5815/ijieeb.2025.03.01
Text of the scientific article Classifying IoT Device’s Traffic Traces Using Network Traffic Characteristics
Published Online on June 8, 2025 by MECS Press
The Internet of Things (IoT) represents a significant technological evolution following the advent of the Internet. Originating in the 1960s with the Advanced Research Projects Agency Network (ARPANET), the structure of the Internet underwent refinement through the National Science Foundation Network (NSFNET) in the 1980s [1]. Since then, technological advancements have led to the rapid growth of the Internet, culminating in the emergence of IoT. Introduced by the Auto-ID center in 1999, the concept of IoT envisioned the identification of individual physical objects in the real world through the use of a globally unique identifier, facilitated by Radio Frequency Identification (RFID) [2]. The primary objective of IoT is to bridge the physical and digital worlds, offering various services over the network [2]. The proliferation of heterogeneous IoT devices with different functionalities have given rise to new privacy and security challenges in cyberspace, including the need for accurate device identification [3, 4, 5], authentication [6, 7, 8, 9, 10], location tracking [8, 9, 10], and anomaly detection [11, 12, 13]. IoT devices, such as temperature sensors, door sensors, IP cameras, and smoke detectors, are constrained by limited memory, storage, processing power, and energy [14, 15, 16]. In contrast, general-purpose computing devices like laptops, tablets, and desktops are more powerful and capable of performing a wider range of functions; these are known as non-IoT devices [15].
Conventionally, network-connected devices are identified using Internet Protocol (IP) or Media Access Control (MAC) addresses, serving as unique identifiers essential for network communication. However, these addressing schemes have been demonstrated to be susceptible to straightforward manipulation through the application of networking knowledge and wide-available software, including MAC address randomization, IP address and MAC address spoofing attacks [17]. Therefore, identifying network-connected devices accurately can be challenging when relying on explicit identifiers like IP and MAC addresses. However, precise device identification is crucial for enhancing network security. Conversely, Device Fingerprinting (DFP) [17], a process of identifying both IoT (smartplug, IP Camera, and door sensor) [6], and non-IoT (Laptop, Computer, and Tablet) [18, 19] devices solely based on their communication traffic characteristics, is more robust to manipulation. The communication traffic characteristics used include network packets [6, 18, 20], radio signal [21], and MAC frame [3, 22], forming the basis for generating unique identifier for device identification purposes. DFP can be classified into two categories based on network traffic capturing processes: active fingerprinting and passive fingerprinting. Notably, DFP has demonstrated significant efficacy in enhancing network security, largely attributed to its strong resilience against vulnerabilities such as node forging and masquerading attacks.
Individual Device Traffic Traces
Known and Unknown Traffic Traces

loT and Non-IoT Traffic Traces
Fig. 1. Traffic traces classification levels.
An efficient DFP model based on Machine Learning (ML) has been proposed in this study, utilizing only network packet information, which has been captured passively for subsequent analysis. Network traffic traces (packets) can be captured using only low-cost hardware and software resources [34]. The proposed DFP model was designed to categorize network traffic traces on three levels, as illustrated in Figure 1. These levels encompass differentiation of known and unknown traffic traces (Level-1: known traffic traces refer to network traffic patterns or data that are well-understood and easily identifiable, whereas unknown traffic traces are those that are unfamiliar and not yet recognized), IoT and non-IoT devices traffic traces (Level-2), and individual device traffic traces (Level-3). A total of 82 packet header features are extracted from the IP network layer protocol, and both the Transmission Control Protocol (TCP) and User Datagram Protocol (UDP) transport layer protocols. Two attribute evaluators were utilized to assess these features, with the top 20 ranked features selected as unique fingerprints. Subsequently, the proposed DFP model was evaluated on three publicly available datasets. Random Forest (RF) and J48 classifiers were employed for training and testing the model performances. Overall, the RF classifier demonstrated high classification performances, achieving 99.58% and 99.74% accuracies on the UNSW dataset for differentiating between known and unknown traffic traces (Level-1), and IoT and non-IoT devices traffic traces (Level-2), respectively. On Level-3 classification, the model attained over 99% and 97% accuracies in identifying individual devices network traffic traces of the individual devices on the non-IoT (UNSW) and IoT (UNSW) datasets, respectively. These findings highlight the significant potential of the DFP model to improve network security by offering precise and reliable device identification. The model’s strong classification abilities across diverse datasets and identification scenarios underscore its value in addressing contemporary security challenges within smart home networked environments. All of these experiments were conducted using smart-home datasets. By leveraging its robust performance in different contexts, the proposed DFP model emerges as a crucial tool for enhancing security measures and safeguarding networks against emerging threats. Network administrators and cybersecurity professionals will benefit from this research through advanced tools that offer more accurate device identification and enhanced security measures. Moreover, organizations that implement smart-home technologies will experience improved protection against potential security threats.
While the proposed DFP model exhibited robustness in handling the three levels of classification tasks, it requires retraining upon enhance of a new device into the network. Importantly the study did not encompass tasks related to anomaly detection or the classification of malicious network traffic. The main contributions of this study are:
■ Proposing a supervised ML-based DFP model that is not only able of differentiating between unknown and known network traffic traces but also distinguishing between traffic traces of non-IoT and IoT devices as well as classifying traffic traces of individual devices.
■ Investigating individual network traffic features from the network and transport layers using two attribute evaluators: Info Gain and Gain Ratio, to identify a suitable subset of the top twenty features based on their significance for identifying network traffic traces.
■ Evaluating the classification performance of the DFP model on three public datasets: the UNSW, IoT Sentinel, and D-Link IoT datasets, with the selected top twenty features.
2. Related Work
The remainder of this paper is organized as follows: related works and existing DFP schemes are described in Section 2. Section 3 presents the proposed ML-based DFP model, datasets, and feature analysis process. Experimental outcomes from various datasets are provided and discussed in Section 4, and finally, Section 5 concludes the paper with the future direction of work.
Researchers [6, 18, 23, 24, 31] have proposed various device fingerprinting models using ML or Deep Learning (DL) approaches by analyzing characteristics of network traffic. These models aim to classify IoT devices and distinguish between two different traffic types: IoT and non-IoT traffic. Unique fingerprints, serving as implicit identifiers, can be generated from different types of communication traffic, including network packets [18, 24, 25, 31], MAC frames [22, 26], and radio signals [27, 28, 29]. Many researchers have proposed DFP models that exclusively rely on network packet features due to their simplicity in capturing traffic traces compared to the use of radio signals. Table 1 provides a brief summary of the existing DFP models.
Miettinien et al. [6] proposed an automated DFP framework for identifying IoT devices by scrutinizing network traffic traces observed passively. Distinct device fingerprints were created by extracting 276-dimensional feature vectors from 12 consecutive network packets, encompassing information from the link, network, transport, and application layers protocols. These feature vectors were subsequently used to train individual ML models for each device type, enabling unique IoT device classification. The model attained an accuracy of 81.5% when considering the global ratio over a set of 27 smart IoT devices. Conversely, Aksoy and Gunes [25] proposed a DFP model, relying solely on a single TCP/IP packet header information for generating unique fingerprints. From a single packet, a total of 212 features were extracted, consisting of different layers protocols, including the network, transport, and application layers. The model attained an accuracy exceeding 82% on the IoT Sentinel dataset comprising 23 IoT devices.
Chowdhury et al. [24] introduced a DFP model by analyzing network traffic, with feature sets extracted from a single TCP/IP packet. The authors utilized different character-level metrics evaluators, including variability, stability, and suitability, for generating unique fingerprints, with the evaluation process involving the assessment a total of 218 features derived from packet header. Through the use of the UNSW and IoT Sentinel datasets, suitable subsets of 161 and 86 features, respectively, were identified. The model demonstrated commendable performances, achieving 83% accuracy on the IoT Sentinel dataset comprising 27 IoT devices and 97.78% accuracy on the UNSW dataset comprising 19 smart home IoT devices. Notably, the authors observed a decline in experimental performance when dealing with similar types of devices from the same manufacturers. The same researchers subsequently proposed an efficient DFP model by combining packet-level (20 features) and frame-level (4 features) features to improve classification performances [3]. The J48 classifier achieved an impressive accuracy of 99% on the D-Link IoT dataset, comprising 8 D-Link IoT devices.
Sivanathan et al. [19] introduced a supervised machine learning-based DFP model to classify IoT and non-IoT devices based on their communication traffic characteristics. From network packet flows ( n number of packets) observed over a one-day period, 11 statistical features were derived, with the 11 features used to train and assess the model’s performance. Their proposed DFP model achieved an accuracy exceeding 95% on the UNSW dataset, encompassing 21 smart-home IoT devices. Subsequently, the researchers enhanced the DFP model, utilizing only 8 statistical features derived from hourly traffic trace data [18]. This improved model attained over 99% accuracy on the UNSW dataset, which included 28 IoT devices. Hamad et al. [30] proposed a DFP model by analyzing a sequence of 20 to 21 for generating unique fingerprints. A comprehensive set of 67 statistical features, including packet size, header size, Inter Arrival Time (IAT), and TCP payload size, derived from both packet header and payload information, was utilized. The model exhibited notably high classification performance of the model was notably high, particularly when employing the random forest classifier with 100 estimators (decision trees), outperforming other machine learning classifiers. The DFP model demonstrated accuracy exceeding 90% when evaluated on the IoT Sentinel dataset containing 27 IoT devices [6].
Aneja et al. [32] proposed a DL based DFP model by utilizing 100 consecutive packets’ IAT values, represented as plotting graphs, for generating fingerprints. These fingerprints were then used to train a Convolution Neural Network (CNN) model. The model demonstrated an accuracy of 86.7% on a private dataset with 2 devices. Another DFP model utilizing unique fingerprints in the form of a graph, generated by utilizing 1,000 consecutive network packets’ IAT values has also been proposed [31]. The proposed model achieved an accuracy exceeding 97% on the GTID dataset comprising 58 devices [33]. The ResNet-50 architecture demonstrated superior classification performances when contrasted with the CNN-5L architecture, although the ResNet-50 CNN architecture required longer training and testing times.
Table 1. Existing ML/DL-based DFP approaches.
|
Source |
Problem |
No of Packets |
Fingerprints |
ML/DL |
Dataset/Devices |
|
[6] |
Device Classification |
12 |
Vector |
ML-RF |
IoT Sentinel27Devices |
|
[18] |
1 |
ML-PART |
IoT Sentinel23Devices |
||
|
[24] |
1 |
ML-J48 |
IoT Sentinel27Devices UNSW 19Devices |
||
|
[3] |
1 |
D-Link IoT8Devices |
|||
|
[18] |
Packets/Hour |
ML-RF |
UNSW 28Devices |
||
|
[19] |
Packets/Day |
UNSW 21Devices |
|||
|
[30] |
20-21 |
IoT Sentinel27Devices |
|||
|
[31] |
1000 |
Graph |
DL-CNN |
58Devices |
|
|
[32] |
100 |
Private 2Devices |
|||
|
[4] |
100 |
UNSW 21Devices |
Various device fingerprint models have been designed using either traditional ML algorithms [6, 24, 25] or DL algorithms [31, 32] for the different classification task, as summarized in Table 1. In these approaches, fingerprints were generated either using a large set network packets information or a single packet’s information, leading to significant variations in classification performance. Some researchers have incorporated packet payload information in fingerprint generation, raising concerns about potential data privacy threats [30]. Consequently, a thorough analysis becomes essential to select an optimal subset of features from a vast pool of available features using a minimal number of network packets. In this study, network packets features have been analyzed deeply for generating distinctive fingerprints, aiming to enhance classification performance and streamline complexity. Network packet features have been focused on, due to the availability of network packets in both Local Area Network (LAN) and Wide Area Network (WAN), and the simplicity of capturing network traffic traces using affordable hardware devices [6, 34, 35].
3. Proposed Methodology 3.1. Network Traffic Traces
To assess the classification capabilities of the proposed device fingerprinting model, three publicly available datasets: UNSW [18], IoT Sentinel [6], and D-Link IoT [34] datasets, have been employed in this paper. Brief descriptions of these datasets are presented in Table 2.
Table 2. Publicly available datasets of both IoT and non-IoT devices.
|
Dataset |
IoT |
Non-IoT |
Instances/Packets |
Year |
Source |
|
IoT Sentinel |
31 |
- |
102,347 |
2017 |
[6] |
|
UNSW (U-IoT) |
21 |
- |
1,276,657 |
[18] |
|
|
UNSW (U-Non-IoT) |
- |
7 |
277,835 |
||
|
D-Link IoT |
12 |
- |
333,864 |
2020 |
[34] |
The UNSW (U-IoT), IoT Sentinel, and D-Link IoT datasets consist of communication traffic data 21, 31, and 12 different types of smart home IoT devices, including cameras, smart plugs, door sensors, printers, and home hubs IoT devices, respectively. On the other hand, the UNSW (U-Non-IoT) dataset consists of communication traffic data of only seven non-IoT devices, including laptops, tablets, and smartphones non-IoT devices, traffic traces. Miettinen et al. [6] recorded only set up communication traffic traces to obtain the IoT Sentinel dataset, whilst only normal/benign communication traffic traces over an extended period from IoT devices were recorded to obtain the D-Link IoT dataset [34]. Conversely, normal/benign communication traffic traces from both non-IoT and IoT devices were recorded to obtain the UNSW [18] dataset.
-
3.2. Machine Learning Algorithms
-
3.3. Proposed DFP Model
In this study, two traditional ML classifiers: J48 and Random Forest (RF), were utilized to assess the proposed DFP model on different datasets. These tree-based classifiers are chosen due to their simplicity and resource efficiency, whilst DL algorithms, including CNN and Long Short-Term Memory (LSTM) networks, require large datasets (for training) and high computing resources. Drawing insights from existing research works in the literature [6, 18, 24, 25, 37], it has been observed that tree-based ML algorithms consistently achieve higher classification accuracy compared to rule-based and Bayesian theorem-based algorithms.
J48 (C4.5): The J48 classifier, which is based on the C4.5 classifier within the Weka tool, represents an enhanced iteration of the Iterative Dichotomiser 3 (ID3) algorithm [38, 39]. A decision tree resembling a tree structure for classification is produced by the classifier, where leaves and branches represent classification rules (or decision rules) and features, respectively [40]. Decision rules formulated based on if-then conditions to classify input data from a given dataset. The J48 classifier employs concepts from information theory, such as entropy, and utilizes tree pruning techniques to construct a decision tree for solving classification tasks. Each attribute or feature with high information gain is selected in this process [41]. Known for its simplicity, the J48 classifier has found applications in various domains. In reference [42], the J48 algorithm was ranked 1st among the top 10 ML algorithms, and consequently, it has been utilized in data mining for diverse objectives, including malicious traffic identification [11, 43], IoT device classification [24, 25], and medical science [44]. Additionally, the algorithm also allows the investigation of a significant subset of features for classification tasks.
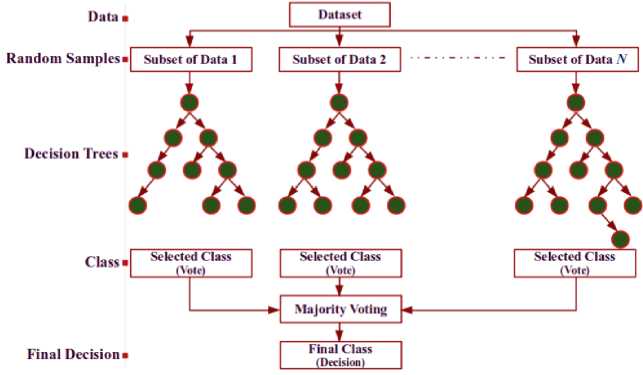
Fig. 2. Example of the Random Forest.
Random Forest (RF): RF is a classifier consisting of k number of decision tree-based classifiers ( x, θ n ), n = 1, 2, 3...k. Each tree has a random vector ( θ n ), and the input x is comprised of independent and identically distributed samples [45]. RF enhances classification accuracy by aggregating decisions from each tree, as presented in Figure 2. A voting mechanism is then used to predict the most popular class from the input data. The classifier incorporates bagging and boosting, contributing to improved accuracy. Bagging assists by using the random features selection process and estimating the generalization error, strength, and correlation of the ensemble of trees. RF stands out for its high execution speed and ability in reducing overfitting, making it an attractive choice for classification problems [46, 47]. Researchers have successfully utilized the classifier across diverse classification tasks, including device classification [18, 48, 49], anomaly detection [50], traffic classification [5, 51], disease classification [52], as well as IoT device identification [53, 54].
The outlined architecture for DFP is depicted in Figure 3. Both inbound and outbound network traffic traces originating from network-connected IoT and non-IoT devices, were captured on an Access Point (AP) for generating unique fingerprints. From existing works [5, 6, 18, 24, 25] it has been observed that device-originated communication traffic traces carry significant characteristics that can be used to classify devices as well as identify network traffic types. In this study, traffic traces originating from devices were filtered according to their individual device MAC addresses. Subsequently, they were stored in the Packet Capture (PCAP) file format for further processing.
TShark was utilized to extract a set of 82 features (or attributes), including tcp.window_size , ip.proto , ip.len , udp.srcport , and tcp.dstport , from each packet of different protocols: TCP, UDP, and IP, whilst each feature value consists of either numerical, null (or missing) or nominal (categorical data without any ordering or ranking) values. Subsequently, all the null or missing values were replaced with zero for ease of computation process. This information was then stored in a comma-separated values file format, to facilitate the analysis of network traffic characteristics. Individual packet information was annotated with labels corresponding to the 3 levels of identification: Level-1 for differentiating between known and unknown traffic types, Level-2 for differentiating between IoT and non-IoT traffic types, and Level-3 for differentiating traffic from individual devices. Subsequently, individual features were evaluated using two attribute evaluators: Gain Ratio (GR) and Info Gain (IG), to determine their significance. An average value was computed for each feature and these values were subsequently sorted in descending order to identify the top 20 features, which were made to serve as unique device fingerprints. Table 3 presents some of the significant features with GR, IG, and average values.
Network Traffic Traces
i—► Train ML Model
I D loT Devices - IP Camera, Smart- Plug □ NonToT Devices - Laptop, Smart-Phone
Filter Traffic Traces —► Feature Analysis
-
□ Device Originated Traffic Traces I П Gain Ratio
-
□ Remove Insignificant Traffic Traces X О Info Gain
---------------------► Fingerprints
□ J4S
П Random Forest
* Trained Model
I
Classification
-
□ TCP/UDP Features ^ Traffic Types: Known and Unknown
D IP Features ^ Traffic Types: loT and Non-IoT
-
□ Individual Device
-
3.4. Evaluation Metrics
Fig. 3. The proposed device fingerprinting model.
Table 3. List of features with different attributes values.
|
Attributes/Features |
GR |
IG |
Average |
Sorted |
|
ip.len |
0.32214838 |
1.74606264 |
1.03410551 |
1 |
|
tcp.srcport |
0.24463659 |
1.81798418 |
1.031310385 |
2 |
|
tcp.window_size |
0.27744747 |
1.13436262 |
0.705905045 |
3 |
|
- |
- |
- |
- |
- |
|
- |
- |
- |
- |
- |
|
tcp.dstport |
0.19025628 |
0.95853087 |
0.574393575 |
8 |
|
udp.checksum.status |
0.05968236 |
0.00488872 |
0.03228554 |
24 |
|
- |
- |
- |
- |
- |
|
tcp.checksum.status |
0 |
0 |
0 |
39 |
|
tcp.analysis.acks frame |
0 |
0 |
0 |
40 |
These fingerprints, representing the top 20 features, were then utilized for training a supervised ML model for the classification task, utilizing the labelled datasets during the training phase. The ML model underwent testing, with three levels of classification tasks performed to evaluate its performance: (1) classifications of traffic instances into one of two classes: known or unknown traffic traces (Level-1), (2) identification of network traffic instances into one of two classes: non-IoT or IoT traffic traces (Level-2), and (3) classifications of distinct devices traffic traces (Level-3).
The general objective of the different performance evaluation metrics is to assess the proposed DFP model classification performances on a test or unseen dataset. Two performance metrics were taken into account: accuracy and recall.
=
TP+TN
TP+TN+FP+FN
TP
TP+FN
These metrics were utilized to measure the effectiveness of the proposed DFP model employing various ML algorithms. The assessment metrics are computed through Equation 1 and Equation 2, respectively, where True Negative ( TN ) and True Positive ( TP ) represent the total count of correctly classified negative and positive instances (packets or traffic traces), respectively. Conversely, False Negative ( FN ) and False Positive ( FP ) indicate the total number of instances incorrectly classified as negative and positive, respectively.
4. Results and Discussion 4.1. Hardware and Software Details
The proposed ML-based DFP model, designed for the classification of devices (both IoT and non-IoT devices) and network traffic traces, was evaluated on a Windows-based system. This evaluation was conducted using the benchmark open-source Java-based data mining software, Waikato Environment for Knowledge Analysis (WEKA) [39]. WEKA, a cutting-edge state-of-the-art software, is versatile and applicable for various tasks, including data pre-processing, classification, regression, clustering, and visualization tasks. A laptop was equipped with the WEKA software, operating within the Windows Operating System (OS) environment.
-
4.2. Known and Unknown Traffic Types Classification
The effectiveness of the proposed device fingerprinting model was assessed in distinguishing between known and unknown traffic instances. This evaluation utilized two well established supervised ML classifiers: J48 and RF, and was conducted on two public datasets: the D-Link IoT and UNSW (U-IoT). Figure 4 depicts the Confusion Matrix (CM) representing the classification performance of the proposed model in differentiating between known and unknown traffic from the D-Link IoT and UNSW IoT datasets, referred to as Level-1. The model exhibited high classification accuracy with both the J48 and RF classifiers. Specifically, the J48 achieved a maximum accuracy of 99.60% on the UNSW IoT dataset, whereas the RF classifier achieved its highest accuracy of 99.94% on the D-Link IoT dataset.
Predicted Class/Label
|
Known Unknown |
||
|
2 1 Known |
70658 298 |
99.58% |
|
92.24% 0.39% |
0.42% |
|
|
□ Unknown 1 |
10 5633 |
99.82% |
|
0.01% 7.35% |
0.18% |
|
|
< |
99.99% 94.98% |
99.60% |
|
0.01% || 5.02% |
0.40% |
|
|
(a) |
UNSW loT dataset (J48) Predicted Class/Label Known Unknown |
|
|
■д Known - 5 |
60611 43 99.93% |
|
|
90.77% 0.06% 1 |
0.07% |
|
|
Q Unknown j |
40 6079 |
99.35% |
|
0.06% 9.10% | |
0.65% |
|
|
99.93% |ИЬ30%и1 |
99.88% |
|
|
■4 |
0.07% 0.70% |
0.12% |
(c) D-Link loT dataset (J48)
|
Predicted Class/Label Known Unknown |
||
|
"я Known 7 |
70655 301 |
99.58% |
|
92.24% 0.39% |
0.42% |
|
|
я q Unknown- |
17 5626 |
99.70% |
|
0.02% 7.34% |
0.30% |
|
|
99.98% 94.92% |
99.58% |
|
|
0.02% | 5.08% |
0.42% |
|
|
(b) UNSW loT dataset (RF) Predicted Class/Label Known Unknown |
||
|
■§ Known -- |
60654 0 |
100% |
|
90.84% 0.00% |
0.00% |
|
|
у Unknown- |
40 6079 |
99.35% |
|
0.06% 9.10% |
0.65% |
|
|
99.93%ll 100% |
99.94% |
|
|
0.07% 0.00% |
0.06% |
|
(d) D-Link loT dataset (RF)
Fig. 4. Confusion Matrices of the proposed device fingerprinting (DFP) model in differentiating between Unknown and Known traffic traces: (a) UNSW IoT dataset (J48), (b) UNSW IoT dataset (RF), (c) D-Link IoT dataset (J48), and (d) D-Link IoT dataset (RF).
О
Predicted Cliss/Labd
Non-IoT loT
Non-IoT loT
|
55064 51.64% |
292 |
99.47% |
|
0.27% |
0.53% |
|
|
61 |
51216 |
99.88% |
|
0.06% |
48.03% |
0.12% |
|
99.89% |
99.43% |
99.67% |
|
0.11% |
0.57% |
0.33% |
(a) UNSW dataset (J48)
Predicted Class/Label loT
Non-IoT
Non-IoT loT
|
55168 |
188 |
99.66% |
|
51.74% |
0.18% |
0.34% |
|
86 |
51191 |
99.83% |
|
0.08% |
48.01% |
0.17% |
|
99.54% |
| 99.63% |
99.74% |
|
0.16% |
0.37% |
0.26% |
(b) UNSW dataset (RF)
■
c
Predicted Class/Label
Non-IoT loT
■= Non-IoT loT
|
55230 72.64% |
158 |
99.71% |
|
0.21% |
| 0.29% |
|
|
88 |
20560 |
99.57% |
|
0.12% |
27.04% |
| 0.43% |
|
99.84% |
99.24% |
99.68% |
|
0.16% |
0.76% |
0.32% |
(c) loT Sentinel and U-Non-IoT datasets (J48) Predicted Class/Label
Non-IoT
loT
Predicted Class/Label
Non-IoT loT
Non-IoT loT
|
55264 |
124 |
99.78% |
|
72.68% |
0.16% |
0.22% |
|
85 |
20563 |
99.59% |
|
0.11% |
27,04% |
0.41% |
|
99.85% |
99.40% |
99.73% |
|
0.15% |
0.60% |
0.27% |
«
Predicted Class/Label
Non-IoT loT
Non-IoT lo I
|
55703 |
53 |
99.90% |
|
55.81% |
0.05% |
0.10% |
|
49 |
44012 |
99.89% |
|
0.05% |
44.09% |
0.11% |
|
99.91% 0.09% |
99.88% 0.12% |
99.90% 0.10% |
я Non-IoT-
loT
55.82%
0.03%
99.93%
0.04% 0.07%
44.11% 0.07%
99.94% 99.91% 99.93%
0.06%
0.09%
0.07%
-
(d) loT Sentinel and U-Non-IoT datasets (RF)
-
(e) D-Link loT and U-Non-loT datasets (J48)
-
4.3. IoT and Non-IoT Devices Traffic Types Classification
(f) D-Link loT and U-Non-IoT datasets (RF)
Fig. 5. Confusion Matrices of the proposed DFP model for distinguishing between IoT and non-IoT devices traffic traces: (a) UNSW dataset (J48), (b) UNSW dataset (RF), (c) IoT Sentinel and U-Non-IoT datasets (J48), (d) IoT Sentinel and U-Non-IoT datasets (RF), (e) D-Link IoT and U Non-IoT datasets (J48), and (f) D-Link IoT and U-Non-IoT datasets (RF).
Comparing between the distinct classifiers on the D-Link IoT dataset, both the J48 and RF classifiers correctly identified 6,079 out of 6,119 unknown instances as known traffic instances. However, the RF classifier managed to correctly identify all known instances, with the J48 classifier failing to identify 43 of the 60,654 known instances. On the UNSW IoT dataset, the J48 classifier performed slightly better, correctly identifying 70,658 out of 70,956 known instances and 5,633 out of 5,643 unknown instances, as compared to the RF classifier. Overall, the proposed DFP model demonstrated generally higher classification accuracy using the RF classifier, as depicted in Figures 4(b) and 4(c).
In this study, three publicly accessible datasets: UNSW, IoT Sentinel, and D-Link IoT datasets, were utilized to assess the performance of the proposed DFP model in distinguishing between IoT and non-IoT traffic traces. The results, illustrated in Figure 5, indicate an impressive overall accuracy exceeding 99%. Notably, the RF classifier consistently outperforms the J48 classifier across all cases.
As shown in Figure 5(f) on the combined D-Link IoT and U-Non-IoT dataset, the RF classifier correctly identified 55,716 non-IoT instances and 44,028 IoT instances, while making only 40 false identifications of non-IoT as IoT and 33 false identifications of IoT as non-IoT. On the UNSW dataset, the RF classifier achieved the highest accuracy at 99.74% (binary classification), as depicted in Figure 5(b). In contrast, the J48 classifier exhibited a lower classification performance of 99.67%; falsely identifying 292 non-IoT traffic instances as IoT and 61 IoT traffic instances as non-IoT. These findings underscore the superior classification capabilities of the RF classifier in distinguishing between IoT and non-IoT instances across diverse datasets.
-
4.4. Individual Device Classification Performances
The proposed model was assessed across three separate datasets: IoT Sentinel, and UNSW (both U-IoT and U-nonIoT), to evaluate its performance in classifying individual devices (IoT and non-IoT). Experimental findings demonstrate that the model consistently achieved higher accuracy using all the datasets, as presented in Figure 6. Specifically, the J48 classifier demonstrated accuracies of 91.55% and 98.14% using the IoT Sentinel and UNSW IoT datasets, respectively, whilst its performance exhibited a slight decline of 2.42% and 0.16% when utilizing the same datasets with the RF classifier.
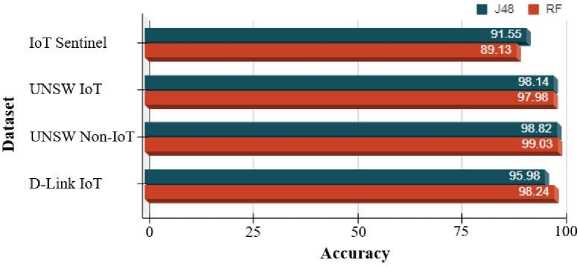
Fig. 6. Accuracy of the proposed model across varied datasets.
Conversely, the RF classifier achieved 99.03% and 98.24% accuracies using the UNSW non-IoT and D-Link IoT dataset, respectively, marginally surpassing the J48 classification performances. The classification performances on the IoT Sentinel and D-Link IoT datasets exhibited significant variation, despite the similarity in the characteristics of both datasets. This could be attributed to the similarity of these datasets, which include comparable types of IoT devices from the same manufacturer.
|
AndroidPhone! |
IPhone |
Laptop |
Predicted OassZLabel SamsungTab AndroidPhone |
MacBook |
MacBook-IPhone |
|||
|
AndroidPhone_2 - IPhone ■ |
1474 |
0 |
0 |
281 |
8 |
2 |
4 |
83.324 |
|
__2.650% 0 |
0.000% 125 |
0.000% 4 |
0.503% 0 |
0.014% 0 |
0.004% 12 |
0.007% |
16.68% 87.41% |
|
|
0.000% |
0.225% |
0,007% |
0.000% |
0.000% |
0026% |
0 004% |
1112.59% |
|
|
Laptop ■ |
0 |
0 |
17889 |
0 |
0 |
0 |
0 |
100% |
|
0.000% |
0.000% |
32.194% |
0.000% |
0.000% |
0.000% |
0.000% |
0.00% |
|
|
£ SamsungTab- я AndroidPhone - |
43 |
0 |
0 |
25533 |
9 |
6 |
4 |
99 76% |
|
0.077% 8 |
0.000% 0 |
0.000% 0 |
45.950% 102 |
0.016% 353 |
0.011% 1 |
0.007% 1 |
0.24% 75.91% |
|
|
s |
0.014% |
0.000% |
0.000% |
0.183% |
0.635% |
0.002% |
0.002% |
24 09% |
|
MacBook |
2 |
s |
3 |
4 |
0 |
7733 |
2 |
99.75% |
|
0.006% |
0.014% |
0.005% |
0.007% |
0.000% |
13.917% |
0.004% |
0.25% |
|
|
MacBook-IPhone - |
4 |
1 |
0 |
18 |
0 |
8 |
1923 |
98 41% |
|
0.007% |
0.002% |
0.000% |
0.032% |
0.000% |
0.014% |
3.461% |
1.59% |
|
|
96.28% |
93.28% |
99 96% |
qr 44% |
95 41% |
99.63% |
99.33% |
99.03% |
|
|
3.72% |
[ 0.72% |
0.04% |
1.56% |
4.59% |
0.37% |
0.67% |
0.97% |
|
Fig. 7. Confusion Matrix of the proposed device fingerprinting model utilizing UNSW non-IoT dataset with the RF classifier.
From Figure 7 on the UNSW non-IoT dataset using RF classifier, it can be seen that a combined total of 537 traffic instances from the AndroidPhone_2, IPhone, SamsungTab, AndroidPhone, MacBook and MackBook-IPhone non-IoT devices were incorrectly classified as different devices. The model was able to correctly identify all of the 17,889 instances from the Laptop, despite incorrectly identifying 7 instances from other devices as coming from the Laptop. Notably, the Android devices, specifically AndroidPhone_2 and AndroidPhone, demonstrated lower classification performances compared to other devices. Overall, the RF classifier exhibited an accuracy of 99.03% on the UNSW non-IoT dataset, surpassing the J48 classifier’s performance by 0.21%.
Figures 8 and 9 depict the confusion matrix of the proposed DFP model for Level-3 classification task on the UNSW IoT and D-Link IoT datasets, respectively. In Figure 8, it is evident that out of 21 devices, four devices: LiFXSmartBulb, NESTalarm, SmartThings and WithingsSmartscale, attained 100% recall, with 12 devices attaining recall levels surpassing 98% on the UNSW IoT dataset. BelkinWemoSwitch exhibited the lowest classification performance, with a recall of 83.61%. Overall, the proposed model achieved accuracy exceeding 98% using the J48 classifier, whereas the RF classifier demonstrated a slightly lower performance at 97.98%.
В C D E F G H IJKLMNOPQRSTU
A. AmazonEcho
В. BelkinWemoSensor
C. BelkinWemoSwitch
-
D. BlipcareBPmeter
-
E. DropCam
-
F. BPprinter
G. iHome
EL InsteonCami
I. LiFXSmartBulb я ^ J. NEST alarm m K. NetatmoWeatherStation и
L. NetatmoWekome
V M.PIX STARPhoto frame
N. SamsungSmartCam
O. SmartThings
P. TP-LinkCam
Q. TP-LinkSmartPlug
R. TribySpeaker
S. WithingsSmartMonitor
T. WithingsSmartscale
U. WithingsSmartSensor
|
19135 7.63597. 3 |
0 0.00007 20711 |
0 O.O0O0Z 44 |
0 0.00007 0 |
0 o.oooox 0 |
0 0.00007 0 |
0 0.00007 0 |
1 0.0004X |
o 0.00007 0 |
0 o.oooox 0 |
1 0 5 0.0O04Z 0.0O0OZ 0.0020Z |
0 0.00007. 90 |
0 O.OOOOZ 0 |
1 0.0004Z 0 |
0 0.0000/. 0 |
0 O.OOOOZ 0 |
0 O.OOOOZ 0 |
o 0.0000/. 0 |
2 0.00087 0 |
91957. 0.057 13134z |
|
|
0 |
0 0 |
|||||||||||||||||||
|
0,0012/ 1 O.O0O4X 0 0.00007. |
8,26487 0.01767 2450 12923 0.37777 5.15947 0 0 0 00007 0 00007 |
0.00007 0 0.00007 10 0 00407 |
0.00007 0 O.OOOOX 0 0.00007 |
0.00007 0 o.oooox 0 0.00007 |
oooooz 0 O.OOOOX 0 OOOOOZ |
O.OOOOX 0 O.OOOOX 0 oooooz |
0.00007 0 0.00007 0 O.0O0OZ |
O.OOOOX 0 OOOOOZ 0 OOOOOX |
OOOOOZ OOOOOX 0.D0O4Z |
0.0O0OZ 0.00007 0.00047 0.0000Z 0 0 OOOOOZ 0.00007 |
0.0359Z 83 0.0331/. 0 O.OOOOZ |
O.OOOOZ 0 O.OOOOZ 0 O.OOOOZ |
O.OOOOZ 0 O.OOOOZ O.OOOOZ |
0.O0O0Z 0 0.0000/. 0 O.OOOOZ |
OOOOOZ 0 O.OOOOZ 0 oooooz |
O.OOOOZ 0 O.OOOOZ 0 oooooz |
O.OOOOZ 0 O.OOOOZ 0 O.OOOOZ |
0.00007 0 O.OOOOZ 0 0.00007 |
0.667 83.61Z 16 39Z 90.31Z 1037 |
|
|
2 |
1 |
0 |
0 |
64457 |
0 |
0 |
2 |
0 |
0 |
° o.oooox 0 |
16 0 |
1 |
0 |
3 |
0 |
0 |
0 |
0 |
3 |
89.36/. |
|
O.O0O8X 0.00047 0 0 |
0.00007 2 |
0.00007 0 |
25.71337 3 |
0.00007 1333 |
0.00007 0 |
0.O0O8Z 0 |
0.00007 0 |
o.oooox 0 |
0.00647 O.OOOOX 0 0 |
0.00047 0 |
O.OOOOZ 0 |
O.O012Z 46 |
O.OOOOZ 0 |
O.OOOOZ 0 |
O.OOOOZ 1 |
O.OOOOZ 0 |
000127 •in |
0.047 39.557 |
||
|
0.0O0OX |
0.00007 0.00087 |
0.00007 |
0 0012Z |
0.53437 |
0.00007 |
0.0O0OZ |
0.O0O0X |
O OOOOZ o ooooz |
0.00007. 0.00007 |
0.00007 |
OOOOOZ |
0.0000/. |
O.OOOOZ. |
OOOOOZ |
0.O0O4Z |
O.OOOOZ |
O.OOOOZ |
0.457 |
||
|
0 |
0 |
0 |
0 |
0 |
0 |
1467 |
0 |
0 |
0 |
1 |
0 0 |
0 |
0 |
0 |
0 |
0 |
0 |
0 |
0 |
91937 |
|
0.0O0OX 0 0.00007 0 |
0.00007 0 0.00007 0 |
O.OOOOX 0 0.00007 0 |
0.00007 O.OOOOX OOOOOX 0 2 0 0.00007 0.00087 . 0.00007 ООО |
O.5854X O.OOOOX 0 28786 0.00007 11.48727 0 0 |
O.OOOOX o.oooox 2419 |
OOOOOx O.0O0OX |
0,0004/. o.oooox |
O.OOOOX O.OOOOX 0.00007 O.OOOOX O.OOOOX 0.0004X 0.1445/. O.OOOOX 0 0 0 0 |
O.OOOOX 0 O.OOOOZ 0 |
0.0000/. 0 O.OOOOZ. 0 |
O.OOOOX 0 0.00007 0 |
O.OOOOZ 22 0.0O88Z 0 |
0.0000/. 0 O.OOOOZ 0 |
O.OOOOZ 0 0.00007 0 |
o.orz 9167X 1.337 1007 |
|||||
|
0.00007. |
0.00007 |
OOOOOZ |
o.oooox |
O.OOOOX |
0.00007 |
oooooz |
O.OOOOX |
0.96537 |
OOOOOZ |
OOOOOZ |
O.OOOOX O.OOOOZ |
O.OOOOZ |
O.OOOOZ |
O.OOOOZ |
O.OOOOZ |
O.OOOOZ |
O.OOOOZ |
0.00O0Z |
0.O0O0Z |
0.007 |
|
0 |
0 |
0 |
0 |
0 |
0 |
0 |
0 |
0 |
60 |
4 |
0 0 |
0 |
0 |
П |
0 |
0 |
0 |
0 |
0 |
93.75/. |
|
0.00007 |
0.00007 |
0 00007 |
0.00007 |
0.00007 |
o.oooox |
0.00007 |
o.oooox |
O.OOOOX 0.0239Z |
0.00167 |
0.00007 0.0000Z |
O.OOOOZ |
O.OOOOZ |
0.0000Z |
O.OOOOZ |
O.OOOOZ |
O.OOOOZ |
O.OOOOZ |
O.OOOOZ |
6.257 |
|
|
0 |
0 |
0 |
0 |
0 |
0 |
0 |
0 |
0 |
0 |
2203 |
0 0 |
0 |
0 |
0 |
0 |
0 |
0 |
0 |
0 |
100z |
|
0.00007 |
0.00007 |
0.00007 |
0.00007 |
QWMZ |
0X10007 |
o.oooox |
o.oooox |
0.00007 O OOOOX |
0.87317 |
0.0O0OZ 0.0000X |
O.OOOOZ |
O.OOOOZ |
O.OOOOZ |
0.O0O0Z |
O.OOOOZ |
O.OOOOZ |
O.OOOOZ 0.00007 |
OX |
||
|
965 |
2 |
0 |
0 |
6 |
2 |
0 |
1 |
0 |
0 |
0 |
14242 9 |
2 |
0 |
23 |
0 |
0 |
0 |
0 |
9 |
33.327 |
|
0.38517 |
0 00087 0.00007 |
o.oooox |
0.0024X |
O.00O8X |
OOOOOX |
0.0O04X |
0.0O0OZ |
OOOOOZ |
oooooz |
5 68337 10036Z |
0.00087 |
O.OOOOZ |
0.0032Z |
O.OOOOZ |
O.OOOOZ |
O.OOOOZ |
O.OOOOZ |
0.0036Z В 6.687 |
||
|
0 0 |
0 |
0 |
0 |
0 |
0 |
2 |
0 |
0 |
0 |
2 1711 |
0 |
0 |
1 |
0 |
0 |
0 |
0 |
22 |
91457 |
|
|
o.oooox |
0 00007 |
oooooz |
o.oooox |
0.00007 |
O.OOOOX |
o.oooox |
0 0008/. |
0.00007 |
oooooz |
ojxmz |
0.0008/ 0.6828Z |
O.OOOOX |
O.OOOOZ |
0 0004Z |
O.OOOOZ |
O.OOOOZ |
O.OOOOZ |
oooooz |
0.00887 |
155Z |
|
2 |
0 |
0 |
0 |
0 |
0 |
0 |
4 |
0 |
0 |
2 |
0 0 |
24951 |
0 |
2 |
0 |
0 |
1 |
0 |
0 |
9196/. |
|
0.00087. |
0.00007 |
0.00007 |
0.00007 |
0.00007 |
0.00007 |
o.oooox |
0.00167 |
0.00007 |
o.oooox |
0.O0O8X |
O.OOOOZ O.OOOOX |
9.95687. |
O.OOOOZ |
0.0O08Z |
O.OOOOZ |
0.0000/. |
0.O0O4Z |
0.00007. |
O.OOOOZ |
0.047. |
|
0 |
0 |
0 |
0 |
0 |
0 |
0 |
0 |
0 |
0 |
0 |
0 0 |
0 |
7604 |
0 |
0 |
0 |
0 |
0 |
0 |
1ППх |
|
0.00007. 2 |
0 00007 3 |
OOOOOx 0 |
O.OOOOX 0 |
0.00007 0 |
0.00007 0 |
OOOOOX 0 |
o.oooox 58 |
0.00007 0 |
oooooz 0 |
OOOOOZ 0 |
0 00007 O OOOOX 4 4 |
O.OOOOZ 404 |
3 03447 № |
O.OOOOX 0.O0O0Z O OOOOX 23622 0 0 |
oooooz 0 |
O.OOOOZ 0 |
0.00007 7 |
OX 98.00Z |
||
|
0.00087 20 0.00807 |
0.00127 4 0.00167 |
0.00007 0 0.00007 |
O.OOOOX 0 o.oooox |
O.OOOOX 0 0.00007 |
oooooz 0 0.00007 |
O.OOOOX 0 o.oooox |
0.02317 13 0.O052Z |
O.OOOOX 0 0.00007 |
OOOOOZ 0 oooooz |
OOOOOZ 0 o.oooox |
0.0016/4 0.00167 0 0 O.OOOOZ O.OOOOZ |
0.1612Z НЙ1 O.OOOOZ |
O.OOOOZ O.OOOOZ |
3,4265/ o 0.0000Z |
O.OOOOZ 570 0.22757 |
O.OOOOZ O.OOOOZ |
O.OOOOZ 0 O.OOOOZ |
O.OOOOZ 0 0.00007 |
0.0028Z 1 2.007 12 92.087 0.00487 1 7.327 |
|
|
0 |
0 |
0 |
0 |
0 |
0 |
0 |
4 |
0 |
0 |
0 |
3 1 |
0 |
0 |
1 |
0 |
2491 |
0 |
0 |
0 |
89.64/ |
|
0.00007 0 0.00007 0 |
0 00007. 0 0.00007 0 |
OOOOOX 0 0 00007 0 |
o.oooox 0 O.OOOOX 0 |
0.0000X 0 0.00007 0 |
O.OOOOX 0 o.oooox 0 |
oooooz 0 OOOOOZ 0 |
0.00167 0 OOOOOZ 0 |
O.0O0OZ 0 O.OOOOX 0 |
oooooz 0 OOOOOZ 0 |
oooooz 0.O004Z 0 |
0.O012Z 0.0004Z 0 0 0 00007. 0.00O0Z 0 0 |
OOOOOZ O.OOOOZ 3 0 0.0012X O.OOOOZ 0 0 |
0.0004Z 0 O.OOOOZ 0 |
O.OOOOZ 0 O.OOOOZ 0 |
0 3340Z 0 oooooz. 0 |
O.OOOOZ 11947 47675Z № |
O.OOOOZ 0 o.ocooz 87 |
0.00007 0 O.OOOOZ 0 |
0.367 91977. 0.037 KJOz |
|
|
0.00007 |
O.OOOOX |
0.00007 |
O.OOOOX |
0.00007 |
OOOOOZ |
O.OOOOX |
0.00007 |
0.00007 |
OOOOOZ |
O.OOOOX |
OOOOOZ O.OOOOZ |
O.OOOOZ |
O.OOOOZ |
O.OOOOZ |
O.OOOOZ |
O.OOOOZ |
O.OOOOZ 0.0347/. O.OOOOZ |
0.007 |
||
|
0 |
0 |
0 |
0 |
1 |
0 |
0 |
0 |
0 |
0 |
5 |
16 0 |
1 |
0 |
4 |
0 |
0 |
9856 |
9171Z |
||
|
0.00007 95.067. |
0.00007 89.387 |
0.00007 99657 |
o.oooox |
™x |
o.oooox 99.857 |
o.oooox 1ШХ z |
O.OOOOX 99.717 |
o.oooox o.oooox |
0 00207 0 00647 O.OOOOX 0.O0O4Z 99.147 199.717 98 847 96.357 |
O.OOOOZ 1007 |
0.00167 O.OOOOZ 99.857 1007 |
0.00047 0.O0O4Z O.OOOOZ 3 33317 0.237 91967 191797 1007 91457 98.147 |
||||||||
|
I 4.947 |
Г 10.627 |
0.357 |
0.007 |
0.027 |
0.157 |
0.007 |
0.237 |
o.oox |
50Z |
0.867 |
0.237 I 1.16Z |
3.857 |
0.007 |
0.157 |
o.oox |
0.047 |
0.217 |
0.007 |
0.557 |
1.86Z |
Fig. 8. Confusion Matrix of the proposed device fingerprinting model using UNSW IoT dataset with the J48 classifier.
Predicted Class/Label
|
A |
В |
c |
D |
E |
F |
G |
H |
I |
J К |
L |
||
|
A. D LinkCarnl ai - |
7605 11389% |
531 0.795% |
0 0.000% |
0 0.000% |
0 0.000% |
0 0.000% |
0 0-000% |
0 0.000% |
10 0 015% |
0 0 0.000% 0.000% |
0 0.000% |
93.36% I | «64% |
|
B. D-LinkCam2_ll ■ |
405 0.607% |
18822 28.188% |
1 0.001% |
0 0.000% |
0 0.000% |
0 0.000% |
0 0.000% |
0 0.000% |
II 0.016% |
0 0 0.000% 0.000% |
0 0.000% |
97.83% 1 2.18% |
|
C. D-LinkDayCaml Sd - |
0 |
0 |
6079 |
30 |
0 |
9 |
0 |
1 |
0 |
0 0 |
0 |
99 35% |
|
0.000% |
0.000% |
9.104% |
0.045% |
0.000% |
0.013% |
0.000% |
0.001% |
0.000% |
0.000% 0.000% |
0.000% |
0.65% |
|
|
D. D-LinkDayCam2_93 - “ E. D LmkDavCamS Sf - - ' - и F. D-LinkDayCam4a6 ■ re ” |
0 0.000% 0 0.000% 0 0-000% |
0 0.000% 0 0.000% 0 0.000% |
0 0.000% 0 0.000% 0 0.000% |
5987 8.966% 0 0.000% 0 0 000% |
0 0.000% 6115 9.158% 0 0.000% |
13 0.019% 19 0.028% 5930 8.881% |
0 0.000% 0 0.000% 0 0.000% |
0 0.000% 1 0.001% 0 0.000% |
0 0.000% 0 0.000% 0 0.000% |
0 0 0.000% 0.000% 0 0 0.000% 0.000% 0 0 0.000% 0 000% |
0 0.000% 0 0.000% 0 0.000% |
[ 99.78%^ 0.22% 99.67% 0.33% 100% 0.00% |
|
G. D-LinkDayCam5_e5 - *= H. D-LinkDavCam6 SS ■ L D-LinkHomeHub - J. D-LiukSmartPlug_3b - K. D LinkSmartPlug 55 ■ L. D-LinkSmartPlug_6e |
0 |
0 |
0 |
0 |
0 |
8 |
6234 |
0 |
0 |
0 0 |
0 |
99 87% |
|
0.000% 0 |
0.000% 0 |
0 000% 0 |
0.000% 0 |
0.000% 0 |
0.012% 8 |
9 336% и ° |
0.000% 6067 |
0 000% 0 |
0.000% 0.000% 0 0 |
0.000% 0 |
0.13% 99.87% |
|
|
0.000% 0 0.000% 1 0.001% 1 0.001% 2 0.003% L 94.90% , |
0.000% 0 0.000% 0 0.000% 0 0.000% 0 0.000% 97.25% |
0.000% 0 0.000% 0 0.000% 0 0.000% 2 0.003% 99.55%. |
0.000% 0 0.000% 0 0.000% 0 0.000% 0 0.000% 99.50% |
0.000% 0.012% 0.000% 9.086% 0 0 0 0 0.000% 0.000% 0.000% 0.000% 0 0 0 0 0.000% 0.000% 0.000% 0.000% 0 0 0 0 0.000% 0.000% 0.000% 0.000% 0 0 0 0 0.000% 0.000% 0.000% 0.000% —00% НЁ%| —60% 699.97"» |
0.000% 1714 2.567% ° 0.000% 0 0.000% 0 0.000% 98.79% |
0.000% 0.000% 0 0 0.000% 0.000% 332 20 0.497% 0.030% 24 368 0.036% 0.551% 17 29 0.025% 0.043% 8 9.04^ 188 25% |
0.000% 2 0.003% 10 0.014% 20 0.030% 349 0.523% Bl-6fi%i |
0.13% 99 88% 0.12% ES33%1 8 54% i 89.10% [I 10.39% Г87.47%| 12.?.'% 98.24% |
||||
|
| 5.10% |
[ 2 74% |
0.05% |
0.50% |
0.00% |
0.95% |
0.00% |
0.03% |
| 1.21% |
10.99% [11.75% [ 8.40% |
| 4.02% |
||
Fig. 9. Confusion Matrix of the proposed DFP model using D-Link IoT dataset with the RF classifier.
The proposed DFP model was also evaluated on the D-Link IoT dataset, aiming to classify individual IoT devices. All devices within this dataset are sourced from a singular manufacturer (such as D-Link), encompassing four unique device types. As illustrated in Figure 9, the model demonstrated individual recall of over 91% in most cases, with the exception of traffic traces coming from the two D-Link Smart Plug devices (D-LinkSmartPlug_3b and D-LinkSmartPlug_55), which exhibited recall of 89.10% and 87.47%, respectively. Overall, the RF classifier attained 98.24% accuracy on the D-Link IoT dataset, while the J48 classifier achieved a slightly lower accuracy of 95.98% accuracy. Throughout the experiment, a total of 1,175 instances (541 + 417 + 40 + 13 + 20 + 0 + 8 + 8 + 2 + 31 + 45 + 50) from the various devices, including DLinkCam1_4, D-LinkCam1_11, D-LinkDayCam1_5d, D-LinkDayCam2_11, D-LinkDayCam3_8f, D-LinkDayCam4_a6, D-LinkDayCam5_e5, D-LinkDayCam6_88, D-LinkHomeHub, D-LinkSmartPlug_3b, D-LinkSmartPlug_55 and D-LinkSmartPlug_6e, were incorrectly classified as different types of IoT devices. Meanwhile, 65,602 instances accurately classified as the correct types of device instances. Notably, instances from the D-LinkDayCam4_a6 devices achieved a perfect 100% classification accuracy, whilst the lowest performance at 87.47% recall, was observed for instances from the LinkSmartPlug_6e IoT device. The proposed device fingerprinting model demonstrated a 91.55% accuracy on the IoT Sentinel dataset, when employing the J48 classifier. Conversely, the RF classifier achieved a slightly lower accuracy of 89.13%. Notably, overall performances witnessed a decline, attributed to the presence of similar types of devices within the dataset.
Table 4 provides a comparative summary of various DFP approaches available in the literature, against the proposed DFP method for classifying network traffic instances. An 81.5% accuracy in identifying IoT devices was reported in reference [6], with a substantial number of features used for generating a unique fingerprint.
Table 4. Contrasting the proposed DFP scheme with existing DFP approaches.
|
Source |
Problem |
Dataset |
Devices |
Packet(s) |
Feature |
Algorithm |
Performance |
|
[6] |
Device Classification |
IoT Sentinel |
27 |
12 |
23 |
RF |
81.5% |
|
[25] |
IoT Sentinel |
23 |
1 |
212 |
PART |
82% |
|
|
[24] |
IoT Sentinel UNSW |
27 19 |
1 |
161 86 |
J48 |
83.35% 97.78% |
|
|
[3] |
D-Link IoT |
8 |
1 + 1 MF. |
24 |
J48 |
99% |
|
|
[18] |
UNSW |
28 |
Packets/Hour |
8 |
RF |
99% |
|
|
[19] |
UNSW |
21 |
Packets/Day |
11 |
RF |
95% |
|
|
[30] |
IoT Sentinel |
27 |
20-21 |
67 |
RF |
90.3% |
|
|
[31] |
GTID |
58 |
1000 |
1 |
CNN |
97.5% |
|
|
[32] |
Private |
2 |
100 |
1 |
CNN |
86.7% |
|
|
[4] |
UNSW |
21 |
100 |
2 |
CNN |
98.49% |
|
|
* |
Device Cls a,b,c,d IoT vs non-IoT e Known vs Unknown f |
IoT Sentinel a UNSW c,e D-Link IoT b,e,f |
31 a c, U-IoT d,e,U-nIoT 12 b,e,f |
1 |
20 |
J48 a,c RF b,d,e,f |
91.55% a 98.24% b 98.14% c 99.03% d 99.93% e 99.94% f |
Note: Random Forest – RF, The proposed DFP model – *, IEEE 802.11 Mac Frame – MF, Classification - Cls, Convolutional Neural Networks – CNN.
Meanwhile, references [25] and [24] achieved accuracies of 82% and 83.35%, respectively, in classifying individual IoT devices within the IoT Sentinel dataset, by utilizing 212 [25] and 161 [24] features from a TCP/IP packet, respectively. In references [18] and [19], fingerprints were generated utilizing hourly and day-wise traffic analysis, respectively, using statistical features to identify individual devices. On the other hand, a network packet header, and a probe request frame (IEEE 82.11 MAC Frame) information were utilized in reference [3] for fingerprint generation, achieving 99% accuracy on the D-Link IoT dataset. In reference [30], the proposed DFP model utilized both packet header and payload information for fingerprint generation, despite data privacy threat from using payload information. References [31, 32] and [4], employed extensive packet information to generate fingerprints in the form of graphs for individual identification of network-connected devices, achieving accuracies of 97.5%, 86% and 98.49% on the GTID, private and UNSW IoT datasets, respectively. Comparatively, the proposed ML-based DFP model, which employs a meagre single packet header information, attained over 91%, 98.24%, 98.14% and 99.03% accuracy on the IoT Sentinel, D-Link IoT, UNSW IoT and UNSW non-IoT datasets, respectively.
5. Conclusion
The growing prevalence of diverse IoT devices with varying functionalities, combined with traditional non-IoT devices, has introduced complex security and privacy challenges. These issues include device classification, anomaly detection, and device management within IoT networks. Accurate device identification plays a crucial role in addressing and mitigating these challenges. This paper highlights the crucial importance of device identification and network traffic classification, based on inherent network traffic characteristics, to effectively address these challenges. The proposed DFP model offers three levels of classification tasks and employs state-of-the-art supervised ML classifiers, including RF and J48. The model was rigorously tested on three publicly available datasets: IoT Sentinel, D-Link IoT, and UNSW, which include both non-IoT and IoT datasets. Experimental results indicate that the proposed DFP model achieves an accuracy exceeding 99% in distinguishing between unknown and known traffic traces (Level-1) on both D-Link IoT and UNSW IoT datasets when utilizing the RF classifier. Additionally, it achieved an impressive 99.74% accuracy in classifying network traffic types (Level-2) on the UNSW dataset. For the identification of individual devices (Level-3), the RF and J48 classifiers demonstrated accuracies of 98.14% and 99.03%, respectively, on the UNSW IoT and UNSW non-IoT datasets. Notably, across the various experiments, the RF classifier consistently outperforms the J48 classifier, demonstrating higher overall accuracy. However, this study has some key limitations, including testing the model in a real-world deployment, handling a large dataset with different device types (both IoT and non-IoT) and retraining the model when a new device join the network.
Looking ahead, future research should delve into a more comprehensive analysis of network traffic features to further enhance classification performance across all three levels. Additionally, it is required to perform adversarial analysis for evaluating the model’s resilience against spoofing and evasion attacks. A detailed analysis of advanced DL approaches, including transformers, Generative Adversarial Networks (GANs), and LSTM architectures, is also necessary to evaluate classification performance in real-world scenario.
Acknowledgment
The authors are profoundly grateful to the Department of Computer Science, American International University-Bangladesh, Bangladesh and the Faculty of Integrated Technologies, Universiti Brunei Darussalam, Brunei for supporting this research work.
