Clustering Russian Federation regions according to the level of socio-economic development with the use of machine learning methods

Author: Ketova Karolina V., Kasatkina Ekaterina V., Vavilova Diana D.
Journal: Economic and Social Changes: Facts, Trends, Forecast @volnc-esc-en
Section: Regional economy
Article in issue: 6 т.14, 2021.
Free access
The paper solves the problem of clustering Russian Federation regions according to their socioeconomic development, taking into account the sectoral structure of the gross regional product. Classical machine learning methods are a tool for solving the clustering problem. The object of the study is the differentiation of regions according to various socio-economic indicators. The subject of the study is the practice of using machine learning methods for clustering objects. The initial database for solving the problem of clustering regions includes actual statistical data on socio-economic development of RF constituent entities and the sectoral structure of their gross regional product as of 2019. We identify clusters of regions according to their socio-economic development with the use of modern machine learning methods implemented in Python, a high-level programming language, with the connection of libraries for working with data: Pandas, Sklearn, SciPy, etc. The preprocessing of the initial data was carried out: digitization of data categories, transition to specific values, standardization of indicators. The initial data set for 2019 contains 5,525 records on 65 indicators of socio-economic development for 85 regions of the Russian Federation. It identifies 15 basic indicators of socio-economic development of a region, based on the principal component analysis. According to these indicators, five regional clusters were identified with the use of the k-means clustering: the first cluster is characterized by a high share of wholesale and retail trade, real estate transactions, professional, scientific and technological activities in the GRP structure; the second cluster specializes in manufacturing, wholesale and retail trade, real estate transactions, agriculture and forestry; the third cluster can be described as a cluster with a mixed economy, which is characterized by averages for the main socio-economic indicators in the Russian Federation; regions of the fourth cluster show a high level of unemployment and a high share of public administration, military and social security; the fifth cluster specializes in mining.
Socio-economic indicators, industry structure, gross regional product, machine learning, cluster analysis, principal component analysis
Short address: https://sciup.org/147236306
IDR: 147236306 | UDC: 004.85 | DOI: 10.15838/esc.2021.6.78.4
Text of the scientific article Clustering Russian Federation regions according to the level of socio-economic development with the use of machine learning methods
At present time, the elaboration of an effective strategy for the regions development in the Russian Federation requires an assessment of the current state and prospects for changes in their socioeconomic development. This task is quite difficult, especially given the significant inter-regional differences in socio-economic development, financial and economic opportunities, innovation potential, the quality of human capital, etc. [1; 2; 3]. One of the functional tools for the formation of an effective regional development strategy is cluster analysis.
Cluster analysis is one of the methods of multivariate statistical analysis of data, which allows distinguishing some homogeneous groups of objects according to various parameters [4; 5]. For the purposes of our study, the use of cluster analysis helps to identify groups of Russian regions with a similar level of socio-economic development. The identification of such clusters is the basis for the development of differentiated and targeted support measures from the state.
We should note that in Russian scientific studies the regions are the most typical objects of clustering and classification in terms of different criteria: innovation development [1], quality of life [6], birth rate [7], public health [8], human capital level [9], agricultural efficiency [10], foreign economic activity [11], energy efficiency [12], road and transport system [13], etc. These works are performed on the basis of clustering by individual indicators. There are also studies in which the clustering of regions is carried out by a set of indicators containing 10–15 parameters (see, for example, [14]).
Our work is aimed at solving the problem of clustering regions by the set of indicators that reflect the socio-economic development of the RF constituent entities, as well as considering the sectoral specifics of regional economic development. In the presented study, we processed a data set containing 65 indicators.
The purpose of the study is to identify homogeneous regional clusters using methods of data analysis and machine learning to develop a platform for adopting the right forms of support for the regions, stimulating the breakthrough growth of the economy in the Russian Federation as a whole. In order to achieve this goal, we must solve a number of tasks, in particular:
– to identify the structure of indicators characterizing the socio-economic development of regions, considering the sectoral specifics, through the formation of groups, based on the information available on the official website of the Federal State Statistics Service;
– to collect and verify the quality of a large set of initial data for the cluster analysis of the regions of the Russian Federation;
– to carry out pre-analysis of the data: filling gaps, data conversion (transition to specific values), standardization, distinguishing the main indicators in each group of indicators using the principal component analysis;
– to identify homogeneous regional clusters by applying machine learning methods;
– to analyze the differentiation of average indicators of regional cluster development in order to verify the quality of the clustering performed.
Thus, the scientific novelty of the proposed study consists in solving the problem of clustering on the basis of the big statistical date considered as a whole. The study also has practical relevance, as it allows formulating the features of socio- economic development of groups of regions, on the basis of which we can form a strategy for their development and investment policy in the currently relevant areas of life of the RF constituent entities.
Machine learning methods for solving the clustering problem
Machine learning is a large section of the study of artificial intelligence; it includes methods for building various algorithms capable of self-learning. As a rule, the scientific literature distinguishes three groups of classical methods of machine learning, often used for data mining [15–18]:
– learning with a teacher (regression, classification);
– learning without a teacher (search for rules, dimensionality reduction, clustering);
– reinforcement learning (genetic algorithm, Q-learning, etc.).
In practice, the following algorithms and machine learning methods are used for clustering [15; 19; 20; 21]:
-
1) heuristic graph algorithms (connected component labeling, open shortest path algorithm, FOREL algorithm);
-
2) statistical algorithms based on partitioning ( k -means clustering, DBSCAN algorithm based on distribution density of studied characteristics);
-
3) hierarchical clustering (agglomerative and divisive (CURE, ROCK, Chameleon algorithms, Ward clustering);
-
4) fuzzy clustering (FCM, FCS and MM algorithms).
Each group of clustering methods has its own advantages and disadvantages. In particular, statistical algorithms based on dividing, work effectively with large amounts of data, which is not always possible to say about graph methods of clustering. The disadvantage of fuzzy clustering is the inability to correctly divide objects into clusters if there is a large variance in different dimensions of elements [22].
Hierarchical, k -means clustering, and the DBSCAN have an important advantage in finding arbitrarily-shaped clusters. Clustering of elements by these methods refers to iterative ones [23]. One should note that for the k -means and DBSCAN clustering, it is first required to make a decision on the values of the hyperparameters of the algorithms. For the k -means method, it is necessary to know the number of cluster partitions; for the DBSCAN, one needs to select the size of the neighborhood and the minimum number of elements in it. The researcher can make decisions based on their own intuition or by conducting a preliminary search for the optimal values of the necessary hyperparameters.
At the same time, most often researchers give preference to the k -means method, because it has such advantages as high efficiency with the simplicity of its implementation, a sufficient level of quality of the performed clustering and the possibility of calculating processes paralleling [24; 25]. Thus, the use of this algorithm is appropriate when working with big data to extract new knowledge.
Pre-processing of the initial set of statistical data to solve the problem of regions’ clustering
Statistical information on the main indicators of the regions development in the Russian Federation is provided by the Federal State Statistic Service1. Since the content of reports of the FSSS on the regions has recently changed, both due to changes in the methodology of calculation of indicators and the All-Russian Classifier of Economic Activities, and transformations in the political-territorial structure, the current period of 2015–2019 was chosen for the analysis.
The initial data set for 2019 contains 5,525 records on 65 indicators of socio-economic development of 85 RF regions. The indicators selected for the analysis and clustering of regions are shown in Table 1 . They are combined into socio-economic development directions. A similar approach was used in the work [26], which identified eight groups of indicators of regional development. Our study identifies groups according to the all-Russian classifiers introduced in statistical practice, used in the compilation of the statistical collection “Regions of Russia. Main socio-economic indicators”.
Table 1. Indicators of socio-economic development of regions
|
Group |
Indicator name, change unit |
Designation |
Conversion |
Indicator (principle component) |
|
Federal Okrugs/ Districts |
Central Federal District (CFD), Northwestern Federal District (NWFD), Southern Federal District (SFD), North Caucasian Federal District (NCFD), Volga Federal District (VFD), Ural Federal District (UFD), Siberian Federal District (SibFD), Far Eastern Federal District (FEFD) |
– |
Dummy variables |
PCA1 |
|
Main socioeconomic indicators |
Population, thousand people |
X 1 |
– |
PCA2 PCA3 |
|
Cost of fixed assets, million rubles |
X 2 |
Y 1 = X 2 /X 1 |
||
|
Mineral extraction, million rubles |
X 3 |
Y 2 = X 3 /X 1 |
||
|
Agriculture, million rubles |
X 4 |
Y 3 = X 4 /X 1 |
||
|
Manufacturing industries, million rubles |
X 5 |
Y 4 = X 5 /X 1 |
||
|
Electricity, gas and steam supply; air conditioning, million rubles |
X 6 |
Y 5 = X 6 /X 1 |
||
|
Water supply; wastewater disposal, organization of waste collection and disposal, activities to eliminate pollution, mln rubles |
X 7 |
Y6 = X7/X1 |
||
|
Retail turnover, million rubles |
X 8 |
Y 7 = X 8 /X 1 |
||
|
Balanced financial result, million rubles |
X 9 |
Y 8 = X 9 /X 1 |
1 Regions of Russia. Socio-economic indicators. Available at:
Continuation of Table 1
|
Group |
Indicator name, change unit |
Designation |
Conversion |
Indicator (principle component) |
|
Population |
The ratio of men to women, per 1,000 men there are women |
X10 |
X10 |
PCA4 PCA 5 |
|
Proportion of the population under working age, percentage of the total population |
X11 |
X11 |
||
|
Proportion of the population of working age, percentage of the total population |
X12 |
X12 |
||
|
Proportion of the population over working age, percentage of the total population |
X 13 |
X 13 |
||
|
Total birth rates, number of births per 1,000 population |
X 14 |
X 14 |
||
|
Total mortality rates, number of deaths per 1,000 population |
X 15 |
X 15 |
||
|
Infant mortality rates, the number of children who died before the age of 1 year, per 1000 live births |
X 16 |
X 16 |
||
|
Marriage to divorce ratio, divorces per 1,000 marriages |
X 17 |
X 17 |
||
|
Employment and unemployment |
Unemployment rate, % |
X 18 |
X 18 |
PCA 6 |
|
Average annual number of employees, thousand people |
X19 |
Y 9 = X 19 /X 1 |
||
|
Demand for personnel declared by employers, people |
X20 |
Y 10 = X 20 /X 1 |
||
|
Number of employees of state and local authorities, people |
X21 |
Y 11 = X 21 /X 1 |
||
|
Standard of living |
Average nominal accrued salary of organization employees, rubles/ month |
X22 |
X22 |
PCA7 |
|
Average per capita cash income, rubles/month |
X23 |
X23 |
||
|
Consumer spending on average per capita, rubles/month |
X24 |
X24 |
||
|
Average size of assigned pensions, rubles/month |
X25 |
X25 |
||
|
Housing stock, million square meters |
X26 |
Y 12 = X 26 /X 1 |
||
|
Fresh water use, million cubic meters |
X 27 |
Y 13 = X 27 /X 1 |
||
|
Investments |
Foreign direct investment in Russia, million rubles |
X 28 |
Y 14 = X 28 /X 1 |
PCA8 |
|
Investments in fixed capital, million rubles |
X 29 |
Y 15 = X 29 /X 1 |
||
|
Proportion of investments in Russian property, % |
X30 |
X30 |
||
|
Education |
The number of students in preschool educational organizations, people |
X31 |
Y 16 = X 31 /X 1 |
PCA9 |
|
The number of students in general education, people |
X32 |
Y 17 = X 32 /X 1 |
||
|
Number of students in vocational education, people |
X33 |
Y 18 = X 33 /X 1 |
||
|
The number of bachelor’s, specialist’s, and master’s degree students, people |
X34 |
Y 19 = X 34 /X 1 |
||
|
The number of graduate students, people |
X35 |
Y 20 = X 35 /X 1 |
||
|
The number of teachers in organizations of primary and secondary education, thousand people |
X36 |
Y 21 = X 36 /X 1 |
||
|
The number of higher-education teaching personnel in organizations of bachelor’s, specialist’s and master’s degree programs, people |
X 37 |
Y 22 = X 37 /X 1 |
||
|
Health Care |
The number of doctors of all specialties, thousand people |
X 38 |
Y 23 = X 38 /X 1 |
PCA 10 |
|
The number of people for one hospital bed, people |
X 39 |
X 39 |
||
|
The number of patients with a first-time diagnosis, per 1,000 people, people |
X40 |
X40 |
||
|
Culture, recreation and tourism |
The number of spectators of theaters and the number of visits to museums per 1,000 people, people |
X 41 |
Y 24 = X 41 /X 1 |
PCA 11 |
|
The number of sports facilities, units |
X 42 |
Y 25 = X 42 /X 1 |
||
|
Library stock, copies/items |
X 43 |
Y 26 = X 43 /X 1 |
||
|
The number of Russian tourists who used travel agencies, people |
X 44 |
Y 27 = X 44 /X 1 |
||
|
The number of registered crimes, units |
X45 |
Y 28 = X 45 /X 1 |
End of Table 1
|
Group |
Indicator name, change unit |
Designation |
Conversion |
Indicator (principle component) |
|
The size and structure of the gross regional product |
Gross Regional Product (GRP), million rubles |
X46 |
Y 29 = X 46 /X 1 |
PCA 12 |
|
Sectoral structure of GRP: |
||||
|
Mineral extraction, proportion |
X47 |
X47 |
||
|
Wholesale and retail trade; repair of vehicles and motorcycles, proportion |
X48 |
X48 |
||
|
Activities in the field of information and communication, proportion |
X 49 |
X 49 |
||
|
Activities on operations with real estate, proportion |
X 50 |
X 50 |
||
|
Activities in the field of health and social services, proportion |
X 51 |
X 51 |
||
|
Activities in the field of culture, sports, leisure and entertainment, proportion |
X 52 |
X 52 |
||
|
Activities of households as employers, proportion |
X53 |
X53 |
||
|
Agriculture, forestry, hunting, fishing and fish farming, proportion |
X54 |
X54 |
PCA 13 |
|
|
Manufacturing activity, proportion |
X55 |
X55 |
||
|
Building activity, proportion |
X56 |
X56 |
||
|
Financial and insurance activities, proportion |
X57 |
X57 |
||
|
Professional, scientific, and technical activities, proportion |
X58 |
X58 |
||
|
Public administration and military security; social security, proportion |
X59 |
X59 |
||
|
Education, proportion |
X 60 |
X 60 |
||
|
Water supply; wastewater disposal, organization of waste collection and disposal, activities to eliminate pollution, proportion |
X 61 |
X 61 |
PCA 14 |
|
|
Transportation and storage, proportion |
X62 |
X62 |
||
|
Administrative activities and related ancillary services, proportion |
X63 |
X63 |
||
|
Electricity, gas and steam supply; air conditioning, proportion |
X64 |
X64 |
PCA 15 |
|
|
Activities of hotels and catering companies, proportion |
X65 |
X65 |
||
|
Source: own compilation. |
||||
In the study, we carried out the transition to the specific values of some indicators of socio-economic development in the region. In particular, we replaced the indicator of the fixed assets value by the specific fixed assets value per capita (X2 → Y1), the volume of mineral production in monetary terms – by the specific value of mined minerals per capita (X3 → Y2), etc. However, the transition only to specific values is not enough, because the results of the cluster analysis may be inadequate due to the influence of different units of measurement of the values. In order to bring all indicators to a single dimensionless format and represen- tation, which ensures the correct application of multivariate clustering, we propose to perform their standardization [27]:
~j xi
X = -L
—
о Y.
* L
X
,
where x- standardized value of x^-indicator; x^ — initial or specific value of the indicator for the j-region; ax. — root-mean-square deviation of the xi-indicator from its average value for all regions;
t = 1, 65; j = 1, 85 .
Further, in order to effectively conduct clustering and identify significant features that influence it, we propose to reduce the dimensionality of the original data set by principal component analysis (PCA) [28]. The algorithm tries to find projections in the data that preserve the maximum variance. It reduces dimensionality, removes uninformative features, and still retains the ability to separate the data.
In order to determine the number of required indicators (principal components), reflecting the differentiation of regions in terms of socio-economic development, we should plot the dependence of the explained variance proportion on the number of indicators. Figure 1 shows the above dependence for the problem to be solved. It was plotted using PCA method implemented in Python using Sklearn library and decomposition.PCA function ()2.
From the obtained plot of variance in the direction of the eigenvector explained by each of the components, we can see that it is sufficient to include 15 development indicators in the analysis, which will describe about 85% of the variance.
We introduce 15 principal components into the study according to the enlarged groups identified in Table 1. Figure 2 shows the HeatMap display of the Pearson correlation coefficients ( SciPy library) between the specific main socioeconomic indicators and the PCA-method PCA 2 and PCA 3 principal components obtained for them. According to the values of the correlation coefficients between the indicators, we can see that the principal component of PCA 2 is responsible for the variables Y 1, Y 5, Y 6 and Y 8 (pair correlation coefficients are in the range of 0.7–0.8 and indicate a strong correlation), and the principal component of PCA 3 is responsible for the variables Y 2 and Y 4.
Figure 3 shows a similar HeatMap display of the Pearson correlation coefficients between the variables characterizing the GRP industry structure and the principal components PCA 12, PCA 13, PCA 14, and PCA 15 obtained for them.
Figure 1. Dependence of the explained variance proportion on the number of indicators of socio-economic development of regions
Explained variance proportion
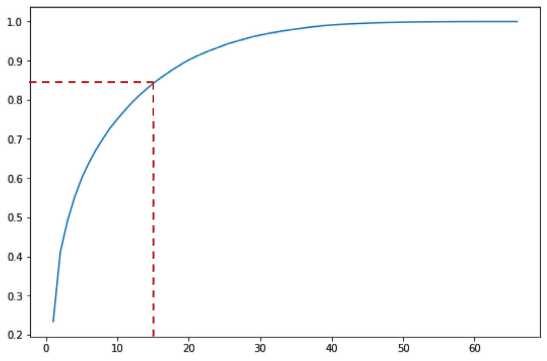
Number socio-economic development indicators
Source: own compilation.
Figure 2. HeatMap display of the Pearson correlation coefficients between socio-economic indicators and their principal components
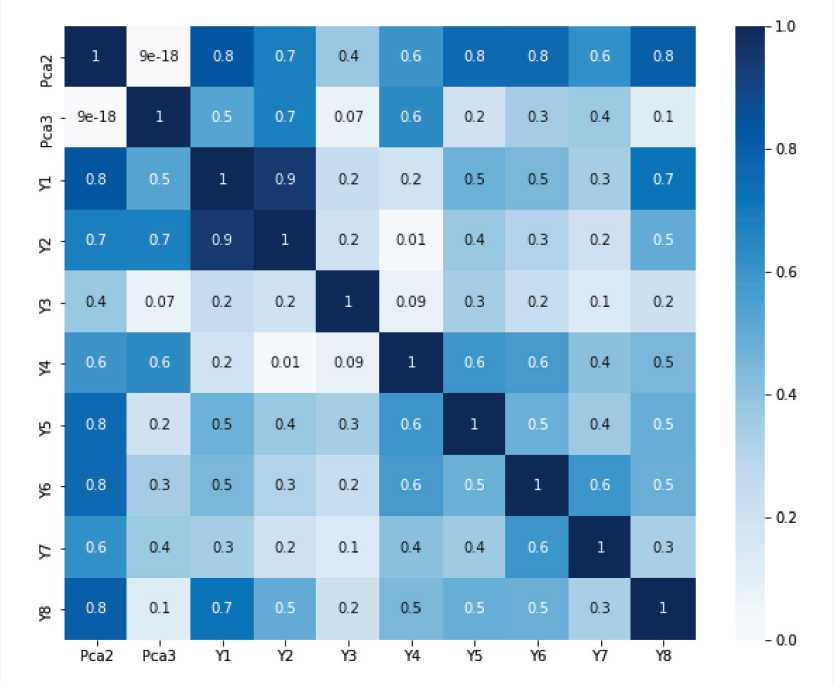
Source: own compilation.
Figure 3. HeatMap display of the Pearson correlation coefficients between variables (X47–X65) and principal components (PCA12–PCA15)
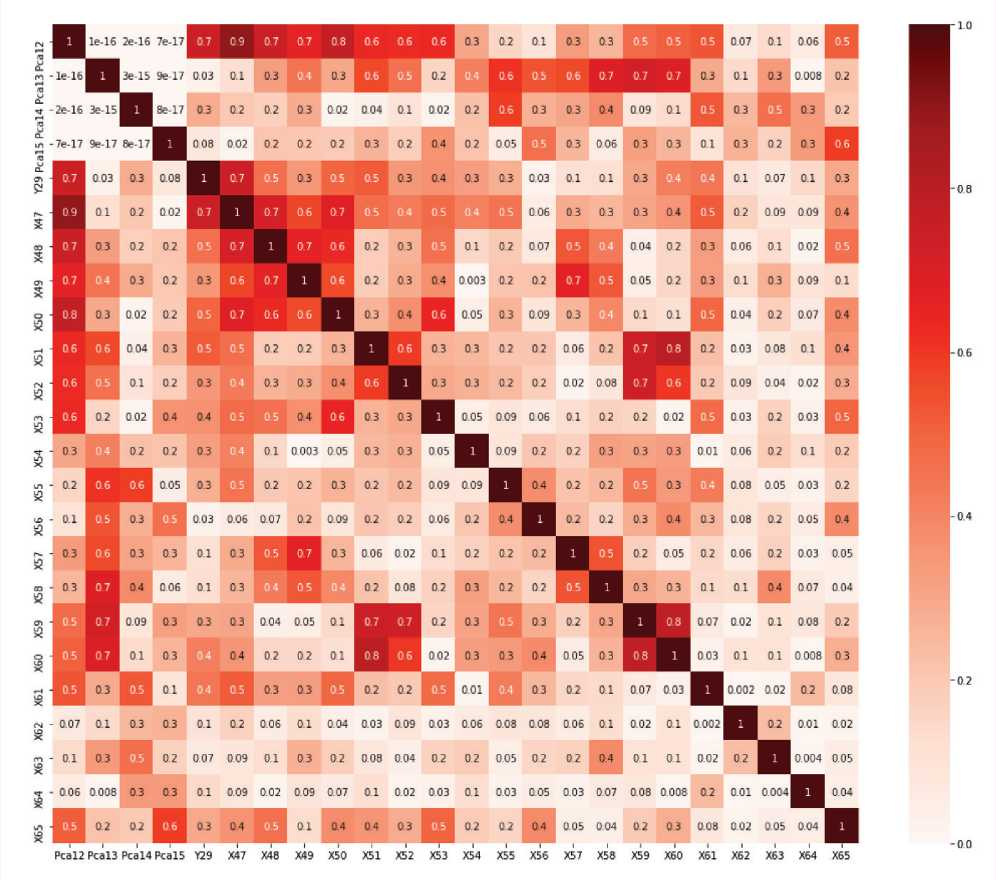
Source: own compilation.
The study shows that after the transition to unit variables and reducing the dimensionality of the initial indicators of socio-economic development of regions, 15 indicators can be used for clustering. As a result, the transformed dataset contains 1,275 records. Figure 4 shows the pairwise correlation diagrams for the principal components of the transformed data set and their histograms.
Visually, there are no close links between the indicators of socio-economic development of the regions, so it is advisable to conduct multidimensional clustering for all indicators.
Solving the problem of clustering regions by level of socio-economic development
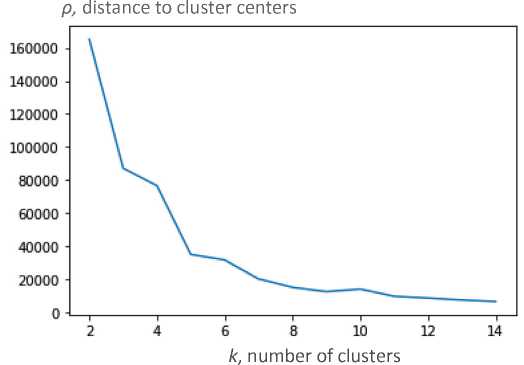
As mentioned above, among the effective methods of clustering is the k -means method, the optimal number of which is determined based on the analysis of the total square of the distances from the assumed centers to the regions in the cluster (Fig. 5) . The k-means method was implemented in Python using the Sklearn library and its built-in cluster.KMeans function ()3.
From the graph shown in Figure 5, we can see that when the number of clusters changes
Figure 4. Pairwise graphs of development indicators and their histograms
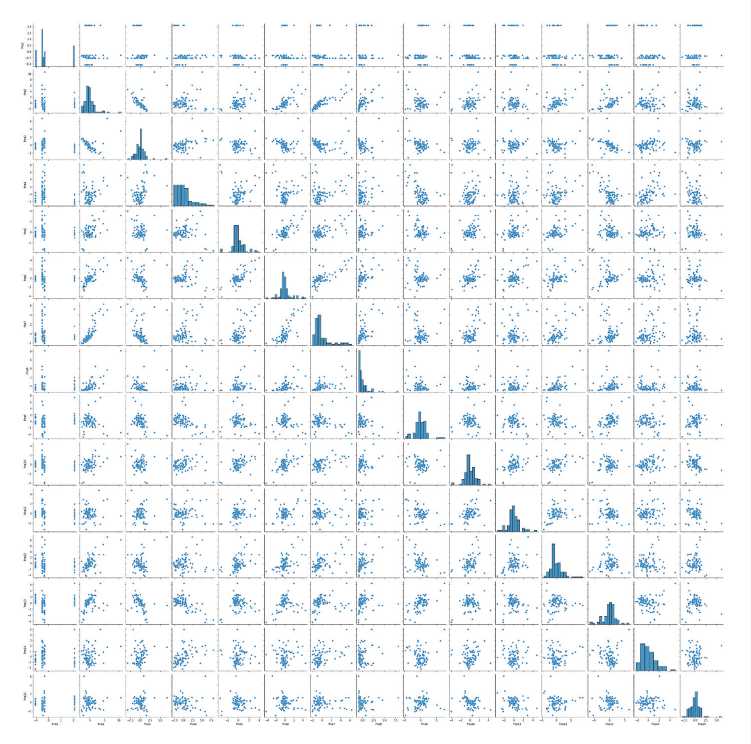
Source: own compilation.
from 4 to 5, the total distance from the centers to the cluster objects decreases dramatically, while for the number of clusters greater than 5 this indicator decreases slightly; using k > 5
is not reasonable (check performed by F-test using the library SciPy ). Thus, it is economically feasible to allocate 5 regional clusters (Tab. 2) .
Figure 5. Dependence of the distance from the assumed centers to the regions in the cluster and the number of clusters
Source: own compilation.
Table 2. Clustering of regions by level of socio-economic development considering sectoral structure
|
Cluster |
Regions |
|
1 |
Moscow, Saint Petersburg |
|
2 |
Belgorod Oblast, Bryansk Oblast, Vladimir Oblast, Voronezh Oblast, Ivanovo Oblast, Kaluga Oblast, Kostroma Oblast, Kursk Oblast, Lipetsk Oblast, Moscow Oblast, Oryol Oblast, Ryazan Oblast, Smolensk Oblast, Tambov Oblast, Tver Oblast, Tula Oblast, Yaroslavl Oblast |
|
3 |
Altai Krai, Amur Oblast, Arkhangelsk Oblast, Astrakhan Oblast, Volgograd Oblast, Vologda Oblast, Jewish Autonomous Oblast, Zabaykalsky Krai, Irkutsk Oblast, Kaliningrad Oblast, Kamchatka Krai, Kemerovo Oblast, Kirov Oblast, Krasnodar Krai, Krasnoyarsk Krai, Kurgan Oblast, Leningrad Oblast, Murmansk Oblast, Nizhny Novgorod Oblast, Novgorod Oblast, Novosibirsk Oblast, Omsk Oblast, Orenburg Oblast, Penza Oblast, Perm Krai, Primorsky Krai, Pskov Oblast, Republic of Adygea, Republic of Bashkortostan, Republic of Karelia, Komi Republic, Mari El Republic, Republic of Mordovia, Republic of Tatarstan, Republic of Khakassia, Rostov Oblast, Samara Oblast, Saratov Oblast, Sverdlovsk Oblast, Stavropol Krai, Tomsk Oblast, Tumen Oblast, Udmurt Republic, Ulyanovsk Oblast, Khabarovsk Krai, Chelyabinsk Oblast, Chuvash Republic |
|
4 |
Kabardino-Balkarian Republic, Karachay-Cherkess Republic, Altai Republic, Republic of Buryatia, Republic of Dagestan, Republic of Ingushetia, Republic of Kalmykia, Republic of Crimea, Republic of North Ossetia– Alania, Tuva Republic, Chechen Republic, Sevastopol |
|
5 |
Magadan Oblast, Nenets Autonomous Okrug, Republic of Sakha (Yakutia), Sakhalin Oblast, Khanty-Mansi Autonomous Okrug–Yugra, Chukotka Autonomous Okrug, Yamalo-Nenets Autonomous Okrug |
|
Source: own compiation. |
|
The first cluster includes the federal cities of Moscow and Saint Petersburg, and the second cluster includes regions only from the Central Federal District. The third cluster consists of constituent entities of the Volga Federal District (30%), the Northwestern Federal District (20%), the Siberian Federal District (17%), the Far Eastern Federal District (13%), the Southern Federal District (11%), and the Urals Federal District (9%). In the fourth cluster, 50% are occupied by constituent entities of the North Caucasian Federal District, 25% by the Southern Federal District, 17% by the Siberian Federal District, and 8% by the Far Eastern Federal District. The fifth cluster comprises 57% of regions of the Far Eastern Federal District, 29% of the Ural Federal District, and 14% of the Northwestern Federal District.
The color chart of the cluster distribution of the constituent entities of the Russian Federation by level of socio-economic development is shown in Figure 6 .
Table 3 shows the values of various indicators characterizing the socio-economic development of regions, on average for the selected cluster.
According to the analysis of the data on the level of socio-economic development of the regions, considering the sectoral structure, we can conclude that:
– the first cluster is characterized by a high proportion in the structure of GRP of wholesale and retail trade, a high proportion of real estate operations, professional, scientific and technical activities, information and communication
Table 3. Average values of a number of indicators by cluster for 2019
|
Cluster number |
Cluster 1 |
Cluster 2 |
Cluster 3 |
Cluster 4 |
Cluster 5 |
|
Specific GRP (Y29), thousand rubles/person |
1 250.5 |
430.7 |
496.8 |
238.4 |
3 290.5 |
|
Specific value of fixed assets (Y1), thousand rubles/person |
4 670.4 |
1 766.7 |
1 827.3 |
904.2 |
11 119.5 |
|
Proportion of employed people in the total population, % (Y9) |
64.5 |
46.0 |
45.4 |
38.3 |
64.8 |
|
Unemployment rates (X18), % |
1.4 |
4.0 |
5.2 |
11.6 |
4.7 |
|
Average per capita income of the population (X23), rubles/months |
60 611.0 |
29 548.4 |
29 074.0 |
22 173.3 |
67 221.7 |
|
Consumer spending on average per capita (X24), rubles/months |
48 040.0 |
24 114.8 |
23 720.0 |
16 873.8 |
36 079.6 |
|
Proportion of the mining industry in GRP (X47), % |
0.2 |
2.1 |
10.3 |
2.9 |
60.3 |
|
Proportion of wholesale and retail trade in GRP (X48), % |
20.7 |
13.8 |
10.8 |
12.2 |
3.8 |
|
Proportion of the information and communication industry in GRP (X49), % |
6.2 |
2.1 |
2.0 |
2.1 |
0.6 |
|
Proportion of real estate operations in GRP (X50), % |
14.8 |
11.1 |
9.4 |
11.3 |
2.1 |
|
Proportion of agriculture, forestry, hunting, fishing and fish farming in GRP (X54), % |
0.1 |
10.1 |
7.3 |
11.5 |
2.0 |
|
Proportion of manufacturing in GRP (X55), % |
14.8 |
22.5 |
19.0 |
5.1 |
1.6 |
|
Proportion of construction in GRP (X56), % |
3.6 |
5.7 |
5.7 |
9.1 |
6.6 |
|
Proportion of professional, scientific and technical activities in GRP (X 58 ), % |
8.2 |
2.6 |
2.7 |
1.2 |
0.9 |
|
Share of public administration and military security, social security (X59), % |
5.2 |
6.3 |
7.2 |
15.1 |
5.3 |
|
Proportion of education in GRP (X60), % |
2.9 |
3.7 |
3.6 |
7.2 |
2.3 |
|
Source: own compilation. |
|||||
Figure 6. Color chart of the cluster distribution of constituent entities of the Russian Federation by level of socio-economic development
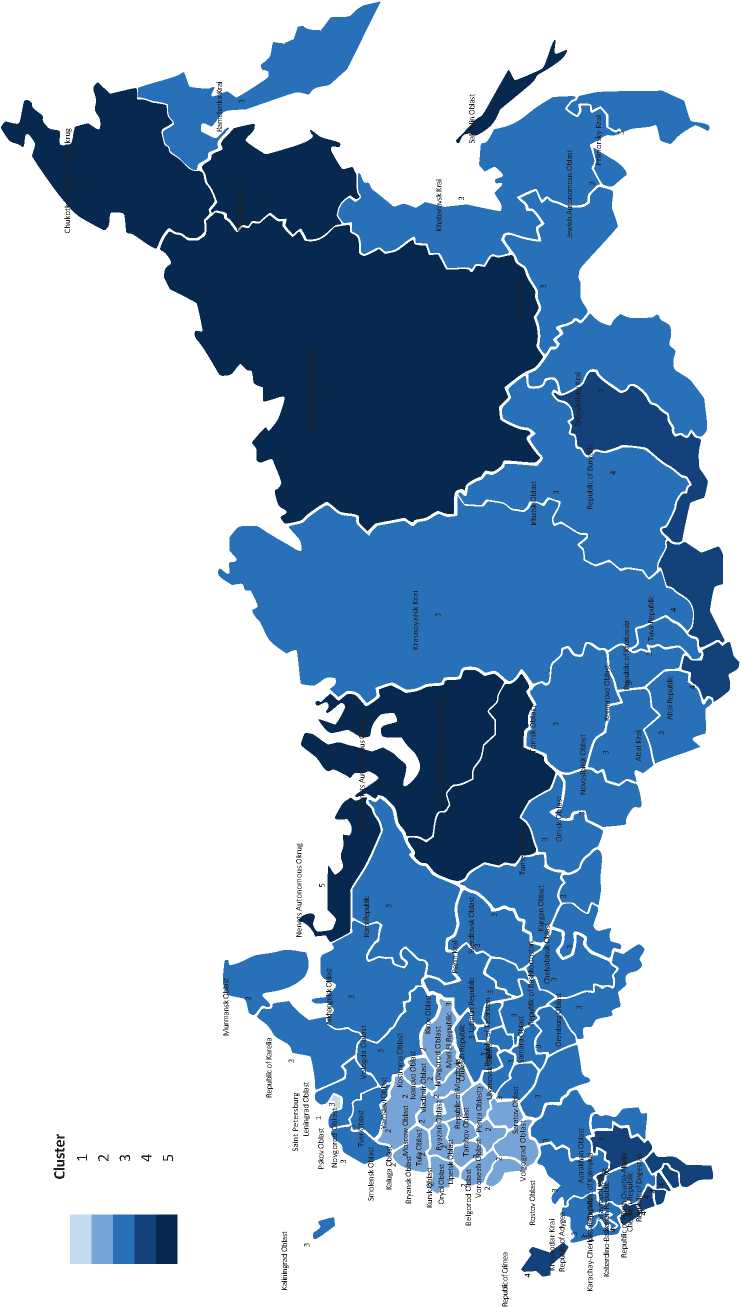
Source: own compilation.
industry; this cluster is characterized by a high proportion of employed in the economy, low unemployment rate, and high average per capita cash income and expenses;
– the second cluster specializes in manufacturing, wholesale and retail trade, real estate operations, agriculture, and forestry;
– the third cluster, containing the largest number of regions, can be described as a cluster with a mixed economy, which is characterized by the average values of the main socio-economic indicators in RF;
– the fourth cluster is characterized by low values of socio-economic indicators; in its regions of this cluster there is a high level of unemployment, the proportion of those employed in the economy is only 38%; in contrast to the others, the fourth cluster revealed a high proportion of public administration, and military security, social security, education, construction;
– the fifth cluster specializes in mining, its regions are characterized by the maximum average per capita income of the population in Russia.
Conclusion
The study involved the clustering of Russian regions according to the level of their socioeconomic development and the sectoral structure of gross regional product. We used such methods of machine learning without a teacher, as methods of the principal components and k -means to carry out the cluster analysis.
The initial data set included indicators of regional development by aggregated groups in accordance with the classifiers introduced into statistical practice: basic socio-economic indicators; population; employment and unemployment; living standards; investment; education; health care; culture, recreation and tourism; the size and structure of the gross regional product. For the indicators of each aggregated group, using the method of principal components, we identified characteristic indicators, due to which we were able to reduce the dimensionality of the original data set from 65 to 15 indicators.
We found that it is advisable to allocate five regional clusters by level of socio-economic development, considering the sectoral structure of the constituent entities.
Using the k -means method, we obtained that the first cluster includes the most developed cities of the Russian Federation: Moscow and Saint Petersburg. It is characterized by a high proportion of people employed in the economy, low unemployment, high average per capita income and expenditure. On the territory of the cluster is developed professional scientific and technical activity, actively functioning information and communication industry, developed trade.
The second cluster contains regions of the Central Federal District. It is characterized by well-developed manufacturing, agriculture, forestry, and trade.
The third cluster, the largest by number of regions, consists of the Volga Federal District constituent entities (30% in the cluster structure), the Northwestern Federal District (20%), and the Siberian (17%), Far Eastern (13%), Southern (11%), and Ural (9%) federal districts. This is a cluster with a mixed economy, which is characterized by average values for the main socio-economic indicators in the Russian Federation.
The fourth cluster contains the least developed regions of the Russian Federation and, accordingly, is characterized by low values of socio-economic indicators. Half consists of the constituent entities of the North Caucasian Federal District, a quarter of the constituent entities of the Southern Federal District, 17% of the Siberian and 8% of the Far Eastern federal districts. This cluster has a high proportion of public administration and military security, social security, education, and construction. Its facilities are characterized by a high unemployment rate, the proportion of those employed in the economy being only 38%.
The fifth cluster specializes in the extraction of minerals. It includes regions of the Far Eastern (57%), Ural (29%), Northwestern (14%) federal districts. The regions of the fifth cluster are characterized by the maximum average per capita income of the population in the Russian Federation.
Thus, the developed methodology of cluster analysis allows forming sustainable regional clusters according to the socio-economic development of the constituent entities of the Russian Federation. The performed clustering, considering the sectoral structure of regional economies, can be used in the implementation of cluster-oriented state policy in order to support the accelerated development of the constituent entities.
References Clustering Russian Federation regions according to the level of socio-economic development with the use of machine learning methods
- Golova I.M., Sukhovey A.F. Differentiation of innovative development strategies considering specific characteristics of the Russian regions. Economy of Region, 2019, vol.15, pp. 1294–1308. DOI:10.17059/2019-4-25
- Mariev O., Pushkarev A. Clustering Russian regions by innovative outputs using a multi indicator approach. In: Proceedings of the 7th International Conference Innovation Management, Entrepreneurship and Sustainability (IMES), 2019. Pp. 519–533.
- Ketova K.V., Vavilova D.D. Neural network forecasting algorithm as a tool for assessing human capital trends of the socio-economic system. Ekonomicheskie i sotsial’nye peremeny: fakty, tendentsii, prognoz=Economic and Social Changes: Facts, Trends, Forecast, 2020, vol. 13, no. 6, pp. 117–133DOI:10.15838/esc.2020.6.72.7 (in Russian).
- Shubat O.M., Bagirova A.P., Akishev A.A. Methodology for analyzing the demographic potential of Russian regions using fuzzy clustering. Economy of Region, vol. 15, pp. 178–190. DOI:10.17059/2019-1-14
- Ketova K.V., Trushkova E.V. The solution of the logistics task of fuel supply for the regional distributed heat supply system. Komp’yuternye issledovaniya i modelirovanie=Computer Research and Modeling, 2012, vol. 4, no. 2, pp. 451–470 (in Russian).
- Lokosov V.V., Ryumina E.V., Ul’yanov V.V. Clustering of regions by indicators of quality of life and quality of population. Narodonaselenie=Population, 2019, vol. 22, no. 4, pp. 4–17 (in Russian).
- Kostina S.N., Trynov A.V. Cluster analysis of the dynamics of the birth rate of fourth and subsequent children in Russian regions. Ekonomicheskie i sotsial’nye peremeny: fakty, tendentsii, prognoz=Economic and Social Changes: Facts, Trends, Forecast, 2021, vol. 14, no 3, pp. 232–245. DOI:10.15838/esc.2021.3.75.14 (in Russian).
- Lavrinenko P.A., Rybakova D.A. Comparative analysis of regional differences in healthcare, environment, and public health. Ekonomicheskie i sotsial’nye peremeny: fakty, tendentsii, prognoz=Economic and Social Changes: Facts, Trends, Forecast, 2015, no. 5(41), pp. 198–210 (in Russian).
- Petrykina I.N. Cluster analysis of regions of the Central Federal District in terms of human capital development. Vestnik Voronezhskogo gosudarstvennogo universiteta. Ekonomika i upravlenie=Proceedings of Voronezh State University. Series: Economics and Management, 2013, no. 1, pp. 72–80 (in Russian).
- Demichev V.V., Maslakova V.V., Nestratova A.A. Clustering Russian regions by level of agricultural efficiency. Bukhuchet v sel’skom khozyaistve=Accounting in Agriculture, 2020, no. 12, pp. 58–66. DOI:10.33920/sel-11-2012-06 (in Russian).
- Aksenov I.A. Clustering of foreign economic activity of regions. Ekonomika i menedzhment sistem upravleniya=Economics and Systems Management, 2016, no. 1–3, pp. 309–315 (in Russian).
- Marchenko E.M., Belova T.D. Clustering of regions taking into account the energy efficiency. Regional’naya ekonomika: teoriya i praktika=Regional Economics: Theory and Practice, 2016, no. 1(424), pp. 51–60 (in Russian).
- Paul S., Alvi A.M., Nirjhor M.A., Rahman S., Orcho A.K., Rahman R.M. Analyzing accident prone regions by clustering. Advanced Topics in Intelligent Information and Database Systems, 2017, vol. 710, pp. 3–13.
- Orlova I.V., Filonova E.S. Cluster analysis of the regions of the central federal district socio-economic and demographic indicators. Statistika i ekonomika=Statistics and Economics, 2015, no. 5, pp. 111–115. DOI: 10.21686/2500-3925-2015-5-136-142 (in Russian).
- Ultsch A., Lotsch J. Machine-learned cluster identification in high-dimensional data. Journal of Biomedical Informatics, 2017, vol. 66, pp. 95–104. DOI: 10.1016/j.jbi.2016.12.011
- Khan I., Luo Z., Shaikh A.K., Hedjam R. Ensemble clustering using extended fuzzy k-means for cancer data analysis. Expert Systems with Applications, 2021, vol. 172, 114622. DOI: 10.1016/j.eswa.2021.114622
- Ming F., Stephen T.A Machine learning based asset pricing factor model comparison on anomaly portfolios. Economics Letters, 2021, vol. 204, 109919. DOI: 10.1016/j.econlet.2021.109919
- Blekanov I., Krylatov A., Ivanov D., Bubnova Y. Big data analysis in social networks for managing risks in clothing industry. IFAC PapersOnLine, 2019, vol. 52 (13), pp. 1710–1714.DOI: 10.1016/j.ifacol.2019.11.447
- Arthur D., Vassilvitskii S. K-means++: The advantages of careful seeding. In: Conference: Proceedings of the Eighteenth Annual ACM-SIAM Symposium on Discrete Algorithms, SODA 2007, New Orleans, Louisiana, USA. DOI: 10.1145/1283383.1283494
- Ozgur O., Akkoc U. Inflation forecasting in an emerging economy: Selecting variables with machine learning algorithms. International Journal of Emerging Markets, 2020. DOI: 10.1108/IJOEM-05-2020-0577
- Faizullin R.V. Simulator of the navigation equipped with LIDAR of the mobile robot based on the neural network. IOP Conference Series: Materials Science and Engineering, 2020, vol. 873, no. 1. DOI: 10.1088/1757-899X/873/1/012023
- De Sousa J.M., Santos R.L.D., Lopes L.A., Machado V.P., Silva I.S. Automatic labelling of clusters with discrete and continuous data using supervised machine learning. In: Proceedings of the 35th International Conference of the Chilean Computer Science Society (SCCC). 2016.
- Lee C.H., Steigerwald D.G. Inference for clustered data. Stata Journal, 2018, vol. 18, no. 2, pp. 447–460. DOI: 10.1177/1536867X1801800210
- Mitra D., Chu Y., Cetin K. Cluster analysis of occupancy schedules in residential buildings in the United States. Energy and Buildings, 2021, vol. 236, 110791, DOI: 10.1016/j.enbuild.2021.110791
- Ofetotse E.L., Essah E.A., Yao R. Evaluating the determinants of household electricity consumption using cluster analysis. Journal of Building Engineering, 2021, vol. 43, 102487, DOI: 10.1016/j.jobe.2021.102487
- Aivazian S., Afanasiev M., Kudrov A. Indicators of the main directions of socio-economic development in the space of characteristics of regional differentiation. Applied Econometrics, 2019, vol. 54, pp. 51–69. DOI: 10.24411/1993-7601-2019-10003
- Kasatkina E.V., Vavilova D.D. Information-analytical system to forecast the factors of regional development. Problemy upravleniya=Control Siences, 2015, no. 4, pp. 25–34 (in Russian).
- Omuya E.O., Okeyo G.O., Kimwele M.W. Feature selection for classification using principal component analysis and information gain. Expert Systems with Applications, 2021, vol. 174, 114765. DOI: 10.1016/j.eswa.2021.114765
